

ABSTRACT
Introduction: Limb‐girdle muscular dystrophy type 2E (LGMD2E) is caused by mutations in the β‐sarcoglycan gene, which is expressed in skeletal, cardiac, and smooth muscles. β‐Sarcoglycan‐deficient (Sgcb‐null) mice develop severe muscular dystrophy and cardiomyopathy with focal areas of necrosis. Methods: In this study we performed morphological (histological and cellular characterization) and functional (isometric tetanic force and fatigue) analyses in dystrophic mice. Comparison studies were carried out in 1‐month‐old (clinical onset of the disease) and 7‐month‐old control mice (C57Bl/6J, Rag2/γc‐null) and immunocompetent and immunodeficient dystrophic mice (Sgcb‐null and Sgcb/Rag2/γc‐null, respectively). Results: We found that the lack of an immunological system resulted in an increase of calcification in striated muscles without impairing extensor digitorum longus muscle performance. Sgcb/Rag2/γc‐null muscles showed a significant reduction of alkaline phosphate‐positive mesoangioblasts. Discussion: The immunological system counteracts skeletal muscle degeneration in the murine model of LGMD2E. Muscle Nerve 58: 133–144, 2018
Keywords: β‐sarcoglycan, EDL, immunodeficient dystrophic mice, mesoangioblasts, smooth muscle
Abbreviations
- α‐SMA
alpha‐smooth muscle actin
- ANOVA
analysis of variance
- AP
alkaline phosphatase
- CSA
cross‐sectional area
- DGC
dystrophin‐glycoprotein complex
- DMD
Duchenne muscular dystrophy
- DMEM
Dulbecco's modified Eagle medium
- EDL
extensor digitorum longus
- FACS
fluorescence‐activated cell sorting
- FAP
fibroadipogenic progenitor
- GCN
gastrocnemius
- H&E
hematoxylin and eosin
- HS
horse serum
- IC
immunocompetent
- ID
immunodeficient
- LGMD2
limb‐girdle muscular dystrophy type 2
- MAB
mesoangioblast
- NADH
nicotinamide adenine dinucleotide
- NK
natural killer
- OCT
optimum cutting temperature
- PBS
phosphate‐buffered saline
- PFA
paraformaldehyde
- TcL
T cytotoxic lymphocyte
- TGF‐β
transforming growth factor‐beta
- ThL
T helper lymphocyte
- Treg L
T regulatory lymphocyte
In skeletal and cardiac muscles, dystrophin is associated with sarcolemmal and cytoskeletal proteins1 forming the dystrophin–glycoprotein complex (DGC), which provides a structural link between laminin 2 in the extracellular matrix and the actin‐based intracellular cytoskeleton.2 Thus, dystrophin provides a link between the outside and the inside of muscle cells, protecting them from contraction‐induced damage.3, 4, 5
Mutations in genes encoding several components of the DGC have been associated with the muscular dystrophies,1 which are a heterogeneous group of disorders characterized by progressive skeletal muscle wasting and weakness. Cardiac involvement is common in muscular dystrophies, but not necessarily related to the degree of skeletal myopathy.6 Several proteins contribute to the stability of the DGC complex and, among those, sarcoglycans constitute significant elements. Sarcoglycans (α, β, δ, ε, ζ) are transmembrane proteins that form a heteromeric complex,3 which is part of the DGC.5 Mutations in sarcoglycan genes cause autosomal recessive limb‐girdle muscular dystrophy (LGMD2, types C–F).3, 7, 8 In particular, LGMD type 2E is caused by mutations in the β‐sarcoglycan gene5 and is characterized by pelvic muscle weakness, early scapular winging, severe dilated cardiomyopathy, and lethal ventricular arrhythmias.9 Mouse models of all sarcoglycanopathies have been developed, including Sgcb‐null mice that demonstrate the disruption of the sarcoglycan and dystroglycan complexes in skeletal, cardiac, and smooth muscles, resulting in severe muscular dystrophy, cardiomyopathy, and vascular abnormalities. Pathologic features of Sgcb‐null skeletal muscles include fiber necrosis, calcification, fibrosis, and fatty infiltration.3, 9
Loss of cells and injury in skeletal and cardiac muscles are associated with a regenerative process driven by the final interaction among resident stem cells and differentiated cells. Satellite cells are skeletal muscle quiescent progenitors, activated during physiological muscle growth or after an injury.10 Despite their high myogenic capacities, there are limitations in the use of satellite cells for muscle regeneration, such as difficulty in cell migration from the sites of injection and the loss of regenerative efficiency after in vitro expansion.11 Alongside satellite cells, other cell types have been described for muscle regeneration. Mesoangioblasts (MABs) are vessel‐associated cells capable of differentiating into several mesodermal lineages, including skeletal muscle and smooth muscle cells.12, 13, 14, 15 Moreover, MABs constitute an interesting source for stem cell therapies given their renewal abilities and migration properties, and have been characterized also from cardiac tissues.13, 15, 16 Fibroadipogenic progenitors (FAPs) have been found to modulate myogenesis and, eventually, adipogenesis.17 Alongside the variety of stem cells that could potentially contribute to the regeneration process, infiltrating inflammatory and immune cells (neutrophils, macrophages, lymphocytes) have a crucial role in the regeneration process. Acute skeletal muscle injury causes an immediate transient wave of neutrophils, followed by a more persistent infiltration of M1 (pro‐inflammatory) and M2 (anti‐inflammatory/pro‐regenerative) macrophages. Injured skeletal muscles are also colonized by different populations of T cells, including T helper lymphocytes (ThL), which have both anti‐ and pro‐fibrotic roles18; T cytotoxic lymphocytes (TcL), responsible for inflammatory response (promoting eosinophilia19 and fibrosis20, 21); and T regulatory lymphocytes (Treg L), which in turn control the inflammatory response by promoting the M1/M2 switch and the activation of satellite cells.22
Previous investigations on animal models of Duchenne muscular dystrophy (DMD) have shown that cellular immune responses by TcL and ThL contribute to muscle pathology, and that removal of specific lymphoid cell populations can reduce muscle pathology. In addition, innate immune responses may also promote muscular dystrophy by infiltration of myeloid cell populations into the dystrophic muscle. Collectively, those earlier studies suggested that the contribution of the immune system to muscular dystrophy may be significant, and that therapeutic approaches based on immune interventions may ameliorate the pathologic progression of dystrophin and sarcoglycan deficiencies.20, 21
In Sgcb‐null mice, death occurs by heart failure at 16–18 months of age.3 Healing of the infarcted heart is associated with intense angiogenesis. The rapid induction of angiogenic growth factors results in formation of a network of hyperpermeable neovessels that may lack a pericyte coat.23 As the infarct vasculature matures, some neovessels are coated with pericytes, whereas uncoated vessels regress.24 Mature coated vessels protected from regression exhibit decreased inflammatory activity and contribute to scar stabilization.25 There are no immunodeficient animal models available for LGMD2E to evaluate the consequences of immune system deficiency in the dystrophic condition. Thus, we have generated a new animal model for this purpose, the Sgcb/Rag2/γc‐null mouse, which lacks functional T, B, and natural killer (NK) cells and is affected by LGMD2E.
The aim of our work was to characterize this new animal model and determine whether immunodeficiency, as just described, affects the dystrophic phenotype.
METHODS
Animal Handling
All protocols were conducted in accordance with the guidelines of the Animal Welfare Committee of KU Leuven Belgian/European legislation and with the ethical approval of KU Leuven (P095/2012). Sgcb/Rag2/γc‐null mice were generated in our laboratory. C57Bl/6J and Rag2/γc‐null mice are used as controls. Four 1‐month‐old and 4 7‐month‐old mice were used per strain.
Histological Analyses
Cardiac and skeletal muscles (gastrocnemius and diaphragm) were collected from 1‐ and 7‐month‐old C57Bl/6J, Rag2/γc‐null, Sgcb‐null, and Sgcb/Rag2/_c‐null mice. Tissues were fixed in 4% paraformaldehyde and embedded in paraffin or cryoconserved in optimum cutting temperature (OCT) compound (Sakura Finetek, Torrance, California) following the manufacturer's instructions. Hematoxylin‐and‐eosin (H&E) and Masson trichrome (Sigma‐Aldrich, St. Louis, Missouri) staining were performed on 5‐μm‐thick paraffin slices, and nicotinamide adenine dinucleotide (NADH) transferase staining was performed on 7‐μm‐thick cryosections, as reported elsewhere.26
Cell Isolation
Cell populations were isolated from hindlimb muscle, including tibialis anterior, gastrocnemius, extensor digitorum longus (EDL), and soleus, and heart biopsies were obtained from 1‐ and 7‐month‐old C57Bl/6J, Rag2/γc‐null, Sgcb‐null, and Sgcb/Rag2/γc‐null mice. Biopsies were taken and small pieces (approximately 2 × 2 × 2 mm) were cultured on collagen‐coated dishes. While spreading cells appeared from fragments, they were carefully removed and cells were detached with TriplE (Life Technologies/Gibco, Grand Island, New York). A large portion of the mixed cell populations obtained from 1‐ and 7‐month‐old animals was processed by flourescence‐activated cell sorting (FACS) analysis for sorting alkaline phosphate‐positive (AP+) fractions, and a small portion was plated onto collagen‐coated Petri dishes and incubated (37 °C in a 5% CO2, 5% O2 humidified incubator) for further characterization. AP was used as a specific marker to sort pure MAB populations, as previously described.27 MABs, as an AP+ cell fraction, were cultured and expanded on collagen‐coated plastic in Dulbecco's modified Eagle medium‐20 (DMEM‐20) culture medium (DMEM high glucose, 20% fetal calf serum [FCS], 1% penicillin/streptomycin solution [100 units], 2 mmol/L glutamine, 1 mmol/L sodium pyruvate, 1 × nonessential amino acid solution, 0.5% β‐mercaptoethanol). When cells reached 80%–85% confluence, they were split in a 1:4 ratio. The mixed cell populations were characterized with AP enzymatic staining using 5‐bromo‐4‐chloro‐3'‐indolyphosphate p‐toluidine salt (BCT) and nitro‐blue tetrazolium chloride (NBT) reagent (Sigma‐Aldrich). Because we failed to obtain a consistent number of viable cells after cell sorting, mixed cell populations from 7‐month‐old animals were directly plated and expanded for further characterization.
Differentiation Assays
Smooth muscle differentiation was induced in a mixed population and in MABs (AP+ cells) by transforming growth factor‐β (TGF‐β) treatment (DMEM high glucose, 2% heat‐inactivated horse serum [HS], 1% penicillin/streptomycin solution, 2 mmol/L glutamine, 1 mmol/L sodium pyruvate, and 10 ng/ml TGF‐β; Peprotech, Oak Park, California). On day 0, 5 × 10³ cells/cm2, were plated in collagen‐coated Petri dishes and incubated at 37 °C with DMEM‐20 medium. After 24 h, cells were washed with phosphate‐buffered saline (PBS), cultured in the smooth muscle differentiation medium, and incubated for 7 days. At the end of differentiation, cultures were fixed with 4% paraformaldehyde (PFA; Sigma Aldrich) in PBS.
Immunofluorescence Staining
Immunofluorescence staining was performed following the commonly used steps of Triton‐based (Sigma‐Aldrich) permeabilization and background blocking with donkey serum (Sigma‐Aldrich). Cells or 7‐μm‐thick cryosections were incubated overnight with primary antibodies (reported hereafter) at 4 °C and, after washing, 1‐h incubation with 1:500 Alexa Fluor‐conjugated donkey secondary antibodies (Thermo Fisher Scientific, Waltham, Massachusetts) was performed. Nuclei were counterstained with Hoechst stain.
Primary antibodies and relative dilutions were: α‐smooth muscle actin (α‐SMA) Cy3 mouse monoclonal antibody (1:200; Sigma‐Aldrich); calponin, rabbit monoclonal antibody (1:200; Abcam, Cambridge, UK); F4/80 (macrophage marker) rat monoclonal antibody (1:200; Abcam); CD206 (mannose receptor) (1:100; Abcam, UK); alkaline phosphatase (AP) goat polyclonal antibody (1:500; R&D Systems, Minneapolis, Minnesota); BA‐D5 (myosin heavy chain type I) mouse monoclonal antibody (1:100; Developmental Studies Hybridoma Bank, University of Iowa); and SC‐71 (myosin heavy chain type 2a) mouse monoclonal antibody (1:100; Developmental Studies Hybridoma Bank, University of Iowa). Images were acquired microscopically (Eclipse Ti; Nikon, Tokyo, Japan) and morphological analysis was performed with ImageJ software (National Institutes of Health, Bethesda, Maryland)
Muscle Function by Intact Muscle Test System
The EDL was immediately excised from each mouse and maintained in a storage solution (Krebs–Ringer bicarbonate buffer, including MgCl2, KCl, NaCl, Na2HPO4, NaH2PO4, d‐glucose, and NaHCO3) to which was added potassium phosphate (1.2 mmol/L), magnesium sulfate (0.57 mmol/L), calcium chloride (2.00 mmol/L), and hydroxylethyl piperazine ethane sulfonic acid (10.0 mmol/L), and gassed with a mixture of 95% O2 and 5% CO2 at room temperature (pH 7.3 ± 0.3, osmolarity 267 ± 5% mOsm/L).28, 29 The test was performed in a temperature‐controlled (30 °C) chamber containing the buffer solution and continuously gassed with a mixture of 95% O2 and 5% CO2.30 One end of the muscle was connected to a fixed clamp while the other end was linked to the lever‐arm of a 300B actuator/transducer (Aurora Scientific, Aurora, Ontario, Canada), using a nylon thread. Compliance of the nylon thread and muscle were 0.187 ± 0.004 μm/mN and 2.000 ± 0.082 μm/mN, respectively.
Switching between isometric and isotonic measurements without removing the specimen from the bath was made possible by controlling the force and the position mode of the lever arm.
Two platinum electrodes located about 2 mm from each side of the isolated muscle allowed electrical stimulation with 200‐mA controlled‐current pulses (pulse voltage approximately 10 V). For each experiment, the initial muscle length was adjusted to a length (L 0) that produced the highest twitch force. The muscle cross‐sectional area (CSA) was determined by dividing the muscle mass (m) by the product of the optimal fiber length (L f) and the density of mammalian skeletal muscle (1.06 mg/mm3). The L f was determined by multiplying that value of L 0 for the fiber length to the muscle length ratio (0.44 for the EDL) indicated in the literature28, 31:
The protocol allowed for measurement of isometric and isotonic parameters, inducing the maximum force and fatigue sequence.
The muscle was initially stimulated with a 0.5‐ms single pulse to measure the isometric twitch force and contraction time. A second pulse was applied to check the consistency of the values obtained and to balance muscle equilibration before applying tetanic stimulation.
The muscle was then subjected to a first pulse (0.6 s at 120 Hz) to induce unfused tetanus, and then a second pulse (0.6 s at 180 Hz) to evoke the maximal tetanic force.
For measurement of fatigue, muscles were repeatedly stimulated under isotonic conditions with a series pulses (0.4 s at 120 Hz). When the isolated muscle was no longer able to shorten compared with the reference force (one third of its maximum force),32, 33 the fatigue test was terminated.
A final isometric stimulus was performed to end the protocol and to determine whether the muscle was damaged after the fatigue sequence. Muscle specimens were weighed after removal of the tendons to calculate CSA values.
Statistics
Comparisons between multiple data sets were analyzed by one‐way analysis of variance (ANOVA) with Tukey multiple comparison posttests. The Student t‐test was used for comparisons between 2 data sets as immunodeficient mice vs. immunocompetent mice. All data were analyzed using GraphPad software (GraphPad Prism version 5.1; GraphPad, Inc., La Jolla, California).
RESULTS
Histological Analysis of Skeletal and Cardiac Muscles from Sgcb/Rag2/γc‐Null Mice
Fibrosis, fiber degeneration, and calcification were present mainly in muscles from immunodeficient (ID)‐Sgcb‐null mice. Central nucleated fibers were seen in all dystrophic skeletal muscle sections (Fig. 1A and B). Muscle calcifications were observed directly in intact diaphragms from dystrophic mice compared with wild‐type and Rag2/γc‐null mice (Fig. 1C). Fibrosis (Fig. 1D) and calcification (Fig. 1E) quantifications were performed using H&E and Masson trichrome staining. In cardiac and diaphragm muscles of ID‐Sgcb‐null mice, increased fibrosis was observed when compared with immunocompetent (IC)‐Sgcb‐null mice, whereas comparable fibrosis was present in the hindlimb muscles of both ID‐Sgcb‐null and IC‐Sgcb‐null mice. Calcification areas were absent in control muscles, but were present in ID‐Sgcb‐null mice compared with IC‐Sgcb null mice, in both skeletal and cardiac muscles.
Figure 1.
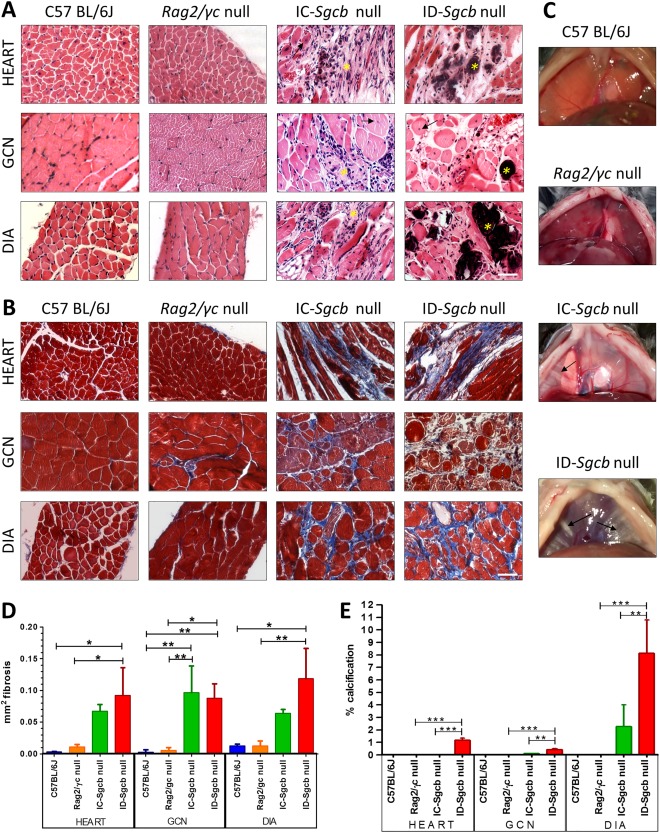
Histological analysis of gastrocnemius (GCN), diaphragm (DIA), and cardiac muscles from C57Bl/6J, Rag2/γc‐null mice, IC‐Sgcb‐null, and ID‐Sgcb‐null mice. Paraffin sections were obtained from 7‐month‐old mice and stained with hematoxylin and eosin (H&E) (A) and Masson trichrome (B). Fibrosis, fiber degeneration, and central nucleation of fibers are present only in dystrophic samples (asterisks and arrows, respectively). Similarly, large areas of necrosis and mild fibrosis are seen in dystrophic cardiac muscles. Bar = 50 μm. Muscle calcifications (arrows) can be observed directly in intact diaphragms from dystrophic mice (C). Fibrosis quantification (mm2) of gastrocnemius (GCN), diaphragm (DIA), and cardiac muscles is presented as mean ± standard deviation in (D). Calcification in GCN muscles, DIA, and cardiac muscles is reported as mean ± standard deviation in (E). One‐way ANOVA test (n = 4): *P < 0.05; **P < 0.01; ***P < 0.001. [Color figure can be viewed at http://wileyonlinelibrary.com]
Findings on infiltration of macrophages M1 and M2, in the hindlimb muscle and heart, are presented in Figure 2A as F4/80‐positive and CD206‐positive cells, respectively. Cell quantification showed increased amounts of M1 in the hindlimb of ID‐Sgcb‐null mice compared with controls and IC‐Sgcb‐null mice (Fig. 2B). In the cardiac muscles, an increase of M2 macrophages in IC‐Sgcb‐null vs. ID‐Sgcb‐null mice and controls was observed (Fig. 2C). No differences were observed for M2/M1 ratio in hindlimb and heart (Fig. 2D).
Figure 2.
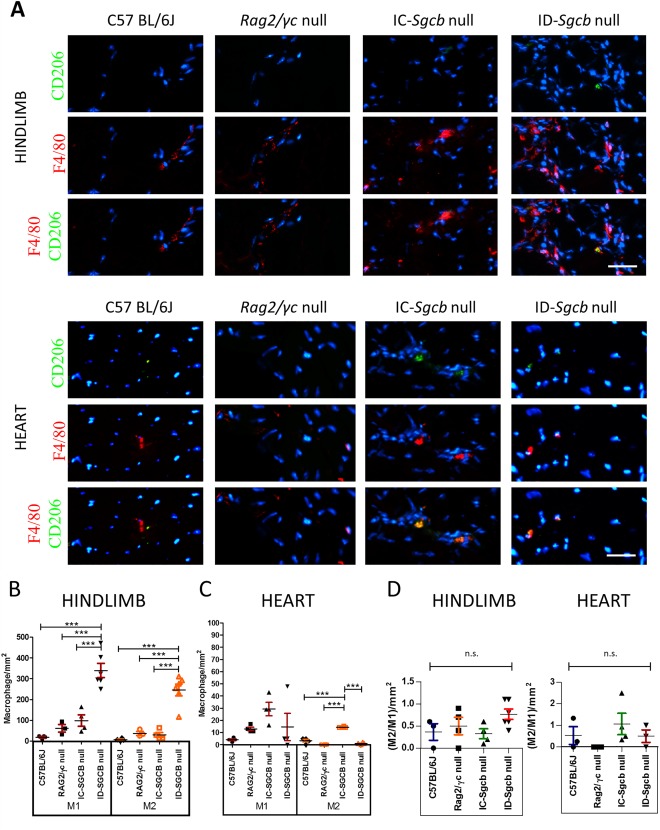
Inflammatory infiltration in skeletal muscle and cardiac muscles from C57Bl/6J, Rag2/γc null mice, IC‐Sgcb null, and ID‐Sgcb null mice. Muscle sections were obtained from 7‐month‐old mice. Distribution of type M1 and M2 macrophages is shown in (A). F4/80Ab was used to identify M1 macrophages (red). CD206‐Ab was used to detect M2 macrophages (green). Nuclei were counterstained with Hoecht stain (blue). Bar = 50 μm. M1 macrophage quantification (cells/mm2) in the hindlimb is shown as mean ± standard deviation in (B). M2 macrophage quantification (cells/mm2) in the heart is shown as mean ± standard deviation in (C). Ratio of M2/M1 in hindlimb and heart in shown as mean ± standard deviation in (D). One‐way ANOVA test (n = 4): ***P < 0.001. [Color figure can be viewed at http://wileyonlinelibrary.com]
Types of Fibers and Functional Comparisons between Groups
Immunostaining with specific antibodies was performed on cross‐sections of gastrocnemius muscles from IC‐Sgcb‐null, ID‐Sgcb‐null, and control mice. We were able to distinguish between slow oxidative (Myh1‐positive) and fast glycolytic type A (Myh2a‐positive; Fig. 3) fibers. Fiber CSA was measured and its percentage distribution, for both fast and slow fibers, is presented in Figure 3. A statistically significant reduction of CSA was found in both dystrophic groups of mice compared with controls for both fiber types, although this was more evident in ID‐Sgcb‐null mice. NADH staining on the same samples showed comparable results and further allowed identification of slow oxidative, fast oxidative type A, and fast glycolytic type B fibers (see Fig. S1 in the Supplementary Material online). Quantification of fiber CSA and its percentage distribution again showed a significant reduction for the IC‐ and ID‐Sgcb‐null mice compared with controls (see Fig. S1 online). Mean values of the main morphological parameters of EDL are reported with their standard deviations for both 1‐ and 7‐month assessment in Table S1 (online). However, no significant differences were observed.
Figure 3.
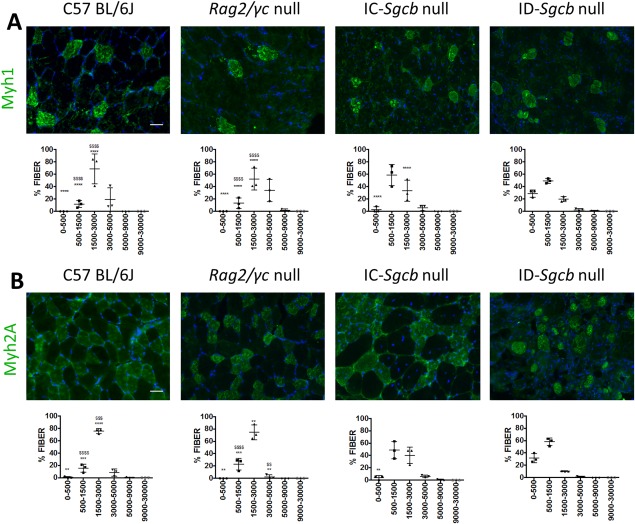
Immunofluorescence staining for fiber types from skeletal muscle sections of 7‐month‐old C57Bl/6J, Rag2/γc‐null, IC‐Sgcb‐null, and ID‐Sgcb‐null mice. Antibodies used for this immunostaining indicate fiber types 1 (A) and 2A (B). Bar = 50 μm. Fiber cross‐sectional area (CSA) was measured and the distribution is shown as mean ± standard deviation for both slow and glycolytic type A fibers. Several sections from 3 mice for each cohort were evaluated. One‐way ANOVA test: compared with IC‐Sgcb ($) and compared with ID‐Sgcb (*) (n = 3): **,$$ P < 0.01; ***P < 0.001; ****,$$$$ P < 0.0001. [Color figure can be viewed at http://wileyonlinelibrary.com]
We also measured muscle strength of the dystrophic and control mice using electrical stimulation. The mean of maximum forces measured during fused tetanus stimulation at 180 Hz is reported in Figure 4A. Maximum forces in the 1‐month‐old samples were lower compared with the 7‐month‐old samples. At 1 month, ID‐Sgcb‐null EDL was impaired compared with wild‐type and IC‐Sgcb‐null animals. No statistically significant differences were observed in the 7‐month‐old dystrophic muscles, and their maximum forces were significantly lower compared with controls. The specific force at 180 Hz (Fig. 4B) showed a statistically significant decrease for ID‐Sgcb‐null compared with IC‐Sgcb null mice at 1 month, but this difference disappeared at 7 months. The specific force at 200 Hz did not show statistically significant differences between the immunocompetent and immunodeficient dystrophic muscles (Fig. 4C).
Figure 4.
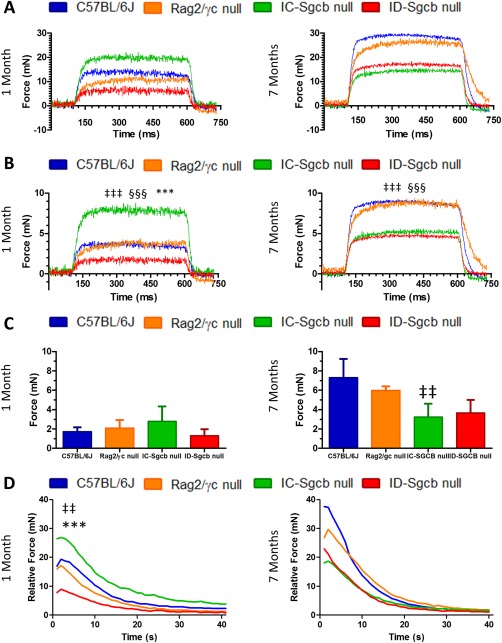
Functional muscle analysis from C57Bl/6J, Rag2/γc‐null mice, IC‐Sgcb‐null and ID‐Sgcb‐null mice. Isometric force measured during a fused tetanus stimulation at 180 Hz is reported in (A) as maximum force, and normalization by muscle cross‐sectional is reported in (B) as specific force. Another specific force, calculated with stimulation at 200 Hz, is reported as a bar chart in (C). The time course of force decline during 40 s of fatiguing stimulation is shown in (D) as fatigue. Data are presented as mean from 1‐month‐old mice (panels at left) and 7‐month‐old mice (panels at right) (n = 5). One‐way ANOVA test: C57Bl/6J vs. IC‐Sgcb‐null (‡); Rag2/γc null vs. ID‐Sgcb null (§); IC‐Sgcb null vs. ID‐Sgcb null (*) (n = 4); ‡‡,§§,**P < 0.01; ‡‡‡,§§§,***P < 0.001. [Color figure can be viewed at http://wileyonlinelibrary.com]
The fatigue test, which identifies the force decline only during 40 s of fatiguing stimulation, is reported in Figure 4B. One‐month‐old EDL muscles from ID‐Sgcb‐null mice fatigued more rapidly compared with IC‐Sgcb‐null and wild‐type muscles. At 7 months, EDL muscles from both dystrophic mice fatigued at the same rate and more than wild‐type muscles. Half‐relaxation tension, calculated with maximum and minimum forces, was statistically different between ID‐Sgcb‐null and the IC‐Sgcb‐null mice only at 1 month of age (Table 1).
Table 1.
Functional muscle analysis from C57Bl/6J, Rag2/γc‐null, IC‐Sgcb‐null, and ID‐Sgcb‐null mice
| C57Bl/6J | Rag2/γc‐null | IC‐Sgcb‐null | ID‐Sgcb‐null | |
|---|---|---|---|---|
| 1 month | ||||
| Fmax (mN) | 6.16 ± 2.06 | 6.05 ± 0.11 | 6.35 ± 2.65 | 4.43 ± 1.52 |
| Frel (mN) | 2.05 ± 0.69 | 2.02 ± 0.04 | 2.12 ± 0.88 | 1.48 ± 0.51 |
| Fspec (mN) | 1.72 ± 0.47 | 2.32 ± 1.03 | 2.79 ± 1.55 | 1.30 ± 0.69 |
| Half‐relaxation tension (mN) | 9.23 ± 5.85 | 2.69 ± 0.11 | 12.45 ± 4 | 1.84 ± 0.96[Link] |
| 7 months | ||||
| Fmax (mN) | 32.18 ± 2.03 | 29.72 ± 2.35 | 19.82 ± 4.86‡‡ | 22.97 ± 11.83 |
| Frel (mN) | 10.73 ± 0.68 | 9.91 ± 0.78 | 6.61 ± 1.62 | 7.66 ± 3.94 |
| Fspec (mN) | 7.31 ± 1.93 | 6.43 ± 2.28 | 3.23 ± 1.37‡‡ | 4.22 ± 2.53 |
| Half‐relaxation tension (mN) | 15.79 ± 1.05 | 14.43 ± 1.13 | 9.45 ± 2 .46‡‡ | 11.25 ± 5.83 |
Maximum force (Fmax), relative force (Frel), specific force (Fspec), and half‐relaxation tension values ± SD are reported for 1‐month‐old and 7‐month‐old mice.
One‐way ANOVA test: IC‐Sgcb null vs ID‐Sgcb null (*); C57Bl/6J vs IC‐Sgcb null (‡).
*P < 0.05.
‡‡P < 0.01.
MAB Quantification and Characterization of the Groups
Quantification of MABs as AP+ cells in both skeletal and cardiac muscle (Fig. 5B) showed a significant decrease in ID‐Sgcb‐null mice compared with IC‐Sgcb‐null mice at 7 months of age. We isolated a heterogeneous cell population using primary culture biopsies of both heart and hindlimb from the 1‐ and 7‐month‐old mice. The number of MABs, as AP+ cells, was quantitated by enzymatic cytochemistry reaction stain, which revealed purple positive cells (Fig. 5C and E). We detected no significant differences in the amount of positive purple cells from 1‐month‐old samples (Fig. 5D); however, a statistically significant increase in AP+ cells was observed in 7‐month‐old ID‐Sgcb‐null compared with IC‐Sgcb‐null samples (Fig. 5F). In general, the number of MABs was reduced in 7‐month‐old biopsies of both heart and hindlimb compared with the 1‐month samples. FACS analysis findings for the AP+ cells are presented in Figure 6. Due to the differing sensitivity of the technique, the percentage of AP+ cells obtained by FACS was much lower than that seen with enzymatic staining. Nevertheless, the number of AP+ cells in the hearts of the C57Bl/6J control mice was greater than that observed in the other animals (see Fig. S2A–C online). Notably, electrical stimulation with the muscle strength measurement instrument (300B actuator/transducer system) impacted positively the number of MABs obtained from treated EDL muscles compared with contralateral untreated muscles (see Fig. S3 online). Finally, similar amounts of smooth muscle cells, as calponin and SMA‐positive cells, were obtained from 1‐ and 7‐month samples (Fig. 6A and B). However, smooth muscle differentiation potential among MAB interstitial subpopulations was more evident in dystrophic MABs compared with controls (Fig. 6C).
Figure 5.
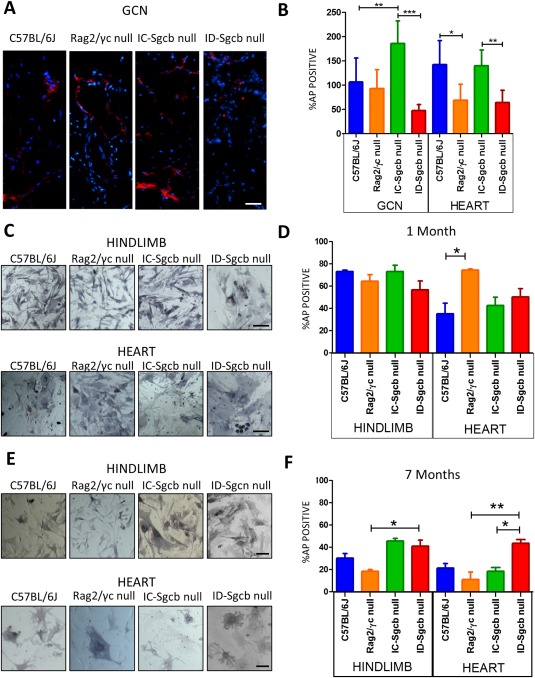
Pericyte quantification from C57Bl/6J, Rag2/γc‐null mice, IC‐Sgcb‐null and ID‐Sgcb‐null mice. Anti‐alkaline phosphatase antibodies (red fluorophore) reveal pericytes in red in GCN sections. Nuclei are counterstained in blue with Hoecht stain (A). Bar = 25 µm. Quantification of AP+ cells is reported in (B). AP enzymatic staining was performed on a mix population obtained by primary culture of biopsies from hindlimb muscle and heart of 1‐month‐old (C) (bar = 25 µm) and 7‐month‐old (E) mice. Bar = 10 µm. Quantification of the AP+ cells in hindlimbs and hearts from 1‐month‐old (D) and 7‐month‐old (F) mice is shown as mean ± SEM. One‐way ANOVA test (n = 5): *P < 0.05; **P < 0.01; ***P < 0.001. [Color figure can be viewed at http://wileyonlinelibrary.com]
Figure 6.
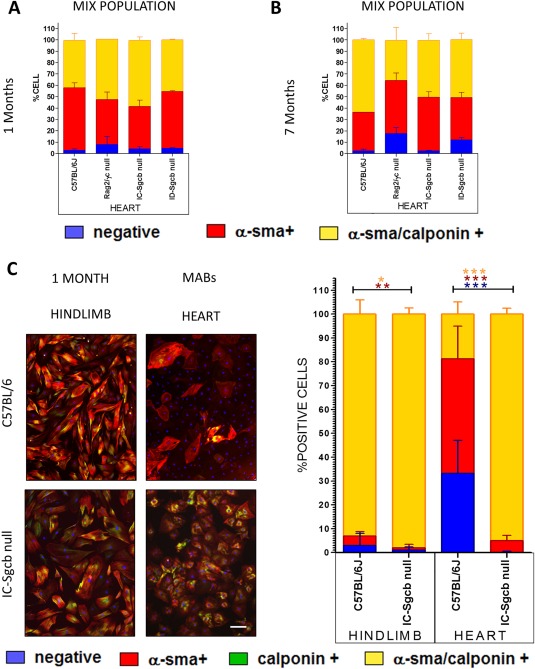
Smooth muscle differentiation of interstitial cells and pericytes from C57Bl/6J, Rag2/γc‐null, IC‐Sgcb‐null, and ID‐Sgcb‐null mice. Quantification of α‐SMA+, calponin+, αSMA/calponin double‐positive and double‐negative cells from 1‐month‐old (A) and 7‐month‐old (B) mice is shown. Immunofluorescence analysis for α‐SMA (red) and calponin (green) and quantification of positive cells derived from cardiac and hindlimb pericytes of 1‐month‐old mice is shown in (C). One‐way ANOVA test (n = 5): *P < 0.05; **P < 0.01; ***P < 0.001; t‐test: *P < 0.05; **P < 0.01. [Color figure can be viewed at http://wileyonlinelibrary.com]
DISCUSSION
Previous studies on immunodeficient DMD models showed that loss of T and B cells improved muscle strength and reduced fibrosis in diaphragm and heart.34, 35 However, clear disadvantages of mdx‐based dystrophic animal models include the normal lifespan of these animals and the revertant fibers that affect data interpretation. Indeed, one study showed that Rag2–Il2rb–Dmd mice, a non‐revertant mutant dystrophin mouse model lacking T, B, and NK cells, had higher creatine kinase levels compared with mdx and wild‐type strains.36 In addition, a severe muscle phenotype was observed in Sgca‐null/scid/beige mice,37 an animal model of LGMD2D in which the scid and beige mutations cause a lack of both T and B lymphocytes and a selective impairment of NK cell functions.
Despite controversy in the literature regarding the impact of the immune system in chronic dystrophic muscle degeneration, there have been no animal models to address this crucial issue in other forms of dystrophy. Thus, in our study, C57Bl/6J mouse models of LGMD2E have been assessed in the presence or absence of a functional immune system. To determine whether the differences found are consequences of the lack of the immune system and related to dystrophic muscular degeneration, wild‐type and immunodeficient mice have been employed for comparison studies.
We detected an increase in the pathologic features of dystrophy in ID‐Sgcb‐null mice compared with IC‐Sgcb‐null mice. Our results are consistent with other studies that reported an increase in muscle fibrosis in ID dystrophic muscle.36, 37 In addition, our data show a significant increase in muscle calcification in ID‐Sgcb cardiac and skeletal muscles, especially in the diaphragm, where the areas of calcification were clearly evident in freshly isolated muscles. Ectopic muscle calcification has been described in muscular dystrophy, but we identified a significant increase in muscle calcification in dystrophic mice due to absence of the immune system.
Interestingly, the number of macrophages in the hindlimb muscles tripled in the ID‐Sgcb‐null mice compared with the IC‐Sgcb‐null mice and controls, but there was a sharp decrease in the hearts.
Furthermore, M1 and M2 macrophage levels were comparable in the skeletal muscle of IC‐Sgcb‐null and ID‐Sgcb‐null animals. These findings are consistent with a previously described accumulation of M1 and M2 macrophages in skeletal muscle after injury, or in a chronic degenerative model of skeletal muscle.38, 39 In the heart, however, M2 macrophages decreased dramatically in IC‐Sgcb‐null mice compared with ID‐Sgcb null mice. Notably, M2 macrophages are commonly associated with advanced stages of tissue repair and have an anti‐inflammatory role further sustained by the factors secreted, such as TGF‐β and interleukin‐10.40 Moreover, recent work has shown that M2 macrophages may play a major role in contribution to regeneration of murine infarcted hearts.41 In this light, a decrease of pro‐regenerative macrophages in the heart of ID‐Sgcb‐null mice may correlate with a worsening of the cardiomyopathy.
In spite of the histologically negative features, functional performance at 7 months of age, when the dystrophic disease has advanced, was not worse in ID‐Sgcb‐null mice compared with IC‐Sgcb‐null mice. Functional parameters, including absolute force and fatigue, showed the same loss of force in both dystrophic mouse models compared with controls. However, at 1 month of age, IC‐Sgcb‐null muscles performed better than ID‐Sgcb‐null muscles. We hypothesize that the differences observed in functional parameters of 1‐month EDL muscles between the ID‐Sgcb‐null and IC‐Sgcb‐null animals were probably caused by earlier onset of muscle impairment in the absence of an immune system. It is likely that this discrepancy is lost after several muscle degeneration/regeneration cycles occurring over the course of 6 months.
Different types of resident stem cells have been described as actively participating in tissue regeneration in the skeletal and cardiac muscle interstitia, including MABs.12, 16 MABs have been mainly studied for their myogenic capacity. In addition, they differentiate very efficiently to smooth muscle cells in response to TGF‐β.42 Moreover, it has been reported in previous work that MABs originating from the heart and aorta of Sgcb‐null mice aberrantly differentiated into skeletal muscle cells both in vitro and in vivo when transplanted in an infarcted heart.43 Herein we have reported that the number of MABs derived from 7‐month‐old ID‐Sgcb‐null mice was much lower than that of IC‐Sgcb‐null mice. This was probably due to faster depletion of the MAB cell pool in the immunodeficient dystrophic environment in an attempt to counteract muscle degeneration. Nevertheless, dystrophic MAB cultures from ID‐Sgcb‐null and IC‐Sgcb‐null mice showed similar proliferation capabilities. This suggests that proliferation of skeletal muscle MABs is not affected by long‐term exposure to an immunodeficient environment. Finally, we also found that the number of MABs obtained from the biopsies subjected to electrical stimulation was statistically higher compared with unstimulated MABs, consistent with previous studies showing a positive effect on cell proliferation in muscle subjected to electrical stimulations.44
We found that the overall differentiation potential of skeletal muscle MABs to smooth muscle cells was much higher compared with cardiac MABs, indicating that the specific tissue turnover of the heart is much lower than that of skeletal muscle. Interestingly, 90% of cardiac dystrophic MABs isolated from 1‐month‐old IC‐Sgcb‐null mice fully differentiated into calponin/SMA double‐positive cells, whereas only 20% did so from wild‐type MABs. This strongly suggests that their differentiation potential is altered by the dystrophic environment, which requires more vasculature progenitors for tissue repair. This likely accelerates their differentiation program and in the long run may be responsible for progenitor senescence.45
In conclusion, we have provided evidence that the immunodeficiency system associated with the dystrophic phenotype results in increased areas of muscle calcification and reduced fiber sizes, without impairing EDL muscle performance. We also observed a decrease in the number of M2 anti‐inflammatory macrophages in immunodeficient dystrophic hearts. This may contribute to cardiac degeneration in Sgcb‐null mice. Thus, further analysis at a late stage of the disease will be needed to obtain a full understanding of the immune system's involvement in disease progression.
The authors thank K. P. Campbell (University of Iowa) for providing the Sgcb‐null mice.
Ethical Publication Statement: We (the authors) confirm that we have read the Journal's position on issues involved in ethical publication and affirm that this report is consistent with those guidelines.
Supporting information
Additional supporting information may be found online in the Supporting Information section at the end of the article.
Supporting Information 1
Funding: “Opening the Future” campaign (EJJ‐OPTFUT‐02010), CARIPLO 2015_0634, FWO (G088715N, G060612N, G0A8813N), GOA (EJJ‐C2161‐GOA/11/012), IUAP‐VII/07 (EJJ‐C4851‐17/07‐P), OT 09‐053 (EJJ‐C0420‐OT/09/053), Project Financing Stem Cells (PFO3 10/019), and Rondoufonds voor Duchenne Onderzoek (EQQ‐FODUCH‐O2010).
Conflicts of Interest: None of the authors have any conflict of interest to disclose.
REFERENCES
- 1. Ozawa E, Noguchi S, Mizuno Y, Hagiwara Y, Yoshida M. From dystrophinopathy to sarcoglycanopathy: evolution of a concept of muscular dystrophy. Muscle Nerve 1998;21:421–438. [DOI] [PubMed] [Google Scholar]
- 2. Ervasti JM, Campbell KP. A role for the dystphin‐glycoprotein complex as a transmembrane linker between laminin and actin. J Cell Biol 1993;122:809–823. [DOI] [PMC free article] [PubMed] [Google Scholar]
- 3. Durbeej M, Cohn RD, Hrstka RF, Moore SA, Allamand V, Davidson BL, et al Disruption of the β‐sarcoglycan gene reveals pathogenetic complexity of limb‐girdle muscular dystrophy type 2E. Mol Cell 2000;5:141–151. [DOI] [PubMed] [Google Scholar]
- 4. Wheeler MT, McNally EM. Sarcoglycans in vascular smooth and striated muscle. Trends Cardiovasc Med 2003;13:238–243. [DOI] [PubMed] [Google Scholar]
- 5. Coral‐Vazquez R, et al Disruption of the sarcoglycan–sarcospan complex in vascular smooth muscle: a novel mechanism for cardiomyopathy and muscular dystrophy. Cell 1999;98:465–474. [DOI] [PubMed] [Google Scholar]
- 6. Hermans M, et al Hereditary muscular dystrophies and the heart. Neuromuscul Disord 2010;20:479–492. [DOI] [PubMed] [Google Scholar]
- 7. Bönnemann CG, et al β‐Sarcoglycan (A3b) mutations cause autosomal recessive muscular dystrophy with loss of the sarcoglycan complex. Nat Genet 1995;11:266–273. [DOI] [PubMed] [Google Scholar]
- 8. McNally EM, et al Mutations that disrupt the carboxyl‐terminus of γ‐sarcoglycan cause muscular dystrophy. Hum Mol Genet 1996;5:1841–1847. [DOI] [PubMed] [Google Scholar]
- 9. Durbeej M, Campbell KP. Muscular dystrophies involving the dystrophin–glycoprotein complex: an overview of current mouse models. Curr Opin Genet Devel 2002;12:349–361. [DOI] [PubMed] [Google Scholar]
- 10. Cossu G, Biressi S. Satellite cells, myoblasts and other occasional myogenic progenitors: possible origin, phenotypic features and role in muscle regeneration. Semin Cell Dev Biol 2005;16:623–631. [DOI] [PubMed] [Google Scholar]
- 11. Montarras D, et al Direct isolation of satellite cells for skeletal muscle regeneration. Science 2005;309:2064–2067. [DOI] [PubMed] [Google Scholar]
- 12. Dellavalle A. et al Pericytes of human skeletal muscle are myogenic precursors distinct from satellite cells. Nat Cell Biol 2007;9:255–267. [DOI] [PubMed] [Google Scholar]
- 13. Sampaolesi M, et al Mesoangioblast stem cells ameliorate muscle function in dystrophic dogs. Nature 2006;444:574. [DOI] [PubMed] [Google Scholar]
- 14. D'Angelo F, Armentano I, Cacciotti I, Tiribuzi R, Quattrocelli M, Del Gaudio C, et al Tuning multi/pluri‐potent stem cell fate by electrospun poly(L‐lactic acid)‐calcium‐deficient hydroxyapatite nanocomposite mats. Biomacromolecules 2012;13:1350–60. [DOI] [PubMed] [Google Scholar]
- 15. Sampaolesi M, et al Cell therapy of α‐sarcoglycan null dystrophic mice through intra‐arterial delivery of mesoangioblasts. Science 2003;301:487–492. [DOI] [PubMed] [Google Scholar]
- 16. Galvez B, et al Cardiac mesoangioblasts are committed, self‐renewable progenitors, associated with small vessels of juvenile mouse ventricle. Cell Death Differ 2008;15:1417–1428. [DOI] [PubMed] [Google Scholar]
- 17. Joe AW, et al Muscle injury activates resident fibro/adipogenic progenitors that facilitate myogenesis. Nat Cell Biol 2010;12:153. [DOI] [PMC free article] [PubMed] [Google Scholar]
- 18. Wynn TA. Fibrotic disease and the TH1/TH2 paradigm. Nat Rev Immunol 2004;4:583–594. [DOI] [PMC free article] [PubMed] [Google Scholar]
- 19. Li L, Sad S, Kägi D, Mosmann TR. CD8Tc1 and Tc2 cells secrete distinct cytokine patterns in vitro and in vivo but induce similar inflammatory reactions. J Immunol 1997;158:4152–4161. [PubMed] [Google Scholar]
- 20. Spencer MJ, Montecino‐Rodriguez E, Dorshkind K, Tidball JG. Helper (CD4+) and cytotoxic (CD8+) T cells promote the pathology of dystrophin‐deficient muscle. Clin Immunol 2001;98:235–243. [DOI] [PubMed] [Google Scholar]
- 21. Morrison J, Lu QL, Pastoret C, Partridge T, Bou‐Gharios G. T‐cell‐dependent fibrosis in the mdx dystrophic mouse. Lab Invest 2000;80:881. [DOI] [PubMed] [Google Scholar]
- 22. Burzyn D, et al A special population of regulatory T cells potentiates muscle repair. Cell 2013;155:1282–1295. [DOI] [PMC free article] [PubMed] [Google Scholar]
- 23. Ren G, Michael LH, Entman ML, Frangogiannis NG. Morphological characteristics of the microvasculature in healing myocardial infarcts. J Histochem Cytochem 2002;50:71–79. [DOI] [PubMed] [Google Scholar]
- 24. Dobaczewski M, et al Vascular mural cells in healing canine myocardial infarcts. J Histochem Cytochem 2004;52:1019–1029. [DOI] [PubMed] [Google Scholar]
- 25. Zymek P, et al The role of platelet‐derived growth factor signaling in healing myocardial infarcts. J Am Coll Cardiol 2006;48:2315–2323. [DOI] [PubMed] [Google Scholar]
- 26. Berardi E, et al Skeletal muscle is enriched in hematopoietic stem cells and not inflammatory cells in cachectic mice. Neurol Res 2008;30:160–169. [DOI] [PubMed] [Google Scholar]
- 27. Quattrocelli M, et al Mesodermal iPSC–derived progenitor cells functionally regenerate cardiac and skeletal muscle. J Clin Invest 2015;125:4463–4482. [DOI] [PMC free article] [PubMed] [Google Scholar]
- 28. Vandenboom R, Hannon JD, Sieck GC. Isotonic force modulates force redevelopment rate of intact frog muscle fibres: evidence for cross‐bridge induced thin filament activation. J Physiol 2002;543:555–566. [DOI] [PMC free article] [PubMed] [Google Scholar]
- 29. Martonosi AN. Animal electricity, Ca2+ and muscle contraction. A brief history of muscle research. Acta Biochim Polonica 2000;47:493–516. [PubMed] [Google Scholar]
- 30. Brooks SV, Faulkner JA. Contractile properties of skeletal muscles from young, adult and aged mice. J Physiol 1988;404:71–82. [DOI] [PMC free article] [PubMed] [Google Scholar]
- 31. Hill A. The effect of load on the heat of shortening of muscle. Proc R Soc Lond B Biol Sci 1964;159:297–318. [DOI] [PubMed] [Google Scholar]
- 32. Emslie‐Smith AM, Arahata K, Engel AG. Major histocompatibility complex class I antigen expression, immunolocalization of interferon subtypes, and T cell‐mediated cytotoxicity in myopathies. Hum Pathol 1989;20:224–231. [DOI] [PubMed] [Google Scholar]
- 33. Seow C, Stephens N. Fatigue of mouse diaphragm muscle in isometric and isotonic contractions. J Appl Physiol 1988;64:2388–2393. [DOI] [PubMed] [Google Scholar]
- 34. Farini A, et al Novel insight into stem cell trafficking in dystrophic muscles. Int J Nanomed 2012;7:3059. [DOI] [PMC free article] [PubMed] [Google Scholar]
- 35. Farini A, et al T and B lymphocyte depletion has a marked effect on the fibrosis of dystrophic skeletal muscles in the scid/mdx mouse. J Pathol 2007;213:229–238. [DOI] [PubMed] [Google Scholar]
- 36. Vallese D, et al The Rag2–Il2rb–Dmd – mouse: a novel dystrophic and immunodeficient model to assess innovating therapeutic strategies for muscular dystrophies. Mol Ther 2013;21:1950–1957. [DOI] [PMC free article] [PubMed] [Google Scholar]
- 37. Cassano M, Quattrocelli M, Crippa S, Perini I, Ronzoni F, Sampaolesi M. Cellular mechanisms and local progenitor activation to regulate skeletal muscle mass. J Muscle Res Cell Motil 2009;30:243–53. [DOI] [PubMed] [Google Scholar]
- 38. Novak ML, Weinheimer‐Haus EM, Koh TJ. Macrophage activation and skeletal muscle healing following traumatic injury. J Pathol 2014;232:344–355. [DOI] [PMC free article] [PubMed] [Google Scholar]
- 39. Kharraz Y, Guerra J, Mann CJ, Serrano AL, Muñoz‐Cánoves P. Macrophage plasticity and the role of inflammation in skeletal muscle repair. Mediators Inflamm 2013;2013:491497. [DOI] [PMC free article] [PubMed] [Google Scholar]
- 40. Bosurgi L, et al Transplanted mesoangioblasts require macrophage IL‐10 for survival in a mouse model of muscle injury. J Immunol 2012;188:6267–6277. [DOI] [PubMed] [Google Scholar]
- 41. Shiraishi M, et al Alternatively activated macrophages determine repair of the infarcted adult murine heart. J Clin Invest 2016;126:2151–2166. [DOI] [PMC free article] [PubMed] [Google Scholar]
- 42. Tagliafico E, et al TGFβ/BMP activate the smooth muscle/bone differentiation programs in mesoangioblasts. J Cell Sci 2004;117:4377–4388. [DOI] [PubMed] [Google Scholar]
- 43. Crippa S, et al miR669a and miR669q prevent skeletal muscle differentiation in postnatal cardiac progenitors. J Cell Biol 2011;193:1197–1212. [DOI] [PMC free article] [PubMed] [Google Scholar]
- 44. Maziarz A, et al How electromagnetic fields can influence adult stem cells: positive and negative impacts. Stem Cell Res Ther 2016;7:54. [DOI] [PMC free article] [PubMed] [Google Scholar]
- 45. Blau HM, Cosgrove BD, Ho AT. The central role of muscle stem cells in regenerative failure with aging. Nat Med 2015;21:854–862. [DOI] [PMC free article] [PubMed] [Google Scholar]
Associated Data
This section collects any data citations, data availability statements, or supplementary materials included in this article.
Supplementary Materials
Additional supporting information may be found online in the Supporting Information section at the end of the article.
Supporting Information 1