

Abstract
The pressing need for improved therapeutic outcomes provides a good rationale for identifying effective strategies for alimentary tract (AT) cancer treatment. The potential re‐sensitivity property to chemo‐ and immunotherapy of low‐dose decitabine has been evident both preclinically and in previous phase I trials. We conducted a phase Ib/II trial evaluating low‐dose decitabine‐primed chemoimmunotherapy in patients with drug‐resistant relapsed/refractory (R/R) esophageal, gastric or colorectal cancers. Forty‐five patients received either the 5‐day decitabine treatment with subsequent readministration of the previously resistant chemotherapy (decitabine‐primed chemotherapy, D‐C cohort) or the aforementioned regimen followed by cytokine‐induced killer cells therapy (D‐C and cytokine‐induced killer [CIK] cell treatment, D‐C + CIK cohort) based on their treatment history. Grade 3 to 4 adverse events (AEs) were reported in 11 (24.4%) of 45 patients. All AEs were controllable, and no patient experienced a treatment‐related death. The objective response rate (ORR) and disease control rate (DCR) were 24.44% and 82.22%, respectively, including two patients who achieved durable complete responses. Clinical response could be associated with treatment‐free interval and initial surgical resection history. ORR and DCR reached 28% and 92%, respectively, in the D‐C + CIK cohort. Consistently, the progression‐free survival (PFS) of the D‐C + CIK cohort compared favorably to the best PFS of the pre‐resistant unprimed therapy (p = 0.0001). The toxicity and ORRs exhibited were non‐significantly different between cancer types and treatment cohort. The safety and efficacy of decitabine‐primed re‐sensitization to chemoimmunotherapy is attractive and promising. These data warrant further large‐scale evaluation of drug‐resistant R/R AT cancer patients with advanced stage disease.
Keywords: alimentary tract cancer, relapsed/refractory, hypomethylation agent, drug resistance, chemoimmunotherapy
Short abstract
What's new?
Chemotherapy is the main therapeutic option for alimentary tract (AT) cancer patients, but intrinsic or acquired drug resistance remains an issue. Preclinical and phase I trials have shown the potential re‐sensitivity property to chemo‐ and immunotherapy of low‐dose decitabine. In this phase Ib/II trial, low‐dose decitabine‐primed chemotherapy with/without cytokine‐induced killer cells treatment was assessed in patients with drug‐resistant relapsed/refractory AT cancers. The epi‐ chemoimmunotherapy exhibited high response rates and prolonged the progression‐free survival (PFS), compared to the pre‐resistant unprimed PFS. The regimen was generally well tolerated. The safety and efficacy of decitabine‐primed re‐sensitization to chemoimmunotherapy make it a promising treatment strategy.
Abbreviations
- AEs
adverse events
- AT
alimentary tract
- BOR
best overall response
- 95% CI
95% confidence interval
- CIK
cytokine‐induced killer
- CR
complete response
- CRC
colorectal cancer
- CT
computed tomography
- CTCAE
the U.S. National Cancer Institute Common Toxicity Criteria for Adverse Events
- DCR
disease control rate
- EC
esophageal cancer
- ECOG
Eastern Cooperative Oncologic Group
- GC
gastric cancer
- HMA
hypomethylating agents
- ORR
objective response rate
- OS
overall survival
- PD
progressive disease
- PFS
progression‐free survival
- PR
partial response
- RECIST
the Response Evaluation Criteria in Solid Tumors
- SD
stable disease.
Introduction
Alimentary tract (AT) cancer is one of the leading public health problems worldwide,1 particularly in Asia, where its increasing incidence and mortality has led to a major public health burden.2, 3 Various organ cancers are categorized under AT malignancies, but the three most common are esophageal cancer (EC), gastric cancer (GC) and colorectal cancer (CRC), which also account for three of the top five most frequently diagnosed and lethal cancers in China.3 Chemotherapy is the main therapeutic option for AT cancer patients, but the prognosis has not improved significantly in recent years due to intrinsic or acquired drug resistance.4, 5, 6, 7
Various mechanisms are involved in the inevitable development of drug resistance and tumor progression.4, 8 However, it is becoming increasingly clear that the impact of epigenetics on both the tumor cell and the tumor microenvironment plays a critical role in the development of drug resistance.9, 10, 11 Consistent with this hypothesis, previous laboratory and clinical data suggest that an epigenetic strategy may overcome chemotherapy resistance and mediate a return to a baseline state of treatment susceptibility in various cancers.11, 12, 13, 14, 15 Epigenetic perturbations, particularly hypomethylating agents (HMA), re‐sensitize cancer cells to chemotherapy presumably by resetting the epigenetic infrastructure and altering gene expression in the tumor.16, 17, 18 Decitabine (5‐aza‐2′‐deoxycytidine) is the only HMA approved by the China Food and Drug Administration. The concentration required to reverse tumor‐specific DNA methylation is much lower than that needed to produce maximal cytotoxicity.18, 19, 20 The apparent reversibility of resistance by epigenetic interference has the potential to turn the arrow of time backwards, replacing progression with regression, and thus provides a good rational for the use of low‐dose decitabine as an antidote to the resistance to current standard chemotherapies and as a blueprint to significantly extend patient survival.11, 16, 17
Furthermore, accumulative evidence has indicated that epigenetic‐based combination therapies are the wave of the future.21 The presence of tumor‐infiltrating T cells correlates with a favorable clinical outcome for cancer,22, 23 and adoptive immunotherapy, such as cytokine‐induced killer (CIK) cells, has shown objective clinical responses in many solid tumors.24, 25 Furthermore, improved clinical activity was observed in cancer patients treated with a combination of epigenetic therapy and adoptive immunotherapy,12, 26 and HMA may play an immune stimulatory role in cancer therapy by sensitizing patients to immune responses.21, 27 Based on the hypomethylating and immune remodeling effects of decitabine,17, 27 we hypothesized that the use of decitabine to prime the cancers to restore sensitivity to cytotoxic drugs and immunotherapy may be a valuable alternative avenue for the clinical efficacy of drug‐resistant relapsed/refractory (R/R) AT cancers.
Because the safety and efficacy of low‐dose decitabine as either monotherapy or as a drug combination with current standard therapies in patients with various solid tumors has already been shown,12, 28 our phase Ib/II study (http://ClinicalTrials.gov identifier: NCT01799083) was designed to develop a new regimen based on the epigenetic reversion of drug resistance and immunotherapy. In our study, we report the safety, tolerability and efficacy of a combined therapy of low‐dose decitabine plus the re‐administration of previously ineffective, corresponding first‐line chemotherapy and CIK cell treatment to patients, diagnosed within 6 months of their original first‐line therapy, with advanced stage, documented relapsed or refractory AT cancers.
Patients and Methods
Patients
Eligible patients were characterized by the following criteria: relapsed or refractory EC, GC and CRC; histologically confirmed stage III to IV disease; documented drug resistant to chemotherapy/CIK cell treatment (defined as relapsed [disease recurring within 6 months after original therapy] or refractory [disease progression while receiving or persistent disease after original therapy]); aged 18 to 85 years; Eastern Cooperative Oncologic Group (ECOG) performance status of 0 to 229 and adequate bone marrow, cardiac, renal and liver functions.
Key exclusion criteria were pregnancy or lactation; the receipt of any other investigational agent or decitabine; severe organ function insufficiency; active serious infection; a known history of HIV infection; a history of organ allograft; immunodeficiency or an uncontrolled comorbid medical condition.
Study design
This single‐center, open‐label phase Ib/II trial was conducted in accordance with the ethical guidelines of the 1975 Declaration of Helsinki and with Good Clinical Practice guidelines provided by the International Conference on Harmonization. The study was approved by the institutional review board of the Chinese PLA General Hospital (review broad identifier, 2012–062). Written informed consent to participate and publish was obtained from each enrolled patient.
Eligible patients were assigned to one of the two treatment cohorts according to the treatment history (whether CIK cell treatment was used before enrollment). For patients in the decitabine‐primed chemotherapy cohort (D‐C cohort), decitabine was administered to all patients at 7 mg/m2/d intravenously (IV) on days 1 to 5 of each 28‐day treatment cycle. The corresponding resistant first‐line chemotherapy was subsequently given on days 6 and 7. For the D‐C and CIK cell treatment cohort (D‐C + CIK cell cohort), patients received the abovementioned regimen, followed by CIK cells administration on days 14 and 15 in a 28‐day cycle. Treatment duration was up to 16 months or until progressive disease (PD) or unacceptable adverse events (AEs) occurred or upon patient request to discontinue therapy.
Safety evaluation
Safety assessment included a physical examination, vital signs, height, weight, ECOG performance status, AEs and laboratory analysis. All evaluations were performed after each treatment cycle. AEs were graded according to the U.S. National Cancer Institute Common Toxicity Criteria for AEs (CTCAE), version 4.0.
Efficacy and outcomes assessment
The primary objective was progression‐free survival (PFS). Secondary end points included overall survival (OS), objective response rate (ORR) and disease control rate (DCR). All patients underwent the computed tomography (CT) scanning to confirm the treatment response after every two cycles of therapy, and the same imaging modality was used at baseline and at all follow‐ups. Tumor responses were assessed in a blinded manner according to the Response Evaluation Criteria in Solid Tumors (RECIST) v1.1.
CIK cell culture and treatment regimen
The CIK cells were generated from peripheral blood mononuclear cells (PBMCs) and cultured as previously described.30 CIK cells were isolated by standard Ficoll separation and then cultured with CIK cell medium (Takara, Japan) supplemented with 0.6% autogeneic serum. The growth medium was supplemented with 1000 U/ml recombinant human interferon (IFN)‐γ, 1000 U/ml recombinant human interleukin (IL)‐2 (rhIL‐2) and 5 μg/ml anti‐CD3 antibody on day 0. Every 3 days, fresh CIK cell medium and 1000 U/ml rhIL‐2 were added. After 14‐days of culture, CIK cells were harvested with a survival rate of > 95%. The phenotype of the CIK cells met the following release criteria: proportions of CD3+, CD8+ and CD3+/CD56+ cells of > 90%, > 65% and ≥ 20%, respectively. The phenotype of the PBMCs was analyzed as a control.
The CIK cell transfusion was performed intravenously with 1.0–5.0 × 10⁹ CIK cells per infusion (one transfusion per day for 2 days). After each CIK cell transfusion, the patients were injected subcutaneously with 2 mU rhIL‐2 each day for 7 consecutive days.
Plasma DNA LINE‐1 methylation analysis
Peripheral blood was collected from all 45 enrolled patients on days 0 and 28 of cycle 1. The DNA was extracted from plasma samples and quantified as described previously.31 Global methylation was detected using the Global DNA Methylation LINE‐1 kit (Active Motif) according to the manufacturer's instructions.28
Plasma microRNA analysis
The aforementioned plasma samples were also used for microRNA (miRNA) expression analysis. MiRNA sequencing (miRNA‐seq) was performed with the plasma sample of three patients (UPN 36, 46 and 51). MiRNA‐Seq library construction, sequencing, read alignment (to mirBase v21) and miRNA expression profiling were performed as reported previously in the Cancer Genome Atlas Research Network.32 Differentially expressed miRNAs were filtered by fold change, and hierarchical clustering was performed. MiRNA target prediction was performed by Targetscan and other common methods. The gene ontology (GO) and Kyoto Encyclopedia of Genes and Genomes (KEGG) pathway analyses were performed based on the top 10 differentially expressed miRNAs. The quantification of miRNAs of the plasma samples of the other 42 patients using real‐time polymerase chain reaction was then conducted separately as described previously.33 The primers used are shown in Supporting Information Table S1.
Statistical analysis
All patients who received at least two cycles of treatment were included in the analyses. Patient demographics and the frequency of AEs were summarized by histological subtype using descriptive statistics. PFS was measured from study entry to the first documentation of disease progression or death. OS was measured from the study entry to the date of death. ORR was defined as the proportion of all treated patients whose best overall response (BOR) was either a confirmed complete or partial response (CR or PR). DCR was defined as the proportion of ORR plus patients with stable disease (SD). Efficacy endpoints were compared across the histological groups using the Fisher's exact test, with two‐sided 95% exact CIs calculated using the Wald confidence limits method. PFS and OS were estimated according to the Kaplan‐Meier method, and comparisons were conducted using the log‐rank test. Cox proportional hazards regression analysis was used for univariate and multivariate analyses of prognostic factors. The two‐sided 95% CI was provided for PFS, OS, ORR and DCR. All statistical assessments were two‐sided, and the significance level was defined as ≤ 0.05. The statistical software SPSS 23 and Stata 14 was used for analysis.
Results
Patient characteristics
Forty‐eight patients with relapsed (n = 21)/refractory (n = 27), drug resistant EC (n = 16), GC (n = 17) and CRC (n = 15) were enrolled from August 2012 to May 2017. Forty‐five patients received at least two cycles of the D‐C + CIK cell (low‐dose D‐C combined with CIK cell) or D‐C (low‐dose D‐C) treatment based on their treatment history (Supporting Information Fig. S1). The median patient age was 59 years (range, 25–85 years). At baseline, 38 (84.4%) patients had stage IV disease; 37 (82.2%) patients had an ECOG performance status of 0–1 and 33 (73.3%) patients were previously treated with surgery. Baseline patient demographic and clinical characteristics are listed in Table 1 and Supporting Information Table S2, and an additional table shows this in greater detail (Supporting Information Table S3). The median number of combined treatment cycles was four (range, 2–16 cycles).
Table 1.
Demographic and baseline characteristics of patients, by treatment regimen
| No. of patients (%) | ||||
|---|---|---|---|---|
| Characteristic | All patients (n = 45) | D‐C + CIK cella (n = 25) | D‐Ca (n = 20) | P Value |
| Age (years) | ||||
| Median | 59 | 62 | 55 | 0.469 |
| Range | 25–85 | 25–85 | 38–73 | |
| Gender | ||||
| Male | 32 (71.1) | 18 (72) | 14 (70) | 0.883 |
| Female | 13 (28.9) | 7 (28) | 6 (30) | |
| ECOG2 | ||||
| 0 | 24 (53.3) | 12 (48) | 12 (60) | 0.521 |
| 1 | 13 (28.9) | 7 (28) | 6 (30) | |
| 2 | 8 (17.8) | 6 (24) | 2 (10) | |
| Tumor grade | ||||
| III | 7 (15.6) | 4 (16) | 3 (15) | 1.000 |
| IV | 38 (84.4) | 21 (84) | 17 (85) | |
| Histology | ||||
| Squamous cell carcinoma | 12 (26.7) | 6 (2.5) | 6 (30) | 0.126 |
| Adenocarcinoma | 28 (62.2) | 14 (4) | 14 (70) | |
| Other | 5 (11.1) | 5 (20) | 0 (0) | |
| No. of metastasis | ||||
| ≥3 | 35 (77.8) | 20 (80) | 15 (75) | 0.866 |
| 2 | 7 (15.6) | 3 (12) | 4 (20) | |
| 1 | 3 (6.6) | 2 (8) | 1 (5) | |
| Previous status | ||||
| Refractory | 25 (55.6) | 15 (60) | 10 (40) | 0.502 |
| Relapsed | 20 (44.4) | 10 (40) | 10 (40) | |
| Treatment free interval, months | ||||
| Median | 1 | 1 | 3 | 0.253 |
| Range | 1–61 | 1–16 | 1–61 | |
| Prior surgery | 33 (73.3) | 18 (72) | 15 (75) | 0.821 |
| Prior system therapy | 42 (93.3) | 23 (92) | 19 (76) | 1.000 |
| Cycles of previous treatment | ||||
| Median | 4 | 4 | 4.5 | 0.143 |
| Range | 2–15 | 2–15 | 2–12 | |
| Cycles of decitabine‐primed treatment | ||||
| Median | 4 | 4 | 4 | 0.341 |
| Range | 2–16 | 2–16 | 2–7 | |
| Chemotherapy regimen3 | ||||
| PT | 14 | 8 | 6 | 0.379 |
| IP | 5 | 4 | 1 | |
| FOLFOX | 16 | 9 | 7 | |
| FOLFIRI | 10 | 4 | 6 | |
D‐C + CIK cell, decitabine‐primed combination of chemotherapy and CIK cell treatment; D‐C, decitabine‐primed chemotherapy. 2ECOG performance‐status scores range from 0 to 5, with 0 indicating no symptoms and higher scores indicating increasing symptoms. 3Chemotherapy regimen: PT, paclitaxel and cisplatin; IP, irinotecan and cisplatin; FOLFOX, oxaliplatin, leucovorin and fluorouracil; FOLFIRI, irinotecan, leucovorin and fluorouracil.
Safety
None of the 45 patients withdrew from the treatment because of AEs or experienced treatment‐related death. In the overall population, the most frequently observed treatment‐related AEs were fatigue (n = 45, 100%), anorexia (n = 24, 53.3%), anemia (n = 24, 53.3%) and leukopenia (n = 23, 51.1%) (Table 2). Grade 3–4 treatment AEs occurred in 11 of 45 patients (24.4%) and included leukopenia (n = 10, 22.2%), neutropenia (n = 10, 22.2%), thrombocytopenia (n = 3, 6.7%), anemia (n = 1, 2.2%), nausea (n = 1, 2.2%) and diarrhea (n = 1, 2.2%). These AEs were easily medically managed if the chemotherapy doses were reduced by 20% of the therapeutic doses of the standard chemotherapy regimens. Several expected chemotherapy‐related AEs, such as fatigue (n = 45, 100%), alopecia (n = 23, 51.1%) and anorexia (n = 37, 82.2%), occurred in our study.
Table 2.
Treatment‐Related AEs according to CTCAE (version 4.0) criteria
| All Grades | Grade 3 to 4 | |||
|---|---|---|---|---|
| Adverse events | N | % | N | % |
| Hematologic | ||||
| Leukopenia | 23 | 51.1 | 10 | 22.2 |
| Neutropenia | 23 | 51.1 | 10 | 22.2 |
| Anemia | 24 | 53.3 | 1 | 2.2 |
| Thrombocytopenia | 6 | 13.3 | 3 | 6.7 |
| Gastrointestinal | ||||
| Nausea/vomiting | 9 | 20 | 1 | 2.2 |
| Anorexia | 37 | 82.2 | 0 | 0 |
| Diarrhea | 3 | 6.7 | 1 | 2.2 |
| Stomatitis | 3 | 6.7 | 0 | 0 |
| Constipation | 7 | 15.6 | 0 | 0 |
| Loss of appetite | 1 | 2.2 | 0 | 0 |
| Other | ||||
| Fatigue | 45 | 100 | 0 | 0 |
| Alopecia | 23 | 51.1 | 0 | 0 |
| Hidrosis | 1 | 2.2 | 0 | 0 |
| Blurred vision | 2 | 4.4 | 0 | 0 |
| Sensory neuropathy | 23 | 51.1 | 0 | 0 |
The most common AEs were hematologic and gastrointestinal in origin (Table 2). EC and GC groups experienced higher rates of any‐grade and grades 3 and 4 hematologic toxicities than the CRC group (p = 0.003). Leukopenia and thrombocytopenia were caused by the combined treatment rather than by the low‐dose decitabine monotherapy (Supporting Information Fig. S2). The frequency and severity of treatment‐related gastrointestinal AEs were not different among the three histological groups.
Efficacy
The treatment cycles did not differ significantly among the two combined epigenetic regimen cohorts (one‐way analysis of variance test, p = 0.341) (Table 1). In the overall population, 2 (4.44%) patients achieved CR, 9 (20%) had PR and 26 (57.78%) experienced SD. The ORR and DCR were 24.44% (95% CI, 11.89 to 37.00) and 82.22% (95% CI, 71.05 to 93.39), respectively (Table 3; Fig. 1 a). PD was infrequent, with 8 (17.78%) patients having PD as their BOR per RECIST v1.1. Of the 25 patients in the D‐C + CIK cell cohort, 1 (4%) had CR, 6 (24%) had PR and 16 (64%) had SD, for an ORR of 28% (95% CI, 12.07 to 49.39) and DCR of 92% (95% CI, 73.97 to 99.02). Of the 20 patients with the D‐C regimen, 1 (5%) had CR, 3 (15%) had PR and 10 (50%) had SD, for an ORR of 20% (95% CI, 5.73 to 43.66) and DCR of 70% (95% CI, 45.72 to 88.11) (Table 3). No evident differences for ORR and DCR were exhibited between the two cohorts, respectively (Kruskal‐Wallis test, p = 0.729 for ORR and p = 0.113 for DCR).
Table 3.
Clinical response and patient outcomes, by treatment regimen
| Response | All patients (n = 45) | D‐C + CIK cell (n = 25) | D‐C (n = 20) |
|---|---|---|---|
| BOR, No. (%) | |||
| CR | 2 (4.44) | 1 (4) | 1 (5) |
| PR | 9 (20) | 6 (24) | 3 (15) |
| SD | 26 (57.78) | 16 (64) | 10 (50) |
| PD | 8 (17.78) | 2 (8) | 6 (30) |
| ORR (%) | 24.44 | 28 | 20 |
| 95% CI | 12.88–39.54 | 12.07–49.39 | 5.73–43.66 |
| DCR (%) | 82.22 | 92 | 70 |
| 95% CI | 67.95–92.00 | 73.97–99.02 | 45.72–88.11 |
| PFS (months) | |||
| Median (range) | 5 (2–47) | 6 (2–47) | 4 (2–19) |
| 95% CI | 4–6 | 4–8 | 2–9 |
| OS (months) | |||
| Median (range) | 12 (2–47) | 11 (2–47) | 12 (2–34) |
| 95% CI | 9–13 | 9–14 | 7–22 |
| PFS rate at 6 monthsa (%) | 34.38 | 37.89 | 30 |
| 95% CI | 20.89–48.28 | 19.28–56.44 | 12.25–50.14 |
| 1‐year OS rate2 (%) | 37.78 | 32 | 45 |
| 95% CI | 23.91–51.57 | 15.24–50.15 | 23.11–64.71 |
PFS rate was defined as the probability of a patient remaining progression free and alive up to 6 months. 2OS rate was defined as the probability of a patient remaining alive up to 1 year.
Figure 1.
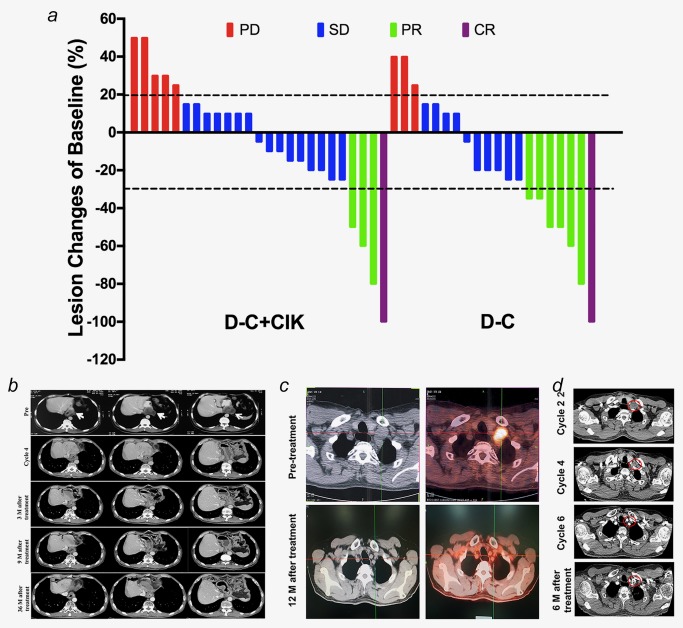
Clinical efficacy analysis. (a) Waterfall plot of BOR. Best percentage change in target lesion tumor burden from baseline. Maximum percentage reduction in target lesion tumor burden is assessed according to RECIST v1.1. Positive change in tumor burden indicates tumor growth; negative change in tumor burden indicates tumor reduction. Horizontal lines denote 30% decrease and 20% increase, and each column represents one case. (b) Serial CT scans show a CR for an anastomotic recurrence lesion after four cycles of D‐C + CIK cell regimen. The patient remains alive and is without evidence of relapse until 41 months after completion of six cycles of this therapy (May 2017). The white arrows indicate areas of measurable disease. (c, d) The PET/CT (c) and CT (d) images of UPN55, a 59‐year‐old male patient with relapsed ESCC. He received D‐C treatment, experienced gradual reduction of tumor lesions and achieved a CR that last 18 months. Red circles indicate areas of measurable disease. Abbreviations: CR, complete response; PD, progressive disease; PR, partial response; SD, stable disease. [Color figure can be viewed at http://wileyonlinelibrary.com]
Eleven (24.44%) patients achieved the objective clinical response per RECIST v1.1, with 6 (6 of 15, 40%) with EC, 4 (4 of 16, 25%) with GC and 1 (1 of 14, 7.1%) with CRC (Supporting Information Table S4). The DCR of the separate cancer types were 86.67%, 87.50% and 71.43%, respectively (Supporting Information Table S4). No evident differences of ORR or DCR were exhibited across the three different cancer types, respectively (Kruskal‐Wallis test, p = 0.118 for ORR and p = 0.551 for DCR). Furthermore, no significant heterogeneities of ORR or DCR were noted across the four different chemotherapy regimens (Kruskal‐Wallis test, p = 0.405 for ORR and p = 0.204 for DCR) (Supporting Information Table S5).
The correlation analysis revealed that the better ORR was associated with the longer treatment‐free interval (p = 0.025) and initial surgical resection history (p = 0.023), respectively (Supporting Information Table S6). Notably, the D‐C + CIK cell regimen showed advantages in clinical responses over D‐C treatment in AT patients with fewer cycles of decitabine‐primed therapy (≤ 4; 94.4% vs. 50%, p = 0.009) or more metastasis (≥ 3; 95% vs. 60%, p = 0.027) or adenocarcinoma (100% vs. 57.14%, p = 0.016). Furthermore, D‐C + CIK cell treatment provided better ORR in patients with squamous cell carcinoma (p = 0.011), while the increased cycles (>4) of the D‐C therapy may be associated with the improved therapeutic effects (p = 0.014).
Patient UPN11 experienced a CR lasting 47 months. The patient was initially diagnosed with poorly differentiated esophageal squamous cell carcinoma (ESCC) and received surgical resection and first‐line chemotherapies. He experienced a gradual reduction in tumor lesions and achieved a CR after 4 cycles of low‐dose decitabine‐primed chemo‐CIK cell regimen (D‐C + CIK cell cohort). The patient had no evidence of disease progression for 41 months after discontinuing combination epigenetic therapy (Fig. 1 b). Another representative CR patients, UPN55, experienced no sign of disease after the initial resection for approximately 60 months, followed by relapse with ESCC, which was consistent with his original primary tumor. This patient completed a six‐cycle trial of low‐dose D‐C (D‐C cohort) and continued to experience a CR after 12 months of follow‐up (Figs. 1 c and 1 d).
Survival
For all the 45 patients who completed at least two cycles of epigenetic primed chemoimmunotherapy, the median PFS and OS were 5 (95% CI, 4–6 months) and 12 months (95% CI, 9–13 months), comparing favorably with the best PFS before resistance to the corresponding chemoimmunotherapy regimens (p = 0.002) (Table 3; Figs. 2 a and 2 b). The 6‐month PFS and 1‐year OS rates of the D‐C + CIK cell cohort were 37.89% and 32%, respectively (Table 3). For patients with D‐C treatment, the 6‐month PFS and 1‐year OS rates were 30% and 45%, respectively (Table 3). Neither the PFS (p = 0.889) nor OS (p = 0.914) of the three cancer types differed significantly in the Kaplan‐Meier analysis (Supporting Information Figs. S3a and S3b). Across the three groups of cancer type, the 6‐month PFS and 1‐year OS rates ranged from 26.7% to 43.75% and 31.25% to 42.86%, respectively (Supporting Information Table S4). No significant difference of survival rates could be discerned among the four chemotherapy groups (Supporting Information Table S5; Figs. S3c and S3d).
Figure 2.
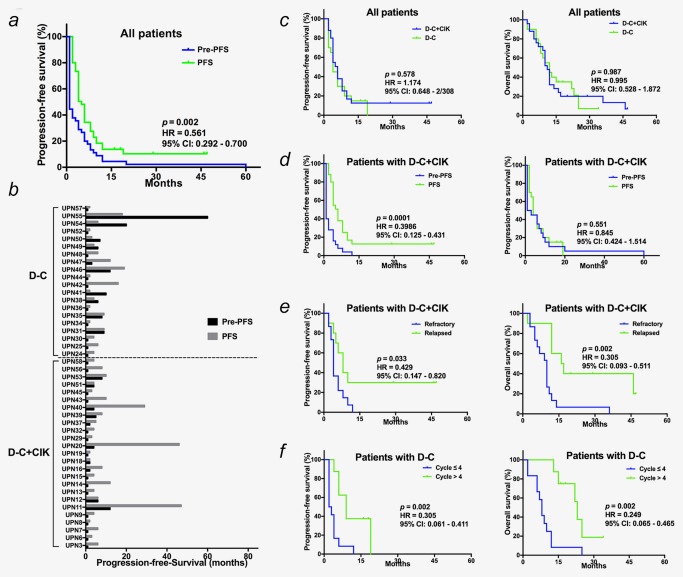
Comparison of survival outcomes. (a, b) The Kaplan‐Meier analysis (a) and paired comparison (b) of PFS of low‐dose decitabine‐primed chemoimmunotherapy, comparing favorably to the best previous PFS of the corresponding therapy. (c) Compared to pre‐resistant PFS of unprimed chemoimmunotherapy, PFS was prolonged by D‐C+CIK cell regimen but not the D‐C regimen. (d) Kaplan‐Meier analysis and log‐rank comparison of PFS and OS by the treatment cohort. (e) For patients in D‐C+CIK cell cohort, the PFS of patients with relapsed cancers was significantly longer than with refractory patiens. (f) The D‐C regimen prolonged the PFS of patients received more cycles of treatment. Abbreviations: Pre‐PFS, pre‐resistant PFS of the corresponding chemoimmunotherapy; PFS, PFS of low‐dose decitabine‐primed chemoimmunotherapy. [Color figure can be viewed at http://wileyonlinelibrary.com]
Although no significant disparity of PFS was noted between the two treatment cohorts (Kaplan‐Meier analysis, p = 0.889) (Fig. 2 c), the PFS benefit from the decitabine‐primed chemoimmunotherapy was only exhibited in the patients with the D‐C + CIK cell treatment (p = 0.0001; HR = 0.399; 95% CI, 0.125 to 0.431), but not in the patients with the D‐C treatment (p = 0.551; HR = 0.845; 95% CI, 0.424 to 1.514) (Fig. 2 d). For the patients with the D‐C + CIK cell treatment, the interesting pairwise comparisons exhibited a prominent longer PFS and OS in the relapsed patients compared to the refractory patients (PFS: p = 0.033; HR = 0.429; 95% CI, 0.147 to 0.820; OS: p = 0.002; HR = 0.305; 95% CI, 0.093 to 0.511) (Fig. 2 e). Additionally, in the patients with the D‐C treatment, the increased treatment cycles significantly extended the PFS and OS (PFS: p = 0.002; HR = 0.305; 95% CI, 0.061 to 0.411; OS: p = 0.002; HR = 0.249; 95% CI, 0.065 to 0.465) (Fig. 2 f). Furthermore, Cox proportional hazards regression analysis confirmed these two indices, the patients with relapsed AT cancers and incremental cycles, could independently predict the survival (Supporting Information Tables S7 and S8; Supporting Information Fig. S4), suggesting that patients with relapsed AT cancers would be more suitable for the low‐dose primed chemoimmunotherapy and that at least four cycles of the regimen should be recommended.
Potential prognostic role analysis
Because the eligible patients of this phase Ib/II trial had relapsed or had refractory disease, the biopsy tumor tissue was not readily available based on the clinical safety considerations. Considering that plasma DNA is enriched with tumor DNA, we assessed the hypomethylating activity of low‐dose decitabine via measurement of LINE‐1 methylation in plasma DNA.31 As shown in Figure 3 a, the global DNA hypomethylation was confirmed in all patients on day 28 compared to day 0 of the first cycle. There was no significant difference among the diverse responders, indicating that global hypomethylation may not be a putative predictive marker for the combination therapy.
Figure 3.
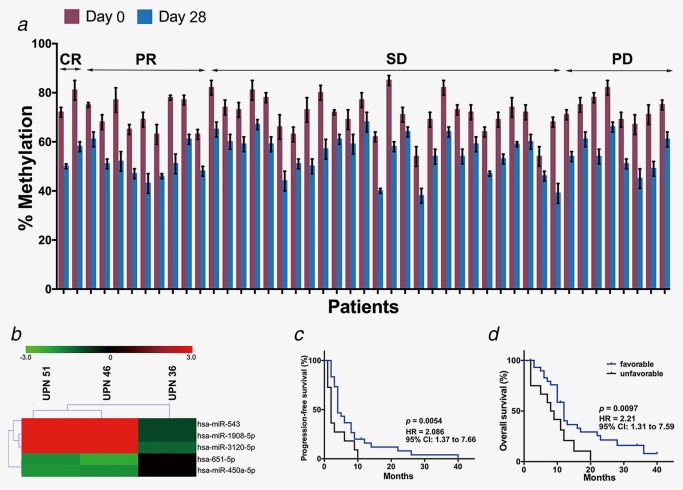
Plasma samples were used to identify preliminary predictive markers of response. (a) LINE‐1 methylation measurements in patient plasma samples at days 0 and 28 of cycle 1. Error bars represent SEM. (b) Hierarchical cluster analysis of miRNA‐seq data by the five differentially expressed miRNAs. (c, d) Kaplan‐Meier comparison of PFS and OS between the groups of patients with favorable and unfavorable miRNA expression signature. Favorable miRNA expression signature represented the upregulation of miR‐543, 1908‐5p and 3120‐5p and downregulation of miR‐651‐5p and 450a‐5p after low‐dose decitabine‐primed combined therapy treatment. [Color figure can be viewed at http://wileyonlinelibrary.com]
Emerging data show that miRNAs play important roles as prognostic factors for cancer survival.34, 35 Furthermore, plasma RNA was available and provided a valuable source for biomarker development. We performed high‐throughput miRNA‐seq on a training set of two PR patients and one PD patients (GEO database, GSE91089), and preliminary data revealed that five miRNAs (upregulated in PR patients: miR‐543, 1908‐5p and 3120‐5p; downregulated in PR patients: miR‐651‐5p and 450a‐5p) may serve as putative predictive markers of this low‐dose decitabine primed therapy (Fig. 3 b). Furthermore, the expression patterns of the five miRNAs were examined in the test set of the other 42 patients’ plasma samples collected on days 0 and 28 of cycle 1. Of the 30 patients with a favorable miRNA expression signature (upregulation of miR‐543, 1908‐5p and 3120‐5p and downregulation of miR‐651‐5p and 450a‐5p after treatment) (Supporting Information Fig. S5), two patients experienced PD, and the ORR was 26.7%. Of those with an unfavorable miRNA expression signature (n = 12), five patients experienced PD, and the ORR was 8.3% (Figs. 3 c and 3 d; Supporting Information Fig. S5).
Discussion
Drug resistance is one of the main factors limiting treatment advances in relapsed and/or refractory AT malignancies.7, 36 The pressing need for improved therapeutic outcomes provides a good rationale for finding effective strategies for AT cancer treatment.37 To our knowledge, our open‐label study is the first phase Ib/II trial to test the safety and efficacy of low‐dose decitabine‐primed chemoimmunotherapy in relapsed and/or refractory AT cancers with drug‐resistance. This clinical trial showed a favorable PFS and clinical response without a significant increase in toxicity. Our previous clinical trials of low‐dose decitabine in other tumors exhibited the similar findings.12, 28
There is a long‐held doctrine that the re‐use of previously resistant therapies is a clinically pointless endeavor.4, 15, 16 Here, we present data of a self‐controlled clinical trial, the historical PFS of each patient served as a control for themselves. A paired comparison of PFS between the primed corresponding chemotherapies (D‐C cohort) and unprimed previous therapies was performed and showed a similar median PFS time. Our data suggested the capability of low‐dose decitabine to alter cancer cell sensitivity to cytotoxic therapy and mediate a return to a baseline state of treatment susceptibility.13 Interestingly, the inclusion of CIK cell to the combined therapy prominently prolonged the PFS compared to the best PFS of the unprimed previous therapy. Our results support that the low‐dose decitabine primes the cancers to restore sensitivity to chemo‐ and immunotherapy and indicate the synergetic effect of chemotherapy and immunotherapy in R/R AT cancers.
A number of studies have indicated the safety and feasibility of the use of CIK cells either combined with chemotherapy or alone in treating malignant diseases.38, 39, 40 Nevertheless, a standardized operation procedure is urgently needed to modify technical criteria for CIK cell preparation.41 Our group confirmed the antitumor effect of therapeutic regimens with CIK cells in several hematologic malignancies and solid tumors, and also developed the uniform criteria for preparations of CIK cells.42 In addition, we summarized the AEs in 893 patients with 4,088 transfusion cases and revealed the safety and well‐tolerance of autologous CIK cell transfusion.30 Furthermore, consistent with our data of D‐C + CIK cell cohort, clinical observations demonstrated that relapsed status may be an index of clinical efficacy of CIK cell‐based treatment.43 Considering the limited sample size and the use of autologous CIK cells, other potential predictive factor might exist and need to be validated in future large‐scale investigation.
Decitabine is a powerful HMA and is most effective at a lower dose. A low‐dose regimen of decitabine was suggested as the “optimal dose” for the treatment of hematological malignancies (3.5–7 mg/m2) and solid tumors (2.5–10 mg/m2).44, 45 Emerging evidences suggested that this agent did not only work against cancer cells, but also impacted the host immunity.17, 21, 27 Our previous phase I study in patients with advanced hepatocellular carcinoma exhibited the massive inflammatory cell infiltration of tumor bed after low‐dose decitabine treatment.28 The further study revealed that the low‐dose decitabine could broaden the peripheral T cell receptor repertoire, promote T cell proliferation and increase IFN‐γ+ secretion.46 Our present and previous data demonstrated that low‐dose decitabine may re‐sensitized the cancer to immunotherapy and the clinical efficacy could be predicted with peripheral IFN‐γ+ T‐cell frequency, which is required to be verified in further large‐scale clinical trials.
The low‐dose decitabine‐primed chemoimmunotherapy did not benefit all eligible R/R AT cancer patients. Thus, a predictive biomarker of antitumor response for this combined therapy is urgently needed. In our trial, all enrolled patients were R/R AT cancer patients, the evaluation with tumor tissue was not executable because biopsy was not an acceptable option for all patients considering the clinical safety. LINE‐1 methylation in plasma DNA was chose to serve as a potential biomarker of activity of dicitabine for two reasons. First, the plasma DNA may not be equivalent to the tumor DNA, but Ana Aparicio proposed that LINE‐1 methylation in plasma DNA could serve as a biomarker of activity of DNA methylation inhibitors in patients with solid tumors.31 Second, global DNA methylation decreases appear to be transient and rapidly return to baseline levels.47 Moreover, as proposed by Qin et al. the synergistic effect of decitabine and chemotherapy may be independent of DNA demethylation,48 and the degree of methylation in a plasma sample does not correlate with disease response. This phase Ib/II study could not identify a true biomarker for the antitumor effect, and additional investigations will be needed to address this issue.
Immunotherapy gained worldwide attention and was regarded as one of the most promising cancer treatments in recent years. Cancer immunotherapy exhibited specific patterns of response in some cases with transient increase in tumor burden followed by long‐lasting PR or SD, termed pseudo‐progression.49 Conventional response criteria, RECIST v1.1, evaluated clinical response by reduction in tumor burden without any new lesions and might not be adequate in assessing response of immunotherapy, because it might underestimate the therapeutic benefit.49, 50 Accordingly, immune‐related response criteria, namely irRECIST and iRECIST, were proposed to standardize response assessment of cancer immunotherapy.50 These new criteria have potentially demonstrated some advantages over RECIST v1.1; however, robust validation is needed.49 Regardless, RECIST remained a highly validated and reproducible tool in assessment of treatment response.49 After all, continuation of treatment might be performed beyond the conventional definition of “progression” by RECIST v1.1 and be confirmed per the irRECIST and iRECIST in the future clinical trial.
In summary, our study shows encouraging results related to clinical efficacy and toxicity profile of low‐dose decitabine‐primed chemoimmunotherapy in R/R AT cancer patients with documented drug‐resistance. Although the cohort of our study is relatively small, the results have clearly demonstrated that the specific treatment regimen is safe with a limited AE profile. This phase Ib/II study is pilot and difficult to draw a solid conclusion; nevertheless, it highlights the potential re‐sensitivity property to chemo‐ and immunotherapy of low‐dose decitabine. Although limited by relative small sample sizes, which can attenuate or negate the statistical significance of the finding, the impact of cancer type on clinical efficacy cannot be ruled out and additional investigations will be needed to address this issue. Thus, low‐dose decitabine‐primed chemoimmunotherapy may be an attractive and promising treatment strategy for R/R AT cancer patients with drug resistance. Further large‐scale, multicenter clinical trials of this primed regimen are warranted.
Supporting information
Supporting Information Figure S1
Supporting Information Figure S2
Supporting Information Figure S3
Supporting Information Figure S4
Supporting Information Figure S5
Supporting Information Figure Legends
Supporting Information Tables
Acknowledgements
The authors thank the patients who participated in the study, their families, and the study nurses for their support in executing the study.
Conflict of interest: The authors declare that they have no potential conflicts of interest.
Contributor Information
Qian Mei, Email: meiqnn@hotmail.com.
Weidong Han, Email: hanwdrsw69@yahoo.com.
References
- 1. Torre LA, Bray F, Siegel RL, et al. Global cancer statistics, 2012. CA Cancer J Clin 2015;65:87–108. [DOI] [PubMed] [Google Scholar]
- 2. Sharifian A, Pourhoseingholi MA, Baghestani A, et al. Burden of gastrointestinal cancers and problem of the incomplete information; how to make up the data? Gastroenterol Hepatol Bed Bench 2016;9:12‐7. [PMC free article] [PubMed] [Google Scholar]
- 3. Chen W, Zheng R, Baade PD, et al. Cancer statistics in China, 2015. CA Cancer J Clin 2016;66:115–32. [DOI] [PubMed] [Google Scholar]
- 4. Wu Q, Yang Z, Nie Y, et al. Multi‐drug resistance in cancer chemotherapeutics: mechanisms and lab approaches. Cancer letters 2014;347:159–66. [DOI] [PubMed] [Google Scholar]
- 5. Sim SC, Ingelman‐Sundberg M. Pharmacogenomic biomarkers: new tools in current and future drug therapy. Trends in pharmacological sciences 2011;32:72–81. [DOI] [PubMed] [Google Scholar]
- 6. Taniguchi H, Moriya C, Igarashi H, et al. Cancer stem cells in human gastrointestinal cancer. Cancer Sci 2016;107:1556–62. [DOI] [PMC free article] [PubMed] [Google Scholar]
- 7. Lin LL, Huang HC, Juan HF, et al. Deciphering molecular determinants of chemotherapy in gastrointestinal malignancy using systems biology approaches. Drug Discov Today 2014;19:1402‐9. [DOI] [PubMed] [Google Scholar]
- 8. Martinez‐Balibrea E, Martinez‐Cardus A, Gines A, et al. Tumor‐Related Molecular Mechanisms of Oxaliplatin Resistance. Mol Cancer Ther 2015;14:1767–76. [DOI] [PubMed] [Google Scholar]
- 9. Easwaran H, Tsai HC, Baylin SB. Cancer epigenetics: tumor heterogeneity, plasticity of stem‐like states, and drug resistance. Mol Cell 2014;54:716–27. [DOI] [PMC free article] [PubMed] [Google Scholar]
- 10. Brown R, Curry E, Magnani L, et al. Poised epigenetic states and acquired drug resistance in cancer. Nature reviews Cancer 2014;14:747–53. [DOI] [PubMed] [Google Scholar]
- 11. Baylin SB, Jones PA. A decade of exploring the cancer epigenome ‐ biological and translational implications. Nature reviews Cancer 2011;11:726–34. [DOI] [PMC free article] [PubMed] [Google Scholar]
- 12. Fan H, Lu X, Wang X, et al. Low‐dose decitabine‐based chemoimmunotherapy for patients with refractory advanced solid tumors: a phase I/II report. J Immunol Res 2014;2014:371087. [DOI] [PMC free article] [PubMed] [Google Scholar]
- 13. Liu L, Chen L, Wu X, et al. Low‐dose DNA‐demethylating agent enhances the chemosensitivity of cancer cells by targeting cancer stem cells via the upregulation of microRNA‐497. J Cancer Res Clin Oncol 2016;142:1431–9. [DOI] [PMC free article] [PubMed] [Google Scholar]
- 14. Sharma SV, Lee DY, Li B, et al. A chromatin‐mediated reversible drug‐tolerant state in cancer cell subpopulations. Cell 2010;141:69–80. [DOI] [PMC free article] [PubMed] [Google Scholar]
- 15. Juergens RA, Wrangle J, Vendetti FP, et al. Combination epigenetic therapy has efficacy in patients with refractory advanced non‐small cell lung cancer. Cancer discovery 2011;1:598–607. [DOI] [PMC free article] [PubMed] [Google Scholar]
- 16. Oronsky BT, Oronsky AL, Lybeck M, et al. Episensitization: Defying Time's Arrow. Front Oncol 2015;5:134. [DOI] [PMC free article] [PubMed] [Google Scholar]
- 17. Azad N, Zahnow CA, Rudin CM, et al. The future of epigenetic therapy in solid tumours–lessons from the past. Nature reviews Clinical oncology 2013;10:256–66. [DOI] [PMC free article] [PubMed] [Google Scholar]
- 18. Tsai HC, Li H, Van Neste L, et al. Transient low doses of DNA‐demethylating agents exert durable antitumor effects on hematological and epithelial tumor cells. Cancer cell 2012;21:430–46. [DOI] [PMC free article] [PubMed] [Google Scholar]
- 19. Chu BF, Karpenko MJ, Liu Z, et al. Phase I study of 5‐aza‐2'‐deoxycytidine in combination with valproic acid in non‐small‐cell lung cancer. Cancer Chemother Pharmacol 2013;71:115–21. [DOI] [PubMed] [Google Scholar]
- 20. Treppendahl MB, Kristensen LS, Gronbaek K. Predicting response to epigenetic therapy. The Journal of clinical investigation 2014;124:47–55. [DOI] [PMC free article] [PubMed] [Google Scholar]
- 21. Jones P. Peter Jones: Leaving a Mark on the Cancer Genome. Trends Cancer 2015;1:8–9. [DOI] [PubMed] [Google Scholar]
- 22. Schiffmann I, Greve G, Jung M, et al. Epigenetic therapy approaches in non‐small cell lung cancer: Update and perspectives. Epigenetics: official journal of the DNA Methylation Society 2016;11:858–70. [DOI] [PMC free article] [PubMed] [Google Scholar]
- 23. Zhang L, Conejo‐Garcia JR, Katsaros D, et al. Intratumoral T cells, recurrence, and survival in epithelial ovarian cancer. N Engl J Med 2003;348:203–13. [DOI] [PubMed] [Google Scholar]
- 24. Liu L, Zhang W, Qi X, et al. Randomized study of autologous cytokine‐induced killer cell immunotherapy in metastatic renal carcinoma. Clin Cancer Res 2012;18:1751–9. [DOI] [PubMed] [Google Scholar]
- 25. Lee JH, Lee JH, Lim YS, et al. Adjuvant immunotherapy with autologous cytokine‐induced killer cells for hepatocellular carcinoma. Gastroenterology 2015;148:1383–91 e6. [DOI] [PubMed] [Google Scholar]
- 26. Zhang Y, Mei Q, Liu Y, et al. The safety, efficacy, and treatment outcomes of a combination of low‐dose decitabine treatment in patients with recurrent ovarian cancer. Oncoimmunology 2017;6:e1323619. [DOI] [PMC free article] [PubMed] [Google Scholar]
- 27. Nie J, Liu L, Li X, et al. Decitabine, a new star in epigenetic therapy: the clinical application and biological mechanism in solid tumors. Cancer letters 2014;354:12–20. [DOI] [PubMed] [Google Scholar]
- 28. Mei Q, Chen M, Lu X, et al. An open‐label, single‐arm, phase I/II study of lower‐dose decitabine based therapy in patients with advanced hepatocellular carcinoma. Oncotarget 2015;6:16698–711. [DOI] [PMC free article] [PubMed] [Google Scholar]
- 29. Oken MM, Creech RH, Tormey DC, et al. Toxicity and response criteria of the Eastern Cooperative Oncology Group. Am J Clin Oncol 1982;5:649–55. [PubMed] [Google Scholar]
- 30. Zhang Y, Xia L, Zhang Y, et al. Analysis of adverse events following the treatment of autologous cytokine‐induced killer cells for adoptive immunotherapy in malignant tumour sufferers. Expert Opin Biol Ther 2015;15:481–93. [DOI] [PubMed] [Google Scholar]
- 31. Aparicio A, North B, Barske L, et al. LINE‐1 methylation in plasma DNA as a biomarker of activity of DNA methylation inhibitors in patients with solid tumors. Epigenetics: official journal of the DNA Methylation Society 2009;4:176–84. [DOI] [PMC free article] [PubMed] [Google Scholar]
- 32. Cancer Genome Atlas Research N, Linehan WM, Spellman PT, et al. Comprehensive Molecular Characterization of Papillary Renal‐Cell Carcinoma. N Engl J Med 2016;374:135–45. [DOI] [PMC free article] [PubMed] [Google Scholar]
- 33. Mei Q, Li X, Zhang K, et al. Genetic and methylation‐induced loss of miR‐181a2/181b2 within chr9q33.3 facilitate tumor growth of cervical cancer through PIK3R3/Akt/FoxO signaling pathway. Clin Cancer Res 2016;23:575–86. [DOI] [PubMed] [Google Scholar]
- 34. Croce CM. Causes and consequences of microRNA dysregulation in cancer. Nat Rev Genet 2009;10:704–14. [DOI] [PMC free article] [PubMed] [Google Scholar]
- 35. Mei Q, Li X, Guo M, et al. The miRNA network: micro‐regulator of cell signaling in cancer. Expert Rev Anticancer Ther 2014;14:1515–27. [DOI] [PubMed] [Google Scholar]
- 36. Brucher BL, Li Y, Schnabel P, et al. Genomics, microRNA, epigenetics, and proteomics for future diagnosis, treatment and monitoring response in upper GI cancers. Clin Transl Med 2016;5:13. [DOI] [PMC free article] [PubMed] [Google Scholar]
- 37. Baba Y, Ishimoto T, Kurashige J, et al. Epigenetic field cancerization in gastrointestinal cancers. Cancer letters 2016;375:360–6. [DOI] [PubMed] [Google Scholar]
- 38. Mu Y, Zhou CH, Chen SF, et al. Effectiveness and safety of chemotherapy combined with cytokine‐induced killer cell/dendritic cell‐cytokine‐induced killer cell therapy for treatment of gastric cancer in China: A systematic review and meta‐analysis. Cytotherapy 2016;18:1162–77. [DOI] [PubMed] [Google Scholar]
- 39. Niu J, Ren Y, Zhang T, et al. Retrospective comparative study of the effects of dendritic cell vaccine and cytokine‐induced killer cell immunotherapy with that of chemotherapy alone and in combination for colorectal cancer. Biomed Res Int 2014;2014:214727. [DOI] [PMC free article] [PubMed] [Google Scholar]
- 40. Cui J, Wang N, Zhao H, et al. Combination of radiofrequency ablation and sequential cellular immunotherapy improves progression‐free survival for patients with hepatocellular carcinoma. Int J Cancer 2014;134:342–51. [DOI] [PubMed] [Google Scholar]
- 41. Meng Y, Yu Z, Wu Y, et al. Cell‐based immunotherapy with cytokine‐induced killer (CIK) cells: From preparation and testing to clinical application. Hum Vaccin Immunother 2017;13:1–9. [DOI] [PMC free article] [PubMed] [Google Scholar]
- 42. Guo Y, Han W. Cytokine‐induced killer (CIK) cells: from basic research to clinical translation. Chin J Cancer 2015;34:99–107. [DOI] [PMC free article] [PubMed] [Google Scholar]
- 43. Jiang JT, Shen YP, Wu CP, et al. Increasing the frequency of CIK cells adoptive immunotherapy may decrease risk of death in gastric cancer patients. World J Gastroenterol 2010;16:6155–62. [DOI] [PMC free article] [PubMed] [Google Scholar]
- 44. Mahfouz RZ, Rickki E, Juersivich JA, et al. Non‐Cytotoxic Differentiation Therapy Based On Mechanism of Disease Produces Complete Remission in Myelodysplastic Syndromes (MDS) with High Risk Cytogenetics. ASH Annual Meeting Abstracts 2012;120: 1696. [Google Scholar]
- 45. Stewart DJ, Issa JP, Kurzrock R, et al. Decitabine effect on tumor global DNA methylation and other parameters in a phase I trial in refractory solid tumors and lymphomas. Clin Cancer Res 2009;15:3881–8. [DOI] [PubMed] [Google Scholar]
- 46. Li X, Zhang Y, Chen M, et al. Increased IFNgamma(+) T Cells Are Responsible for the Clinical Responses of Low‐Dose DNA‐Demethylating Agent Decitabine Antitumor Therapy. Clin Cancer Res 2017;23:6031–43. [DOI] [PubMed] [Google Scholar]
- 47. Yang AS, Yang BJ. The failure of epigenetic combination therapy for cancer and what it might be telling us about DNA methylation inhibitors. Epigenomics 2016;8:9–12. [DOI] [PubMed] [Google Scholar]
- 48. Qin T, Si J, Raynal NJ, et al. Epigenetic synergy between decitabine and platinum derivatives. Clin Epigenetics 2015;7:97. [DOI] [PMC free article] [PubMed] [Google Scholar]
- 49. Somarouthu B, Lee SI, Urban T, et al. Immune‐related tumour response assessment criteria: a comprehensive review. Br J Radiol 2018:20170457. [DOI] [PMC free article] [PubMed] [Google Scholar]
- 50. Le Lay J, Jarraya H, Lebellec L, et al. irRECIST and iRECIST: the devil is in the details. Annals of oncology: official journal of the European Society for Medical Oncology/ESMO 2017;28:1676–8. [DOI] [PubMed] [Google Scholar]
Associated Data
This section collects any data citations, data availability statements, or supplementary materials included in this article.
Supplementary Materials
Supporting Information Figure S1
Supporting Information Figure S2
Supporting Information Figure S3
Supporting Information Figure S4
Supporting Information Figure S5
Supporting Information Figure Legends
Supporting Information Tables