

Abstract
Regulatory guidelines require the sponsors to provide assurance of clonality of the production cell line, and when such evidence is not available, additional studies are typically required to further ensure consistent long‐term manufacturing of the product. One potential approach to provide such assurance of clonal derivation of a production cell line is to characterize subclones generated from the original cell line and assess their phenotypic and genotypic similarity with the hypothesis that cell lines derived from a clonal bank will share performance, productivity and product quality characteristics. In this study, a production cell line that was cloned by a validated FACS approach coupled with day 0 imaging for verification of single‐cell deposition was subcloned using validated FACS and imaging methods. A total of 46 subclones were analyzed for growth, productivity, product quality, copy number, and integration site analysis. Significant diversity in cell growth, protein productivity, product quality attributes, and copy number was observed between the subclones, despite stability of the parent clone over time. The diversity in protein productivity and quality of the subclones were reproduced across time and production scales, suggesting that the resulting population post sub‐cloning originating from a single cell is stable but with unique properties. Overall, this work demonstrates that the characteristics of isolated subclones are not predictive of a clonally derived parental clone. Consequently, the analysis of subclones may not be an effective approach to demonstrate clonal origin of a cell bank. © 2018 American Institute of Chemical Engineers Biotechnol. Prog., 34:613–623, 2018
Keywords: cell line development, single cell cloning, CHO, clonality
Introduction
In the past few decades, a large and diverse number of therapeutic proteins and antibodies have been successfully manufactured from recombinant protein expression in Chinese hamster ovary (CHO) cells. In totality, these therapies represent ∼25% of global prescription drug sales1 and have improved the quality of life for millions of patients worldwide. The success of producing biopharmaceuticals from CHO cells is primarily driven by the ability of CHO cells to be readily transfected and integrate recombinant DNA into the genome, high productivity potential, and proven ability to provide consistent product quality and robust manufacturing.2 Manufacturing cell lines are typically selected for the presence of a metabolic marker, such as dihydrofolate reductase (DHFR) or glutamine synthetase, followed by an amplification procedure to boost copy number to improve expression levels. The resulting populations from these selection events are heterogeneous and can differ markedly in expression due to differences in copy number and the number and chromosomal context of the integration sites themselves,3, 4, 5 in addition to the contributions from extrachromsomal and epigenetic changes that can occur during growth and selection processes.6 ‐8
Given this intrinsic heterogeneity in CHO cell lines, it is important for biopharmaceutical manufacturing processes to demonstrate consistent cell culture performance that results in consistent product quality. Accordingly, ICH guidelines were put in place nearly 20 years ago to establish appropriate manufacturing processes and standards around cell line generation.9 These guidelines and control strategies include the development, validation, and monitoring of the manufacturing process, which have been successful in ensuring the delivery of hundreds of biological therapeutic molecules over the past several decades.
A component of this control strategy is the inclusion of a cloning step during cell line development to help reduce heterogeneity and to enable the isolation of a productive and stable cell line. Regulatory agencies require demonstration of clonal derivation by requiring sponsors to provide evidence that the Master Cell Bank (MCB) has a high probability of being derived from a single cell origin. This assurance can be provided through a number of approaches, including the use of sophisticated imaging technology that can document a single cell in a well,10 validated cell sorting methods that have a high probability of single cell deposition,11, 12 or through multiple rounds of limited dilution cloning.13 However, for programs that are currently in the stage of filing Marketing Applications, cell line development activities were performed up to a decade ago or longer in some instances when some of the current state of the art methods to establish clonally derived cell lines were not commonly used or available. Consequently, in such instances where direct evidence of clonal derivation is not available, additional studies to provide such assurance may be necessary.
One approach to provide assurance that a cell line originated from single cell is to study the behavior of subclones that are isolated from the line under question; with the rationale that the cell line and process stability are linked to clonality. However, a combination of the known plasticity of CHO cells and the large number of population doublings from the cloning stage can lead to phenotypic and genotypic differences over time.5, 14 It is unclear if one could assess clonality definitively in such a manner, even in a cell line that has been shown to have consistent and stable performance. To assess the value of subclone analysis to provide evidence of clonal derivation of a cell line, we performed a subcloning experiment with a well‐characterized MCB that was derived from a single cell using advanced cell sorting and imaging technologies and studied the behavior and performance of the resulting subclones.
Materials and Methods
Cell line generation and cloning
The mAb producing cell line was generated by transfecting DNA containing the mAb light chain (LC) and heavy chain (HC) on two separate plasmids into a DHFR deficient CHO cell line. The plasmids include the DHFR gene to confer resistance. Transfected pools were grown in selective growth media and further were amplified using a fixed concentration of methotrexate (MTX). The amplified pools were cloned into 96‐well plates using gel microdrop (GMD) (CellSys 100 Microdrop Maker, One Cell Systems, Cambridge, MA) and FACS (FACSAria 2, BD Sciences, San Jose, CA). During cloning, the pool was incubated on ice for 10 min in the presence of a conjugated antibody against Fc and sorted at 1 cell/well into 96‐well plates containing serum‐free cloning medium with MTX. The plates were incubated at 37°C with 5% CO2 to allow for colony formation and growth. Each plate was imaged using a Clone Select Imager (Molecular Devices) on days 0 to identify wells with single cells, and 10 to facilitate assessment of single colony outgrowth of wells. The clonally verified cell lines were expanded and transferred to spin tubes in MTX growth media. The viable cell densities (VCD), viabilities, and population doubling levels (PDLs) were tracked in subsequent passages. The top clone was chosen based on productivity, growth and product quality attributes in both 20 mL fedbatch production and in 2 L bioreactors. The top clone was used to generate a pre‐Master Cell Bank (pre‐MCB), A pre‐MCB vial was then thawed into MTX growth media and scaled up to generate the MCB.
Cell line stability testing
To evaluate phenotypic and genotypic stability as a function of in vitro cell age, cell banks at predetermined population doubling levels (PDLs) were created representing different stages in the manufacturing process. Two vials were thawed, passaged in selective growth media containing MTX and were frozen at 15 PDLs, 30 PDLs, 50 PDLs, and 65 PDLs. These cell banks were then thawed and carried in selective media for an additional 25 PDLs to mimic the large‐scale seed train and then run in a 10D fed batch production in nonselective production media as described below, but in 20 mL culture volume.
Subcloning
A vial of the MCB was thawed and passaged twice in growth media with MTX. The cells were washed in PBS and incubated with an anti‐human‐Fc antibody in PBS in the dark. The anti‐human‐Fc antibody stained cells were washed twice in PBS and sorted into single cell/well using a FACS ARIA (FACSAria 2, BD Sciences, San Jose, CA). The plates were then imaged using the Clone Select Imager on day 0, 7, and 14. A 4× magnification was used for all the images. Selected wells were further passaged as described above.
Small‐scale fed‐batch plate cultures
A small‐scale 24 deep well plate (DWP) model was used to assess the performance of individual subclones and the MCB in duplicate in a 10‐day fed‐batch assay. Cells were cultured in 24 deep‐well plates (Axygen, Union City, CA) using proprietary chemically‐defined production medium without MTX. For all conditions, 3 mL working volume per well was used and cultures were cultivated in a humidified incubator (Kuhner AG, Basel, Switzerland) and shaken. The cells were inoculated at 8 × 10⁵ cells/mL and fed on days 3, 6, and 8. Cell density and viability were measured using Vi‐Cell (Beckman Coulter, Fullerton, CA) and concentrations of glucose were measured by a Bioprofile Flex Analyzer (Nova Biomedical, Waltham, MA). pH was not controlled in the 24 DWP cultures. Glucose concentration was maintained between 10 and 12 g/L though supplemental feeding using a 50 g/L stock solution. Samples were collected for titer analysis by HPLC (as described in the Analytical section).
Cell cultivation in bioreactors
To generate the seed culture for bioreactor inoculation, cells were expanded in MTX growth media in shake flasks (Corning Life Sciences, Oneonta, NY) and passaged every 3 or 4 days until there were enough cells to inoculate the bioreactors in duplicate. Bioreactor experiments were conducted in 3 L glass bioreactors (Applikon, Foster City, CA) at an initial working volume of 1.2 L of production media without MTX. The set points for dissolved oxygen (DO) concentration, pH, and temperature were 64%, 6.9, and 36°C, respectively. The pH was controlled by adding either 0.5 M Na2CO3 or CO2. Viable cell density, cell viability, and cell diameter were measured using a CDV (Roche Diagnostics Corporation, Indianapolis, IN). The bioreactor was fed at multiple points during the culture to bring the final bioreactor volume to approximately 100% of final working volume (1.5 L). Bioreactor glucose concentration was measured with the BioProfile FLEX Analyzer (Nova Biomedical, Waltham, MA) and maintained between 4 and 8 g/L though supplemental feeding using a 50 g/L stock solution.
DNA purification
Genomic DNA (gDNA) for the Southern blot and QPCR assays was extracted from cell pellets using a Blood and Cell Culture DNA Maxi kit (Qiagen). The concentration and quality were determined by UV spectrophotometry at 260 and 280 nm (NanoDrop).
Southern blot analysis
Southern blots were performed to examine the integration sites of the mAb genes. Genomic DNA from each sample was digested with NcoI‐HF restriction enzymes (New England Biolabs) that cut on the 5′ junction of the HC coding regions. DNA digests were separated on 0.8% TAE agarose gels. The gels were then denatured, and the DNA was transferred to a Zeta‐Probe® GT membrane (Bio‐Rad Laboratories) using capillary transfer overnight. Following transfer, the membrane was UV cross‐linked and hybridized with HC coding sequence DIG probe. The DNA probes covering the entire coding sequences of the genes were DIG labeled using the Roche PCR DIG Synthesis Kit (Roche Diagnostics). Following hybridization, the membranes were washed with a low and high stringency buffers and the blots were exposed on an imaging system to view the banding pattern.
Quantitative real‐time PCR
A quantitative real time PCR (qPCR) TaqMan assay was used to quantify the HC and LC coding regions in the samples using QuantStudio™ 7 system (Applied Biosystems). A standard curve was generated with a range of gDNA concentrations from each sample type, and amplification with the HC and LC primer and probe sets allowed for the determination of the number of copies of each gene present in each sample. The glyceraldehydes‐3‐phosphate dehydrogenase (GAPDH) gene was used as an internal calibrator for the number of genome copies present in each sample. A GAPDH primer and probe set was generated to correlate the number of cells represented with the amount of DNA present. The qPCR reactions were prepared in 20 µL volume and run in triplicate. The cycle profile used was 2 min at 50°C, 10 min at 95°C, followed by 40 cycles of 15 s at 95°C, and 1 min at 60°C for amplification. The gene copy numbers per cell were calculated as the ratio of gene copies to the number of cells for each of the dilutions for each sample.
Analytical methods
The titer of secreted recombinant protein was determined by a standard HPLC method with an affinity column (Protein A; Waters, Milford, MA). Cell culture supernatants were purified via affinity chromatography (Atoll GmbH, Weingarten, Germany) for product quality analysis. Size‐exclusion chromatography (SEC) was performed with a SE‐UHPLC column (Waters, Milford, MA). Purity was determined by calculating the percentage of each separated component as compared to the total integrated area. Three injections of a universal reference standard were included at the front and end of a sequence, and one product specific control injection. To assess sample acceptance, total peak areas and retention times for each sample must be within an established range. The chromatogram was then integrated to determine the high molecular weight (HMW), main peak (MP) and low molecular weight (LMW). N‐linked glycan oligosaccharides were enzymatically released from protein samples using PNGase F (Prozyme, Hayward, CA), and fluorescently labeled with 2‐Anthranilic Acid (2‐AA; Sigma‐Aldrich, St. Louis, MO). The 2‐AA labeled glycans were injected onto an ACQUITY H‐Class UPLC (Waters, Milford, MA), and separated via hydrophilic interaction liquid chromatography using a BEH Glycan column (Waters, Milford, MA). The chromatogram was integrated, and glycan species are reported as percent galactosylated, fucosylated, and high mannosylated (HMN).
Data analysis
Analyses were conducted with JMP Statistical Software (Version 11, SAS Institute Inc, Cary, NC). All linear correlation coefficients (R 2) were calculated to measure the strength of association between two variables where the closer the R 2 value is to 1, the closer the regression line perfectly fits the data.
Results
The workflow for clone generation described before is shown in Figure 1. The originating MCB was generated through a validated FACS method, followed by a day 0 image with high resolution imaging. This process results in a very high assurance of monoclonality, similar to methods described elsewhere.12 Clones were selected based on their monoclonality, productivity, and product quality attributes in both small scale followed by bioreactor production runs. Figures 2A–C shows the distribution of day 10 VCD, viability and relative titer from a 10 day production of selected clonal cell lines from the FACS cloning experiment. The top clone (white circle in Figures 2A–C) was expanded for generating the MCB. Genetic characterization of the MCB indicated a high copy number by qPCR from the MTX amplification event (average of 172 and 323 copies of the heavy and light chains, respectively). Despite high copy numbers, this cell line showed good production stability over time. The MCB was cultured in selective growth media through 65 PDLs (Figures 2D–F). Small scale fed batch production runs were performed in the absence of selection from banks frozen at noted timepoints. Production runs showed highly consistent growth and viability across all PDL points (Figures 2D,E). Endpoint titer (day 10) fell within a 95% confidence interval between the time points, Figure 2F). SEC measurements showed consistent HMW values at PDL 0 and 65 (2.3% and 2.5% respectively, data not shown).
Figure 1.

Generation of the original MCB and subclones.
Schematic of the experimental design. Pools were generated by transfection with the gene of interest (GOI), followed by selection and MTX amplification for increased productivity. The resulting pools were cloned using FACS and verified by day 0 imaging. The top clone was used for MCB creation. Subclones from this MCB were generated using FACS and verified by day 0 imaging (4× magnification). The resulting subclones were then tested for growth, productivity and product quality in a 24 Deep Well Plates fed‐batch (Fed‐batch 1) after accumulation of 10–20 PDLs. Another 24 DWP fed‐batch (Fed‐batch 2) was completed after further accumulation to 25–35 PDLs. The subclones were then tested in a bioreactor production.
Figure 2.

MCB clone selection and stability assessment.
Selected clones isolated from pools and with verified single cell origin were evaluated in a fed batch production run (A‐C). Distribution of end point VCDs (A), viability (B) and titer (C) of the individual clones and the selected MCB (open circle). Stability assessment results of selected MCB are shown in D–F. Cells were cultured in growth for 0, 15, 30, 50, 65 PDL, and banked. Fed batch productions from each banked timepoint were then run in parallel. VCD(D), and Viability (E) and relative end point titers (E) are shown. In E, blue lines indicate the 95% confidence band and the red lines represent the prediction band.
Phenotypic Effects from Subcloning: Small Scale
To understand if monoclonality of the MCB could be assessed through characterization of individual subclones, the MCB was cloned using the validated single cell FACS sorting method into 96 well plates, followed by imaging of single cells on day 0, 7, and 14 to confirm the resulting cell lines were monoclonal.
Of the subclones that were isolated and confirmed as single cells on day 0, 46 were scaled up and tested in a 10‐day 24 deep well plate fed‐batch assay. The original MCB was also included as a direct comparison to the subclones. Each fed‐batch experiment was set up in duplicate. Figure 3A shows the time course of VCD for the 46 subclones compared to the MCB over the 10 day fed batch assay. There was significant variability in clonal growth with a peak VCD range of 5 × 10⁶ cells/mL to 30 × 106 cells/mL ranging from day 6 to 8 depending on the subclone. The peak VCD for the MCB was 20 × 106 cell/mL at day 8. Similarly, end of production viabilities of the subclones showed a wide distribution from 20 to 75% while the ending MCB viability falls in the middle of this range at ∼55% (Figure 3B). Titers at day 10 spanned nearly a 5 fold range (Figure 4A), with the MCB day 10 titer near the average of the subclones. The HMW species ranged from 1.6 to 4.0% across all the subclones. Despite this diversity, the average subclone HMW was 2.45%, again, close to the MCB measured HMW of 2.6% (Figure 4B and Supporting Information Figure S1). While most subclones did not produce any LMW species, the few that did had very low levels (0 to 0.25%), with one exception at 2.6%.
Figure 3.

Subclones derived from the parental MCB show varied growth and viability.
VCD (A) and Viability (B) plots for Subclones (○) and MCB (•) from a representative Fed‐batch screen in 24 DWP. The range bars indicate the difference between duplicate MCB samples.
Figure 4.
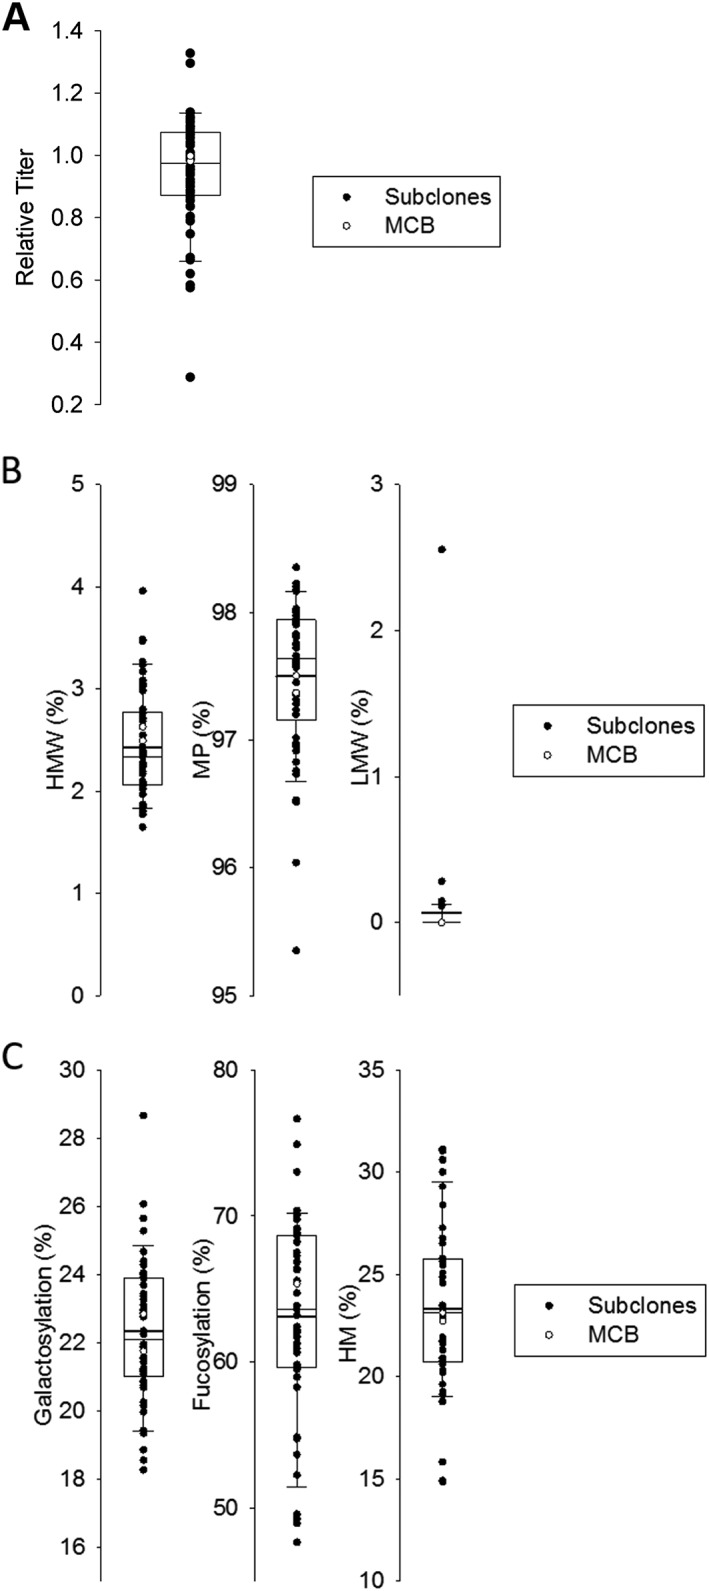
Subclones derived from the parental MCB show a wide variety in titer and product quality.
Titer (A), SEC (B) and glycan levels (C) results measured from product produced from representative fed‐batch screen in a 24 DWP. Subclones titers are presented as normalized values to the MCB titer, which is set at 1. Subclones (•) MCB (○).
The glycan levels for each major species, galactosylated, high mannose, and core fucosylated are shown in Figure 4C. While the average galactosylation level for all subclones was 22.3%, similar to the 21.9–22.3% range for the MCB replicates, the variability in subclone galactosylation ranged from 18.2% to 28.5%. Similar observations were made for high mannose (ranging from 14.9% to 31.1% with MCB average at 22.9%) and core fucosylated species (ranging from 47.7% to 76.6% with MCB average at 65.4%). Despite the significant diversity in glycan distribution and levels between the subclones, the averages across the subclones are highly similar to the glycan levels observed in the MCB.
To ensure the observed subclone variability was reproducible, a second set of fed‐batch experiments was conducted. The cell age differences between these two experiments was about 10–20 PDLs. A comparison of titer, HMW, main peak, galactosylated, and high mannose and day 6 viability species across these two experiments are shown in Figure 5. The LMW was also highly similar as before in all subclones, except the 2.6% LMW was not observed in the second run of that subclone, suggesting it may have been an outlier due to sample handling (data not shown). Overall, the correlations (R 2) ranged from 0.8 to 0.91 indicating good correlation between the data obtained from 2 experiments and confirms the observed variability in cell growth, productivity, and product quality across the subclones are due to intrinsic characteristics of the subclones and not due to experimental variability or instability.
Figure 5.

Comparison of subclones and MCB data in 2 independent fed‐batch assays.
Correlation between day 6 viabilities (A, R 2 = 0.91); titer (B, R 2= 0.99); HMW (C, R 2 = 0.91); MP (D, R 2 = 0.91); Galactosylation (E, R 2 = 0.86); HMN (F, R 2 = 0.80). The blue lines represent the 95% confidence band and the red lines represent the prediction band.
Genotypic Effects from Sub Cloning
Subclone and MCB cell pellets isolated from the fed‐batch assay were analyzed for copy number of the heavy and light chains of the mAb (Figure 6). However, the subclones heavy chain copy numbers spanned a large range from 100 to 380 copies/cell, with the average at 196 copies/cell, close to the MCB average of 167 copies/cell. The average subclone light chain copy number was 353 copies/cell, close to the MCB average of 323 copies/cell. Again the subclones light chain copy numbers spanned a large range from 100 to 675 copies/cell. Further, no correlation could be drawn between the copy number and protein productivity, indicating that the productivity variability cannot solely be explained due to copy number change.
Figure 6.

Copy number analysis of MCB and subclones in relation to titer.
Copy numbers for HC and LC for subclones and MCB plotted as a function of titer at the end of the 10 day fed‐batch assay. (R 2 for LC = 0.034 and R 2 for HC = 0.005).
Integration site analysis was performed by southern blot analysis of the 5′ junction of the HC gene on the MCB and the subclones (Figure 7). To compare integration patterns of distinct clonal cell lines, 2 other clones (X and Y) were included in this analysis. Clones X and Y were isolated during the original cloning experiment of the MCB (Figure 2) but were not selected as the lead clone due to lower productivity and growth performance. Results from 18 of the 46 subclones are shown in Figure 7. All 46 subclones showed highly similar results as presented here. The Southern Blot with the HC probe show a complex and large number of integration sites in the MCB and its subclones. Similar results were seen with an analysis of the LC integration sites (data not shown). Despite this, there are no significant visible changes in the banding pattern across the majority of subclones. Only two subclones (644 and 653) displayed some visible differences in the heavy chain banding pattern. Subclone 644 was missing the topmost and two bottommost bands after hybridization by the HC‐dig‐labeled probes (Figure 7, red dots). Subclone 653 was also missing several bands between 4.4 and 6.6 kb and a couple of bands below 4.4 kb as compared to the MCB and other subclones. Interestingly, Clone X and Y have a dramatically different integration site pattern from the MCB and from one another. This can be explained since Clone X, Y and the MCB were derived from distinct initial integration events at transfection, therefore the integration banding patterns between these clonal cell lines would be expected to differ.
Figure 7.

Integration site analysis by Southern Blotting.
Southern blots showing the 5′ cutter integration site heavy chain analysis for 18 clones. Each gel had a series of controls included (lane 1: ladder, lane 2: LC control, lane 3: HC control, lane 4: Clone X, lane 5: Clone Y, lane 6: MCB). On gel 1 lanes 7–15 were genomic DNA hybridized to HC‐dig labeled probe to Subclones 631–644 and Subclones 645–653 on gel 2. The red dots indicate the missing bands for the two clones with deletions (Subclone 644 and Subclone 653).
Phenotypic Effects from Subcloning: Bioreactor Evaluation
Based on growth, product quality and genetic characterization data, 6 subclones were selected to assay in a larger scale (Table 1). These spanned the range of observed values, including two with significantly lower peak growth than the MCB (644, 653), two that demonstrated higher peak growth than the MCB (621, 682), and three with lower titer (612, 644, 653). This set contains clones that show an increased transgene copy number (684 and 682) and the 2 subclones that show altered southern integration site patterns (644 and 653). Product quality attributes in the 6 selected subclones spanned the distribution of observed levels (i.e., high molecular weight (HMW) 2–3.5%; high mannose (HMN) 15–30%) (Table 1).
Table 1.
Characteristics of Subclones Selected for Bioreactor Experiments
| Clone | Day 6 VCD (e6) ± 95% CI | Peak VCD (e6) ± 95% CI | Final VCD (e6) ± 95% CI | D10 IVCD | D6 Viability (%) ± 95% CI | Final Viability (%) ± 95% CI | % HMW ± 95% CI | Normalized Titer | % Total Galactosylated ± 95% CI | % Total Fucosylated ±95% CI | % HMN ± 95% CI | HC Copy Number/Cell | LC Copy Number/Cell | Integration site‐Southern |
|---|---|---|---|---|---|---|---|---|---|---|---|---|---|---|
| 612 | 12.2 ± 0.6 | 12.2 ± 0.6 | 11.3 ± 2.0 | 79.7 | 88 ± 1.1 | 50 ± 1.7 | 2.2 ± 0.1 | 0.58 ± 0.00 | 23.3 ± 0.5 | 62.4 ± 1.7 | 21.6 ± 0.9 | 188.4 | 321.6 | matches MCB |
| 621 | 14.4 ± 0.4 | 21 ± 1.5 | 18.4 ± 0.5 | 108.3 | 93 ± 1.2 | 65 ± 2.0 | 3.5 ± 0.2 | 0.81 ± 0.01 | 18.3 ± 0.6 | 49 ± 2.0 | 31.0 ± 0.9 | 128.1 | 244.7 | matches MCB |
| 644 | 4.9 ± 0.7 | 7.4 ± 1.9 | 5.2 ± 0.2 | 40.3 | 70 ± 5.8 | 38 ± 2.8 | 2.2 ± 0.0 | 0.66 ± 0.03 | 22.8 ± 1.0 | 63.2 ± 3.8 | 23.5 ± 1.9 | 149.4 | 259.5 | rearrangement detected |
| 653 | 9.3 ± 0.2 | 9.3 ± 0.2 | 5.8 ± 3.6 | 51.2 | 75 ± 1.4 | 35 ± 12.3 | 2.0 ± 0.2 | 0.23 ± 0.09 | 26.1 ± 1.2 | 73.0 ± 6.5 | 15.8 ± 3.5 | 94.1 | 139.5 | rearrangement detected |
| 682 | 19.0 ± 2.5 | 26.7 ± 3.5 | 18.2 ± 1.9 | 139.0 | 95 ± 0.6 | 58 ± 0.9 | 2.4 ± 0.0 | 1.23 ± 0.01 | 21.1 ± 0.3 | 60.9 ± 1.4 | 25.5 ± 1.0 | 208.9 | 387.4 | matches MCB |
| 684 | 11.2 ± 2.2 | 14 ± 2.0 | 11.5 ± 3.8 | 80.0 | 86 ± 1.8 | 55 ± 5.2 | 2.4 ± 0.1 | 1.07 ± 0.01 | 23.9 ± 0.3 | 67.5 ± 3.9 | 20.9 ± 2.8 | 330.8 | 614.2 | matches MCB |
| MCB | 14.6 ± 3.8 | 19.2 ± 5.3 | 14.2 ± 1.9 | 94.5 | 89 ± 1.6 | 50 ± 10.5 | 2.6 ± 0.3 | 1.00 ± 0.07 | 22.3 ± 2.3 | 65.4 ± 7.7 | 22.9 ± 4.3 | 172.1 | 323.3 |
Measured values are from 24 DWP fed batch experiment. Results are shown for each clone as mean ± 95% Confidence Interval (CI).
The selected subclones and MCB were run in a fedbatch production in 3 L Applikon reactors to more closely reflect the conditions during clinical or commercial manufacturing (Figure 8). Under more controlled conditions, the differences in growth, titer and product quality measures could potentially normalize to be more similar to the MCB. However, we observed that the performance across the subclones vs. the MCB in the reactor again demonstrated differences in growth and viability cell density. Instead, the bioreactor results were more closely aligned to the previous 24 DWP fed batch productions from a subclone to subclone comparison. For example, although the overall growth profiles were different in the reactors compared to the deep well plates, the relative ranking of the subclones between the two production methods were similar (Figures 8A,B). Similarly, viability trends were consistent between the 24DWP and the reactors (Figures 8C,D). The peak cell densities ranged from 7 × 10⁶ cells/mL (Subclone 644) to 27 × 106 cells/mL (clone 682) in the 24 DWP, while in the bioreactor, they ranged 9 × 10⁶ cells/mL (Subclone 644) to 21 × 106 cells/mL (MCB). However, since process can influence absolute growth, the integral viable cell density (IVCD) for the subclones and MCB from the small‐scale fed‐batch and bioreactor were calculated and compared against each other to further demonstrate the correlation between the two scales (Figure 8E). IVCD calculated for the clones in the DWP was generally lower than that of the reactors, likely due to process (pH and DO) control within the reactor compared to the uncontrolled environment in the DWP. Despite this, the R 2 values between IVCD in DWP vs bioreactor was >0.95 for each subclone and the MCB, suggesting that the relative cell growth profiles in the subclones during a production run are intrinsic to each individual subclone or cell line.
Figure 8.

Comparison of process performance across scales.
VCD (A, B) and Viability (C, D) plots for the selected 6 subclones and MCB in 10 day fed‐batches in 24DWP (A, C) and Applikon bioreactors (B, D), respectively. The bars indicate the range between duplicate samples. The correlation between the clones from the fed‐batch from the DWP and the reactors are shown in (E), with R 2 values for each cell line shown.
The resulting titers show over twofold difference across the different subclones in the bioreactor productions, and show a consistent rank order between the small scale 24DWP and the reactors (Figures 9A,B). Subclones 682 and 684, with the highest titer in the 24 DWP resulted in similar titers in the reactors. The titers for Subclone 653 was the lowest in comparison to the other subclones; however, in the case of the bioreactor, Subclone 653 grew to double the cell density and hence the titer was also double that obtained in the 24DWP. Interestingly, Subclone 653 had the most noted Southern banding patterns differences, where a number of integration sites are missing. Further, this subclone had a lower copy number from the MCB. Subclone 644 also had a number of Southern bands deleted; however, this did not result in a lower titer as observed Subclone 653. The trends in the HMW (Figures 9C,D) were similar across the subclones tested in both small scale and large scale production platforms. Subclone 621 exhibited higher HMW species compared to the other product produced by other subclones, regardless of production format. In the MCB, the HMW was about 3% in both 24DWP and reactors. Similarly, although the titer was the lowest for Subclone 653, the HMW was similar to Subclones 612 and 644. Glycosylation level and trends were also similar between 24DWP and reactor production as well (data not shown). Therefore, despite the wide variability in the phenotypic performance as compared to the MCB, the performance of the individual subclones is quite consistent across different runs and scales.
Figure 9.

Titer and product quality across production scales.
Normalized Titer (A, B) and HMW (C, D) plots for the top 6 subclones and MCB in 10 day fed‐batches in 24DWP (A,C)and Applikon bioreactors (B,D), respectively. The bars indicate the range between duplicate samples.
Discussion
We have comprehensively characterized subclones derived from a clonal MCB using the methods and imaging technologies that provide a high level of assurance of monoclonality. Despite the established monoclonality and stability of the MCB (Figure 2), we see a wide difference in growth, productivity, and product quality among the 46 subclones derived from single cells of this MCB. The phenotypes are more reminiscent of the diversity seen in separate clonal populations rather than subclones from a clonally derived cell line. For example, the range of titers and growth profiles from the first round of cloning from pools (Figures 2A–C) is similar to the distribution observed from the analysis of the subclones (Figures 3 and 4). Further, these differences in productivity or performance could not be explained by the changes in the transgene integration or copy number as there was no correlation between copy number and titer, (Figure 6). There was only one instance where productivity drop could have been associated with a rearrangement or loss of integration sites out of the 46 subclones.
The observation of clonal heterogeneity in CHO cells is well documented5, 15, 16, 17, 18 and is certainly not unique to this study. Cells in culture, especially immortalized cell lines such as CHO, display well‐documented genetic plasticity,19 which when coupled with the large number of population doublings from the cloning stage can result in phenotypic and genotypic differences over time.14 These changes in phenotype have been linked to environmental influence, epigenetic silencing, chromosomal instability, and karyotypic changes.6, 7, 8, 20, 21 Given the number of population doublings that occur from single cell plating to a production bioreactor and the known plasticity observed in CHO cells, genetic and epigenetic drift can occur through the sub culturing and adaption phases during clonal outgrowth and subsequent culture during banking and bioprocess.8, 22
Therefore, observed phenotypic differences likely stem from changes in gene expression patterns across the genome during the clonal outgrowth and adaptation process. For example, RNAseq analysis of a DG44‐CHO cell line identified over 100 differentially expressed genes between subclones with high and low productivity and over 300 differentially expressed genes were identified when comparing two highly productive subclones.23 Similar to our study, a significant variation in gene copy number was evident in subclones derived from the same parental cell line.23 Epigenetic changes, chromosome instability, and karyotypic alterations have all been noted to be correlated with high clonal heterogeneities.20, 6, 7, 24 For example, subcloning and selection for a high producing phenotype has been reported to generate prominent changes in DNA‐methylation patterns,8 thereby imprinting genome wide changes that result in transcriptional differences across the genome. Further, reports of chromosomal rearrangements in populations from single cell derived populations spontaneously occur in short expansion periods from 19–27 days and changes in chromosomal rearrangements were shown to be induced during subculture and selection or environmental changes.6, 7 It seems probable then that the analysis of subclones of this clonally derived cell line is a sampling of the drift that occurs during this process. Indeed, the measured characteristics, such as titer, VCD, copy number and HMW of the originating MCB are around the average of the subclones for each measured parameter (Figures 3 and 4). To further confound these observations, subcloning involves exposure to shear forces within the FACS instrument, followed by outgrowth in media to support low density growth which can change selection pressures and induce population changes.25, 26 Therefore, the act of subcloning itself could amplify the differences observed in the population, resulting in subclone profiles more diverse than existed in the original clonal cell line.
Selection pressure, such as MTX amplification, has been reported to result in largely increased copy numbers, which can drive increased productivity.27 This can also result in instability due to the increased copy number as well as susceptibility to the introduction of sequence variants and rearrangements.4, 28, 29, 30, 31 The MCB in this study has a very high copy number and complex integration pattern. Despite this, the MCB shows production stability over 65 PDLs, without significant change in productivity over that time. Interestingly, while we do observe wide changes in copy number in the subclones as compared to the MCB, they are not adequate to explain related growth and productivity changes. There were a significant number of subclones with higher copy numbers than the MCB. Copy number increase could occur through further adaption to MTX, as the initial cloning and subcloning process was performed in the presence of MTX and could have further amplified during outgrowth process.
Despite the heterogeneity observed in the growth, productivity, copy number, and product quality profiles among the subclones, analysis of the southern blot data provides some evidence that they are related to the originating MCB. Integration site analysis validates the clones were derived from a single cell given the similarity of the complex banding pattern observed in all subclones to the MCB. In this particular MCB, there is a very high level of observed integration sites as well as 100's of copies, likely due to a significant methotrexate amplification event. In addition, despite the diversity seen in the subclone population, the number and pattern of the integration sites are largely consistent. Visible changes in the integration site pattern, such as loss of bands, which suggests loss or rearrangement of an integration site, were only detected in two of the 46 subclones, and in only one that could be correlated to a loss in productivity. However, even in those cases, the majority of bands were still similar to the MCB. Such analysis therefore could provide some evidence that an integration site analysis of subclones could be used to show a genetic link between cells within a MCB in cell lines that were derived from a random integration event, as each event will give a unique pattern. For example, clones X and Y in Figure 5 originated from a different transfection event than the MCB and have very different integration sites as determined by their southern banding pattern profile from the MCB or subclones, this clearly demonstrates these clones arose from unique integration and separate amplification events. However, if one was to perform a similar subclone analysis on cell lines with many fewer integration sites, such as clone X or Y, rearrangements within individual subclones could result in changes in banding patterns on the southern blot which appear to be unrelated to the original MCB. This may lead to a conclusion that the subclones must have been derived from distinct integration events, which may not be the case as reported in Ko et al.32 Therefore, integration southern blot analysis of subclones could be used to provide supporting evidence of clonal derivation of a MCB, when the cell line is derived from random integration events but cannot be used with confidence to suggest that the MCB is nonclonal.
Conclusions
The clonal selection process is designed in practice to select for a cell line that gives stable and reproducible growth, productivity, and product quality. In this study, an MCB was derived from a single cell using validated cloning and imaging techniques to provide a high assurance of clonality. The MCB was selected for its productivity, performance, and stability over 65 PDLs. However, the subclones that were then derived from this MCB showed significant diversity in growth, productivity and product quality. Despite the significant phenotypic and gene copy number differences between the subclones, the performance of the individual subclones were consistent between different production runs at different scales. Markers of the original integration event of the transgene constructs, such as southern integration analysis or other techniques could provide some evidence of clonal origin, though genetic drift or rearrangements could confound analysis. In total, this work demonstrates that clonal derivation does not correlate to cell bank homogeneity. It is critical to recognize that a culture of any production cell line consists of a population of cells, and total homogeneity, genotypic or phenotypic, is not achievable given the genomic plasticity inherent to immortalized mammalian cell lines,3 but this does not prevent the establishment of stable cell lines that give consistent processes and product quality. Simply characterizing subclone performance is not an acceptable approach to provide assurance that a cell line was derived from a single cell. Assurance therefore is best served in through selection and characterization of a cell line that gives stable and consistent product and process performance over time.
Supporting information
Additional supporting information may be found online in the Supporting Information section at the end of the article.
Supporting Information
Acknowledgments
We would like to thank Jasmine Tat and Hannah Victor for help with bioreactors. Janice Chen, Jennifer Zapparelli, Mee Ko, Eleanor Le, Skyler Smith, Miranda Hutt for help with titer and product quality analysis. Kim Le, Chun Chen, and Huong Le for fruitful discussions and feedback.
Literature Cited
- 1. EvaluatePharma . EvaluatePharma World Preview 2017, Outlook to 2022. in EvaluatePharma Reports (Evaluate, 2017).
- 2. Frye C, Deshpande R, Estes S, Francissen K, Joly J, Lubiniecki A, Munro T, Russell R, Wang T, Anderson K. Industry view on the relative importance of “clonality” of biopharmaceutical‐producing cell lines. Biologicals. 2016;44:117–122. [DOI] [PubMed] [Google Scholar]
- 3. Barnes LM, Bentley CM, Dickson AJ. Stability of protein production from recombinant mammalian cells. Biotechnol Bioeng. 2003;81:631–639. [DOI] [PubMed] [Google Scholar]
- 4. He L, Winterrowd C, Kadura I, Frye C. Transgene copy number distribution profiles in recombinant CHO cell lines revealed by single cell analyses. Biotechnol Bioeng. 2012;109:1713–1722. [DOI] [PubMed] [Google Scholar]
- 5. Pilbrough W, Munro TP, Gray P. Intraclonal protein expression heterogeneity in recombinant CHO cells. PloS One. 2009;4:e8432. [DOI] [PMC free article] [PubMed] [Google Scholar]
- 6. Vcelar S, Jadhav V, Melcher M, Auer N, Hrdina A, Sagmeister R, Heffner K, Puklowski A, Betenbaugh M, Wenger T, Leisch F, Baumann M, Borth N. Karyotype variation of CHO host cell lines over time in culture characterized by chromosome counting and chromosome painting. Biotechnol Bioeng. 2018;115:165–173. [DOI] [PubMed] [Google Scholar]
- 7. Vcelar S, Melcher M, Auer N, Hrdina A, Puklowski A, Leisch F, Jadhav V, Wenger T, Baumann M, Borth N. Changes in chromosome counts and patterns in CHO cell lines upon generation of recombinant cell lines and subcloning. Biotechnol J. 2018;13:1700495. e1700495 [DOI] [PubMed] [Google Scholar]
- 8. Feichtinger J, Hernández I, Fischer C, Hanscho M, Auer N, Hackl M, Jadhav V, Baumann M, Krempl PM, Schmidl C, Farlik M, Schuster M, Merkel A, Sommer A, Heath S, Rico D, Bock C, Thallinger GG, Borth N. Comprehensive genome and epigenome characterization of CHO cells in response to evolutionary pressures and over time. Biotechnol Bioeng. 2016;113:2241–2253. [DOI] [PMC free article] [PubMed] [Google Scholar]
- 9.ICH harmonised tripartite guideline derivation and characterisation of cell substrates used for production of biotechnological/biological products Q5D. Inernational conference on harmonisation of technical requirements for registration of pharamaceuticals for human use; 1997.
- 10. Evans K, Albanetti T, Venkat R, Schoner R, Savery J, Miro‐Quesada G, Rajan B, Groves C. Assurance of monoclonality in one round of cloning through cell sorting for single cell deposition coupled with high resolution cell imaging. Biotechnol Prog. 2015;31:1172–1178. [DOI] [PMC free article] [PubMed] [Google Scholar]
- 11. Joensson HN, Andersson Svahn H. Droplet microfluidics–a tool for single‐cell analysis. Angew Chem Int Ed Engl. 2012;51:12176–12192. [DOI] [PubMed] [Google Scholar]
- 12. Fieder J, Schulz P, Gorr I, Bradl H, Wenger T. A single‐step FACS sorting strategy in conjunction with fluorescent vital dye imaging efficiently assures clonality of biopharmaceutical production cell lines. Biotechnol J. 2017;12:1700002. [DOI] [PubMed] [Google Scholar]
- 13. Coller HA, Coller BS. [37] Poisson statistical analysis of repetitive subcloning by the limiting dilution technique as a way of assessing hybridoma monoclonality In: Methods in Enzymology (Vol. 121, pp. 412–417). Academic Press; Cambridge, Massachusetts, 1986. [DOI] [PubMed] [Google Scholar]
- 14. Wurm FM, Wurm MJ. Cloning of CHO cells, productivity and genetic stability—a discussion. Processes. 2017;5:20. [Google Scholar]
- 15. Kim NS, Kim SJ, Lee GM. Clonal variability within dihydrofolate reductase‐mediated gene amplified Chinese hamster ovary cells: Stability in the absence of selective pressure. Biotechnol Bioeng. 1998;60:679–688. [PubMed] [Google Scholar]
- 16. Davies SL, Lovelady CS, Grainger RK, Racher AJ, Young RJ, James DC. Functional heterogeneity and heritability in CHO cell populations. Biotechnol Bioeng. 2013;110:260–274. [DOI] [PubMed] [Google Scholar]
- 17. Pichler J, Galosy S, Mott J, Borth N. Selection of CHO host cell subclones with increased specific antibody production rates by repeated cycles of transient transfection and cell sorting. Biotechnol Bioeng. 2011;108:386–394. [DOI] [PubMed] [Google Scholar]
- 18. Konrad MW, Storrie B, Glaser DA, Thompson LH. Clonal variation in colony morphology and growth of CHO cells cultured on agar. Cell. 1977;10:305–312. [DOI] [PubMed] [Google Scholar]
- 19. Lenski RE. Experimental evolution and the dynamics of adaptation and genome evolution in microbial populations. ISME J. 2017;11:2181–2194. [DOI] [PMC free article] [PubMed] [Google Scholar]
- 20. Baik JY, Lee KH. Growth rate changes in CHO host cells are associated with karyotypic heterogeneity. Biotechnol J.1700268‐n/a. [DOI] [PubMed] [Google Scholar]
- 21. Shridhar S, Klanert G, Auer N, Hernandez‐Lopez I, Kańduła MM, Hackl M, Grillari J, Stralis‐Pavese N, Kreil DP, Borth N. Transcriptomic changes in CHO cells after adaptation to suspension growth in protein‐free medium analysed by a species‐specific microarray. J Biotechnol. 2017;257:13–21. [DOI] [PubMed] [Google Scholar]
- 22. Rouiller Y, Kleuser B, Toso E, Palinksy W, Rossi M, Rossatto P, Barberio D, Broly H. Reciprocal translocation observed in end‐of‐production cells of a commercial CHO‐based process. PDA J Pharm Sci Technol. 2015;69:540–552. [DOI] [PubMed] [Google Scholar]
- 23. Chen K, Li D, Li H, Li B, Li J, Huang L, Li R, Xu X, Jiang L, Jiang C, Gu H, Fang J. Genetic analysis of heterogeneous sub‐clones in recombinant Chinese hamster ovary cells. Appl Microbiol Biotechnol. 2017;101:5785–5797. [DOI] [PubMed] [Google Scholar]
- 24. Spencer S, Gugliotta A, Koenitzer J, Hauser H, Wirth D. Stability of single copy transgene expression in CHOK1 cells is affected by histone modifications but not by DNA methylation. J Biotechnol. 2015;195:15–29. [DOI] [PubMed] [Google Scholar]
- 25. Du Z, Mujacic M, Le K, Caspary G, Nunn H, Heath C, Reddy P. Analysis of heterogeneity and instability of stable mAb‐expressing CHO cells. Biotechnol Bioprocess Eng. 2013;18:419–429. [Google Scholar]
- 26. Zhu J, Wooh JW, Hou JJC, Hughes BS, Gray PP, Munro TP. Recombinant human albumin supports single cell cloning of CHO cells in chemically defined media. Biotechnol Prog. 2012;28:887–891. [DOI] [PubMed] [Google Scholar]
- 27. Pendse GJ, Karkare S, Bailey JE. Effect of cloned gene dosage on cell growth and hepatitis B surface antigen synthesis and secretion in recombinant CHO cells. Biotechnol Bioeng. 1992;40:119–129. [DOI] [PubMed] [Google Scholar]
- 28. Kaufman R, Schimke R. Amplification and loss of dihydrofolate reductase genes in a Chinese hamster ovary cell line. Mol Cell Biol. 1981;1:1069–1076. [DOI] [PMC free article] [PubMed] [Google Scholar]
- 29. Kim SJ, Kim NS, Ryu CJ, Hong HJ, Lee GM. Characterization of chimeric antibody producing CHO cells in the course of dihydrofolate reductase‐mediated gene amplification and their stability in the absence of selective pressure. Biotechnol Bioeng. 1998;58:73–84. [PubMed] [Google Scholar]
- 30. Drummond JT, Genschel J, Wolf E, Modrich P. DHFR/MSH3 amplification in methotrexate‐resistant cells alters the hMutSα/hMutSβ ratio and reduces the efficiency of base–base mismatch repair. Proc Natl Acad Sci. 1997;94:10144–10149. [DOI] [PMC free article] [PubMed] [Google Scholar]
- 31. Yoshikawa T, Nakanishi F, Ogura Y, Oi D, Omasa T, Katakura Y, Kishimoto M, Suga K. Amplified gene location in chromosomal DNA affected recombinant protein production and stability of amplified genes. Biotechnol Prog. 2000;16:710–715. [DOI] [PubMed] [Google Scholar]
- 32. Ko P, Misaghi S, Hu Z, Zhan D, Tsukuda J, Yim M, Sanford M, Shaw D, Shiratori M, Snedecor B, Laird M, Shen A. Probing the importance of clonality: Single cell subcloning of clonally derived CHO cell lines yields widely diverse clones differing in growth, productivity, and product quality. Biotechnol Prog. 2017. [DOI] [PubMed] [Google Scholar]
Associated Data
This section collects any data citations, data availability statements, or supplementary materials included in this article.
Supplementary Materials
Additional supporting information may be found online in the Supporting Information section at the end of the article.
Supporting Information