Abstract
Here, we aimed to investigate the carcinogenic effects of apolipoprotein C1 (APOC1) in prostate cancer (PCa). APOC1 expression was evaluated in PCa and normal prostate specimens, and lentivirus‐mediated RNA interference was used to knockdown APOC1 in DU145 cells. The effects of APOC1 silencing on cell proliferation, cell cycle arrest, and apoptosis were assessed. APOC1 expression was much higher in PCa tissues than in normal tissues. Moreover, APOC1 silencing inhibited cell proliferation and colony formation, arrested cell cycle progression, and enhanced apoptosis in DU145 cells. Additionally, APOC1 silencing decreased survivin, phospho‐Rb, and p21 levels and increased cleaved caspase‐3 expression. These data supported the procarcinogenic effects of APOC1 in the pathogenesis of PCa and suggested that targeting APOC1 may have applications in the treatment of PCa.
Keywords: apolipoprotein C1, cell apoptosis, cell proliferation, prostate cancer, RNA interference
1. INTRODUCTION
In 2017, prostate cancer (PCa) is estimated to be the third leading cause of cancer‐related death among men in the United States of America, second only to lung and colorectal cancers.1 In China, the rates of PCa‐related morbidity and mortality have increased by 5% within the last decade.2 In 1941, Nobel Prize winners Huggins and Hodges confirmed, for the first time, that androgen ablation therapy had an obviously curative effect on PCa; thus, this therapeutic approach has become a standard treatment for metastatic PCa.3 Unfortunately, almost all patients with PCa undergo a transition from hormone‐dependent to hormone‐independent cancer and eventually develop castration‐resistant PCa (CRPC), which has an average survival time of only 18 months.4, 5, 6 Currently, the treatment options for CRPC are limited and primarily include radiotherapy or chemotherapy, which can only temporarily extend the patient's life and does not completely control or cure the disease. In recent years, biological‐targeted therapy for CRPC has become a hot research topic. Therefore, it is important to identify the CRPC‐associated genes to improve our understanding of this disease and identify novel therapeutic targets.
Apolipoproteins, as important lipoproteins, are involved in sustaining the lipoprotein structure, modulating the interplay between lipoproteins and cellular receptors, and regulating the activities of enzymes associated with the metabolism of intravascular lipoproteins.7 Apolipoprotein C1 (APOC1), which is located on chromosome 19, is the smallest apolipoprotein (only 6.6 kDa) and a component of both triglyceride‐rich lipoproteins and high‐density lipoproteins, which are important in the metabolism of plasma lipoproteins.8, 9 Previous studies have shown that APOC1 is involved in numerous biological processes, including cholesterol catabolism, membrane remodeling, and dendritic reorganization, through its interactions with apolipoprotein E (ApoE).10, 11 Additionally, APOC1 is highly expressed in the liver, but only weakly expressed in the skin and fatty tissues in transgenic mice.12, 13 APOC1 may disrupt the removal of low‐density lipoprotein (LDL) from the blood by suppressing the uptake of LDL granules in the liver.14, 15 Several studies have shown that APOC1 is related to the progression of multiple diseases, such as diabetic nephropathy, type 1 or type 2 diabetes, Alzheimer's disease, and glomerulosclerosis.16, 17, 18, 19, 20 Moreover, Berbee et al. 21 reported that the modulatory effects of APOC1 on inflammation decrease the number of gram‐negative bacteria and further prevent mice from dying of sepsis.
Recent studies have shown that APOC1 may be associated with the development of breast cancer, pancreatic cancer, and lung cancer15, 22, 23; however, the role of APOC1 in PCa has not been reported. Accordingly, in this study, we knocked down APOC1 expression in PCa cell lines using RNA interference (RNAi) technology and then explored the effects of APOC1 on PCa in vitro.
2. MATERIALS AND METHODS
2.1. Reagents and antibodies
Ham's F12 medium and fetal bovine serum (FBS) were purchased from Gibco (Carlsbad, CA, USA) and Biowest (Kansas City, MO, USA), respectively. Dulbecco's modified Eagle's medium (DMEM) and Roswell Park Memorial Institute‐1640 (RPMI‐1640) were purchased from Hyclone (South Logan, UT, USA). Lentivirus packing vectors, including the short hairpin RNA vector pGreenPuro shRNA Cloning and Expression Lenti‐vector, and pHelper plasmid Lentiviral Packaging Mix, were from Hollylab (Shanghai, China) and Sigma (St. Louis, MO, USA), respectively. TRIzol RNA isolation reagent and nuclease‐free water were obtained from Invitrogen (Carlsbad, CA, USA). IQ SYBR Green Supermix was from Bio‐Rad (Hercules, CA, USA). Moloney murine leukemia virus reverse transcriptase (M‐MLV RT) was purchased from Promega (Madison, WI, USA). 3‐(4,5)‐Dimethylthiahiazo(‐z‐y1)‐3,5‐di‐phenytetrazoliumromide (MTT) and crystal violet were obtained from Sigma. Anti‐APOC1 antibodies were from SAB (College Park, MD, USA). Anti‐survivin, anti‐Rb, anti‐phospho‐Rb (Ser807/811), anti‐p‐21, and anti‐cleaved caspase‐3 antibodies were purchased from Cell Signaling Technology (Danvers, MA, USA). Anti‐glyceraldehyde 3‐phosphate dehydrogenase antibodies were from Proteintech (Rosemont, IL, USA). Goat anti‐rabbit IgG‐horseradish peroxidase was from Santa Cruz Biotechnology (Dallas, TX, USA). Other chemical reagents used in the experiments were all obtained from Sangon Biotech (Shanghai, China).
2.2. Oncomine analysis
The publicly available Oncomine cancer microarray database (http://www.oncomine.org) was used to determine the clinical value of APOC1 expression in PCa. Four independent datasets, including Singh Prostate, Liu Prostate, Lapointe Prostate, and Tomlins Prostate, which contained a total of more than 300 samples, were applied to compare APOC1 expression in PCa (199 cases) and normal specimens (125 cases). Furthermore, the correlation between APOC1 expression level and Gleason score was analyzed in the Singh Prostate dataset (52 PCa cases).
2.3. Cell culture
Human embryonic kidney cells (HEK293T; American Type Culture Collection [ATCC], Manassas, VA, USA) was maintained in DMEM supplemented with 10% FBS. DU145 and PC‐3 PCa cells (ATCC) were cultured in Ham's F12 medium supplemented with 10% FBS, and 22RV1 and LNCap PCa cells were maintained in RPMI‐1640 supplemented with 10% FBS. All cells were incubated at 37°C in a humid atmosphere containing 5% CO2.
2.4. Lentivirus construction and cell infection
We designed the following short hairpin (shRNA) sequences to knockdown the expression of APOC1 (NM_001645): 5′‐GCTGAAGGAGTTTGGAAACAC‐3′ (S1) and 5′‐GACATTTCAGAAAGTGAAGGA‐3′ (S2); the negative control shRNA sequence was 5′‐TTCTCCGAACGTGTCACGT‐3′. The annealed stem‐loop‐stem oligos were ligated into the pGreenPuro vector through BamHI/EcoRI restriction enzyme cutting sites to fabricate pGreenPuro‐shAPOC1 (S1/S2) and pGreenPuro‐shCon. The recombinant plasmids were verified by the sequencing. Then, the recombinant pGreenPuro‐shRNA plasmid and helper plasmid Lentiviral Packaging Mix were transfected into HEK293T cells using Lipofectamine 2000 to prepare lentivirus according to the manufacturer's directions.
DU145 cells were infected with recombinant lentivirus containing shAPOC1 (S1/S2) and negative control (shCon) at a multiplicity of infection of 40 for 120 h. Then, the expression of green fluorescent protein, which was contained in the vector, was observed through fluorescence microscopy (Olympus, Tokyo, Japan) to evaluate the infection efficiency.
2.5. Quantitative reverse transcription polymerase chain reaction and Western blot analysis
For quantitative reverse transcription polymerase chain reaction (qRT‐PCR) analysis, total RNAs were extracted from cells using TRIzol reagent, and reverse transcription was performed to synthesize cDNA using M‐MLV RT according to the manufacturer's instructions. Subsequently, qRT‐PCR analysis was carried out using SYBR Green with a Bio‐Rad Connet Real‐Time PCR platform (Bio‐Rad). The primers used were as follows: APOC1 (forward: 5′‐CGGTCCTGGTGGTGGTTCTG‐3′ and reverse: 5′‐GTTTGATGCGGCTGATGAGTTCC‐3′) and β‐actin (forward: 5′‐GTGGACATCCGCAAAGAC‐3′ and reverse: 5′‐AAAGGGTGTAACGCAACTA‐3′). For Western blot analysis, cells were and lysed in 2× sodium dodecyl sulfate (SDS), and equal amounts of protein were separated by SDS‐polyacrylamide gel electrophoresis on 10% gels and transferred to polyvinylidene fluoride membranes (Millipore, Bedford, MA, USA). After blocking in 5% bovine serum albumin, the membranes were sequentially probed with primary antibodies, incubated with secondary antibodies, and detected using ECL Plus Western Blotting Detection Reagents (Amersham, Pittsburgh, PA, USA), as described previously.24
2.6. Cell proliferation assay
For MTT assays, cells infected with shAPOC1 (S1/S2) and shCon were seeded at a density of 2.5 × 10³ cells/well in 96‐well plates. After incubation for 1–5 days, MTT (20 μL, 5.0 mg/mL) was added to each well. The cells were incubated for 4 h, followed by the addition of 100 μL acidic isopropanol overnight. The optical density was measured using an Epoch Microplate Spectrophotometer (BioTek, Winooski, VT, USA).
For colony formation assays, cells infected with shAPOC1 (S1/S2) and shCon were seeded at a density of 500 cells/well in 6‐well plates. After culturing for 2 weeks, cells were immobilized with 4% paraformaldehyde and stained with crystal violet. Finally, the colonies were observed and counted by light microscopy (Olympus).
2.7. Flow cytometry assay
For cell cycle assays, cells were harvested, fixed in 70% ethanol, stained in 500 μL phosphate‐buffered saline (PBS) containing 50 μg/mL propidium iodide and 100 μg/mL RNase A. After incubation, the cell cycle distribution was measured using a flow cytometer (Beckman, Brea, CA, USA).
For cell apoptosis assays, cells were harvested, washed with PBS, and then stained using an Annexin V‐APC/7‐AAD Apoptosis Assays Kit (KeyGEN Biotech, Nanjing, China) according to the manufacturer's instructions. Finally, apoptosis was analyzed by flow cytometry.
2.8. Statistical analysis
GraphPad Prism software (version 6.0; La Jolla, CA, USA) was used to carry out statistical analysis. The data are shown as means ± standard deviations and analyzed using Student's t tests. Results with P values of less than 0.05 were considered statistically significant.
3. RESULTS
3.1. APOC1 was highly expressed in PCa tissues and was associated with Gleason score
First, we analyzed the expression level of APOC1 using data from the Oncomine cancer database and found that APOC1 was significantly upregulated in PCa tissues compared with that in normal tissues in all four independent datasets, including Singh Prostate (P = 2.21E−5), Liu Prostate (P = 4.53E−5), Lapointe Prostate (P = 5.06E−6), and Tomlins Prostate (P = 9.45E−5; Figure 1A). Moreover, APOC1 expression was significantly upregulated in PCa tissues with a Gleason score equal to or greater than 7 in the Singh Prostate dataset (P < 0.05; Figure 1B).
Figure 1.
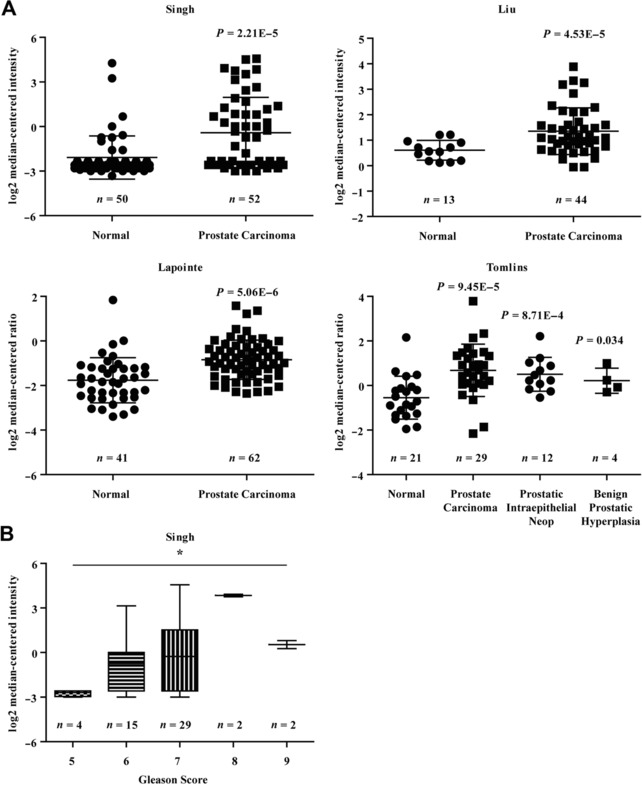
APOC1 expression was high in prostate cancer tissues and was related to Gleason score. (A) Four independent datasets from Oncomine cancer database, including Singh Prostate, Liu Prostate, Lapointe Prostate, and Tomlins Prostate, were analyzed to determine the differential expression of APOC1 between prostate cancer and normal tissues. (B) The association between APOC1 expression and Gleason score was evaluated in Singh Prostate dataset. *P < 0.05
3.2. Lentivirus‐mediated shRNA successfully knocked down the expression of APOC1 in DU145 cells
At the start of the study, we performed Western blot analysis to detect the expression level of endogenous APOC1 in different PCa cell lines, including DU145, PC‐3, 22RV1, and LNCaP cells, to choose a suitable cell model. As shown in Figure 2A, APOC1 was highly expressed in four PCa cell lines, particularly DU145 cells. Therefore, DU145 cells were used for subsequent analyses.
Figure 2.
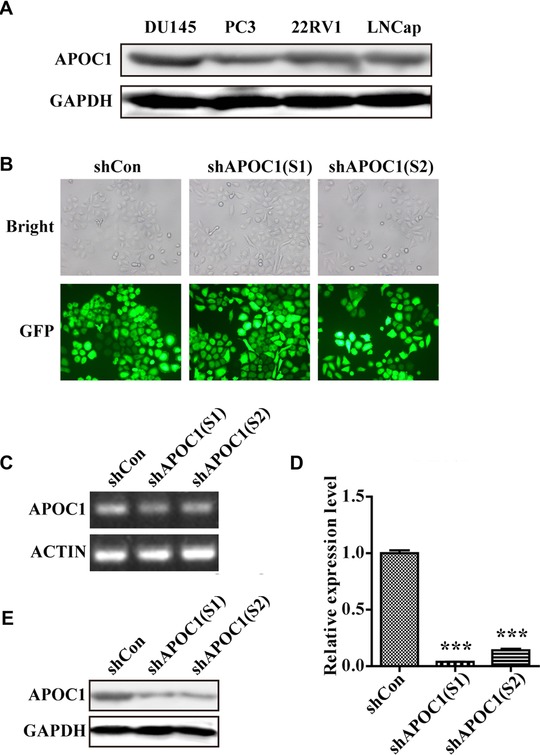
Lentivirus‐mediated shRNA successfully downregulated the expression of APOC1 in DU145 cells. (A) The expression level of APOC1 in four different PCa cell lines was determined by Western blot assays. (B) Representative images of DU145 cells infected with shCon, shAPOC1 (S1), and shAPOC1 (S2). (C and D) Knockdown efficiency of APOC1 mRNA was analyzed by quantitative real‐time PCR. (E) Knockdown efficiency of APOC1 protein was analyzed by Western blotting. ***P < 0.001
DU145 cells were then transfected with shCon or shAPOC1(S1/S2), and the transfection efficiency reached 90%, as detected by fluorescence microscopy (Figure 2B). Furthermore, the results of qRT‐PCR and Western blot assays showed that APOC1 was dramatically downregulated at both the mRNA (P < 0.001; Figures 2C and 2D) and protein levels (Figure 2E) in DU145 cells.
3.3. Knockdown of APOC1 expression inhibited PCa cell growth
We next explored the effects of APOC1 knockdown on PCa cell growth by MTT and colony formation assays. The results showed that the cell proliferation rates of shAPOC1 (S1) and shAPOC1 (S2) groups were significantly lower than that of the shCon group (Figure 3A; P < 0.001). Moreover, knockdown of APOC1 in DU145 cells obviously decreased the size and number of colonies in comparison with that in the shCon group (Figures 3B and 3C; P < 0.001). These results confirmed that knockdown of APOC1 impaired PCa cell growth.
Figure 3.
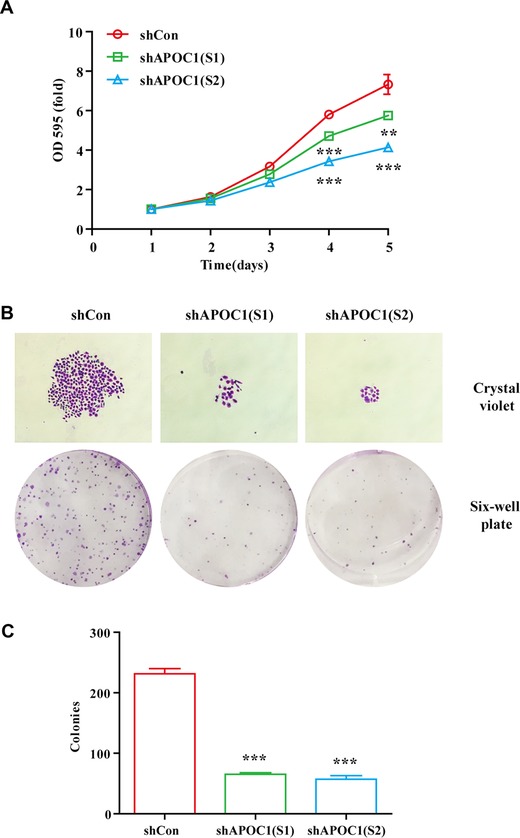
Knockdown of APOC1 expression inhibited prostate cancer cell growth. (A) Proliferation curves of DU145 cells infected with shCon, shAPOC1 (S1), and shAPOC1 (S2) were generated using MTT assays. (B) Representative images of colony formation assays in DU145 cells infected with shCon, shAPOC1 (S1), and shAPOC1 (S2). (C) Quantitative analysis of colony formation. **P < 0.01, ***P < 0.001
3.4. Knockdown of APOC1 expression caused cell cycle arrest and apoptosis in PCa cells
We further investigated the effects of APOC1 knockdown on cell cycle progression and apoptosis by flow cytometry. As shown in Figures 4A and 4B, knockdown of APOC1 expression increased the percentage of cells in G0/G1 and G2/M phases (P < 0.05, P < 0.01, P < 0.001, respectively) but decreased the percentage of cells in S phase (P < 0.001). Moreover, the percentage of cells in sub‐G1 phase was significantly higher in APOC1‐knockdown groups than that in the control group, indicating that downregulation of APOC1 promoted apoptosis (Figure 4C; P < 0.01, P < 0.001, respectively). Consistent with this, Annexin V‐APC/7‐AAD apoptosis assays revealed that 14.5% and 35.4% of DU145 cells in the shAPOC1 (S1) and shAPOC1 (S2) groups were apoptotic, whereas only 6.3% of cells in the shCon group were apoptotic (Figures 4D and 4E). These results suggested that knockdown of APOC1 expression in DU145 cells arrested the cell cycle at G2/M phase and enhanced apoptosis.
Figure 4.
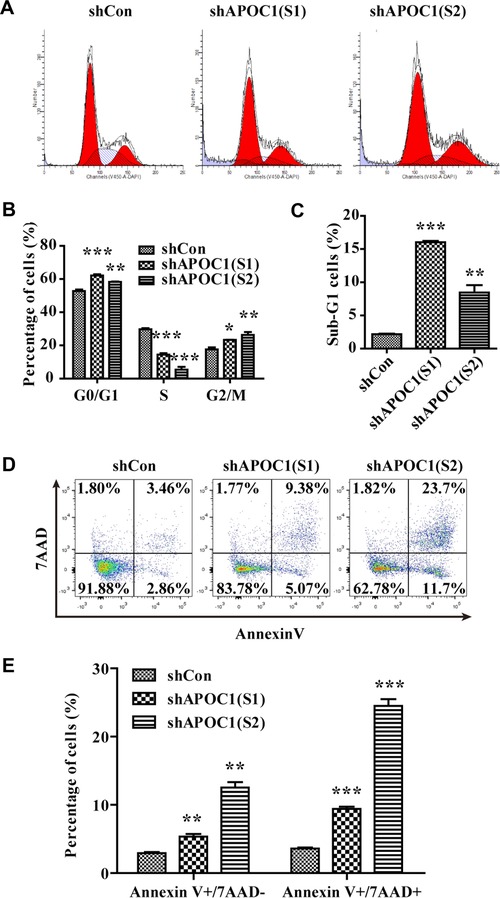
Knockdown of APOC1 expression caused cell cycle arrest and apoptosis in prostate cancer cells. (A) Representative flow cytometry images of the cell cycle distribution in DU145 cells infected with shCon, shAPOC1 (S1), and shAPOC1 (S2). (B) Quantitative analysis of the cell cycle distribution. (C) Quantitative analysis of cells in sub‐G1 phase. (D) Representative flow cytometry images of apoptosis in DU145 cells infected with shCon, shAPOC1 (S1), and shAPOC1 (S2). (E) Quantitative analysis of apoptosis. *P < 0.05, **P < 0.01, ***P < 0.001
3.5. Knockdown of APOC1 expression affected the expression levels of downstream proteins
Because knockdown of APOC1 expression induced cell cycle arrest and apoptosis, we then examined which downstream signaling pathways were regulated by APOC1 silencing. Western blot assay revealed that knockdown of APOC1 expression decreased survivin, phospho‐Rb, and p21 levels and increased cleaved caspase‐3 expression (Figure 5A). Therefore, knockdown of APOC1 expression regulated survivin/Rb/p21/caspase‐3 downstream signaling pathways in DU145 cells (Figure 5B).
Figure 5.
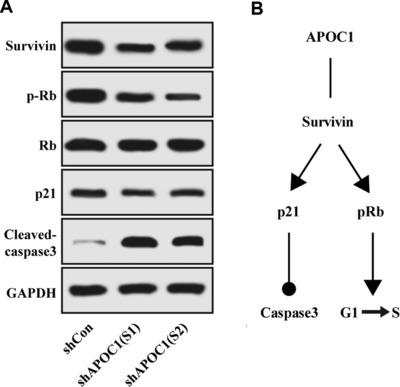
Knockdown of APOC1 expression affected the expression levels of downstream proteins. (A) Survivin, Rb, phospho‐Rb, p21, and cleaved caspase‐3 levels were analyzed by Western blotting in DU145 cells infected with shCon, shAPOC1 (S1), and shAPOC1 (S2). (B) The model for APOC1‐dependent regulation of downstream signaling pathways
4. DISCUSSION
In the current study, we found that APOC1 was overexpressed in PCa specimens and that APOC1 expression was strongly associated with Gleason score, suggesting that APOC1 may be a potential diagnostic marker in PCa progression. Consistent with these findings, APOC1 has been reported to be a promising serum marker for the diagnosis and treatment of multiple cancers, such as gastric cancer,25 pancreatic cancer,26 colorectal cancer,27 thyroid carcinoma,28 and non‐small cell lung cancer.29
Detection of alterations in proliferative ability is commonly used to assess the effects of novel oncogenes in tumors. In this study, we found that knockdown of APOC1 expression inhibited cell proliferation, arrested the cell cycle at G2/M phase, and promoted apoptosis in DU145 PCa cells in vitro. Similarly, Takano et al.23 showed that inhibition of APOC1 expression suppressed cell survival and induced apoptosis in pancreatic cancer. Additionally, other apolipoproteins, such as apolipoprotein J/clusterin (CLU) and ApoE, may also be involved in the progression of human tumors. Trougakos et al.30 showed that silencing of CLU suppressed cell growth and enhanced spontaneous apoptosis in osteosarcoma and PCa cells. Chen et al.31, 32 found that downregulation of ApoE that was closely associated with APOC1‐induced cell cycle arrest in G2 phase and apoptosis in ovarian cancer cells.
Survivin, a novel anti‐apoptotic gene, has been shown to be involved in regulation of the cell cycle and apoptosis.33, 34 High expression of survivin accelerates the G1 to S transition in the cell cycle and further increases cell proliferation ability.35 Furthermore, survivin, through its interaction with the cell cycle regulator CDK4, induces the release of p21 and phosphorylation of Rb and exerts its anti‐apoptotic effects by interacting with caspase‐3, which could reduce DNA repair ability and induce apoptotic cell death once activated.36, 37 Additionally, p21 is a critical cell cycle regulator and can suppress multiple cyclin/CDK complexes, leading to dephosphorylation of Rb protein and thereby inducing cell cycle arrest.38 In our study, we found that APOC1 silencing decreased survivin, phospho‐Rb, and p21 levels, but upregulated cleaved caspase‐3 expression. These findings suggested that knockdown of APOC1 expression may mediate PCa cell survival, partly via the regulation of survivin/Rb/p21/caspase‐3 signaling pathways.
5. CONCLUSIONS
We found that APOC1 mediated cancer cell survival, cell cycle distribution, and apoptosis by regulation of survivin/Rb/p21/caspase‐3 signaling pathways, suggesting that APOC1 may be an important molecular event linked to PCa. Further studies are needed to elucidate the function of APOC1 in vivo; such studies may facilitate the development of novel therapeutics for PCa through targeting APOC1.
CONFLICT OF INTEREST
The authors declare that there are no conflicts of interest.
ACKNOWLEDGMENTS
The authors thank professor Shui‐liang Wang for technical assistance with cellular experiments.
Su W‐p, Sun L‐n, Yang S‐l, et al. Apolipoprotein C1 promotes prostate cancer cell proliferation in vitro. J Biochem Mol Toxicol. 2018;32:e22158 10.1002/jbt.22158
Contributor Information
Wei‐zhen Wu, Email: 13905915547@163.com.
Dong Wang, Email: dongwang_2017@163.com.
REFERENCES
- 1. Siegel R. L., Miller K. D., Jemal A., CA Cancer J. Clin. 2017, 67, 7. [DOI] [PubMed] [Google Scholar]
- 2. Chen W., Zheng R., Baade P. D., Zhang S., Zeng H., Bray F., Jemal A., Yu X. Q., He J., CA Cancer J. Clin. 2016, 66, 115. [DOI] [PubMed] [Google Scholar]
- 3. Lytton B., J. Urol. 2001, 165(6 Pt 1), 1859. [PubMed] [Google Scholar]
- 4. Gittes R. F.. N. Engl. J. Med. 1991, 324, 236. [DOI] [PubMed] [Google Scholar]
- 5. Fizazi K., Martinez L. A., Sikes C. R., Johnston D. A., Stephens L. C., McDonnell T. J., Logothetis C. J., Trapman J., Pisters L. L., Ordonez N. G. and others. Clin. Cancer Res. 2002, 8, 775. [PubMed] [Google Scholar]
- 6. Kokontis J. M., Lin H. P., Jiang S. S., Lin C. Y., Fukuchi J., Hiipakka R. A., Chung C. J., Chan T. M., Liao S., Chang C. H. and others. PLoS One 2014, 9, e109170. [DOI] [PMC free article] [PubMed] [Google Scholar]
- 7. Krasteva V., Brodeur M. R., Tremblay F. L., Falstrault L., Brissette L., Biochim. Biophys. Acta 2010, 1801, 42. [DOI] [PubMed] [Google Scholar]
- 8. Xu Y., Berglund L., Ramakrishnan R., Mayeux R., Ngai C., Holleran S., Tycko B., Leff T., Shachter N. S., J. Lipid Res. 1999, 40, 50. [PubMed] [Google Scholar]
- 9. Su M., Zhou Y., Wang D., Xu T., Chang W., Wang M., Yu X., Feng D., Han Z., Yan W., Protein Expr. Purif. 2011, 78, 22. [DOI] [PubMed] [Google Scholar]
- 10. Leduc V., Jasmin‐Belanger S., Poirier J., Trends Mol. Med. 2010, 16, 469. [DOI] [PubMed] [Google Scholar]
- 11. Poirier J., Hess M., May P. C., Finch C. E., Brain Res. Mol. Brain Res. 1991, 9, 191. [DOI] [PubMed] [Google Scholar]
- 12. Jong M. C., Gijbels M. J., Dahlmans V. E., Gorp P. J., Koopman S. J., Ponec M., Hofker M. H., Havekes L. M., J. Clin. Invest. 1998, 101, 145. [DOI] [PMC free article] [PubMed] [Google Scholar]
- 13. Simonet W. S., Bucay N., Lauer S. J., Taylor J. M., J. Biol. Chem. 1993, 268, 8221. [PubMed] [Google Scholar]
- 14. Huang S., Qiao J., Li R., Wang L., Li M., Fertil. Steril. 2010, 94, 205. [DOI] [PubMed] [Google Scholar]
- 15. Sun Y., Zhang J., Guo F., Zhao W., Zhan Y., Liu C., Fan Y., Wang J., Med. Sci. Monit. 2016, 22, 1152. [DOI] [PMC free article] [PubMed] [Google Scholar]
- 16. Mooyaart A. L., Valk E. J., van Es L. A., Bruijn J. A., de Heer E., Freedman B. I., Dekkers O. M., Baelde H. J., Diabetologia 2011, 54, 544. [DOI] [PMC free article] [PubMed] [Google Scholar]
- 17. McKay G. J., Savage D. A., Patterson C. C., Lewis G., McKnight A. J., Maxwell A. P., Warren U. K. G. S.G., PLoS One 2013, 8, e58472. [DOI] [PMC free article] [PubMed] [Google Scholar]
- 18. Bouillet B., Gautier T., Blache D., Pais de Barros J. P., Duvillard L., Petit J. M., Lagrost L., Verges B., Diabetes Care 2014, 37, 1148. [DOI] [PubMed] [Google Scholar]
- 19. Ki C. S., Na D. L., Kim D. K., Kim H. J., Kim J. W., Neurosci. Lett. 2002, 319, 75. [DOI] [PubMed] [Google Scholar]
- 20. Bus P., Pierneef L., Bor R., Wolterbeek R., van Es L. A., Rensen P. C., de Heer E., Havekes L. M., Bruijn J. A., Berbee J. F. and others, J. Pathol. 2017, 241, 589. [DOI] [PubMed] [Google Scholar]
- 21. Berbee J. F., van der Hoogt C. C., Kleemann R., Schippers E. F., Kitchens R. L., van Dissel J. T., Bakker‐Woudenberg I. A., Havekes L. M., Rensen P. C., FASEB J. 2006, 20, 2162. [DOI] [PubMed] [Google Scholar]
- 22. Ko H. L., Wang Y. S., Fong W. L., Chi M. S., Chi K. H., Kao S. J., Thorac. Cancer 2014, 5, 500. [DOI] [PMC free article] [PubMed] [Google Scholar]
- 23. Takano S., Yoshitomi H., Togawa A., Sogawa K., Shida T., Kimura F., Shimizu H., Tomonaga T., Nomura F., Miyazaki M., Oncogene 2008, 27, 2810. [DOI] [PubMed] [Google Scholar]
- 24. Huang H., Jiang Y., Wang Y., Chen T., Yang L., He H., Lin Z., Liu T., Yang T., Kamp D. W. and others. Cancer Lett. 2015, 362, 15. [DOI] [PubMed] [Google Scholar]
- 25. Cohen M., Yossef R., Erez T., Kugel A., Welt M., Karpasas M. M., Bones J., Rudd P. M., Taieb J., Boissin H. and others. PLoS One 2011, 6, e14540. [DOI] [PMC free article] [PubMed] [Google Scholar]
- 26. Xue A., Scarlett C. J., Chung L., Butturini G., Scarpa A., Gandy R., Wilson S. R., Baxter R. C., Smith R. C., Br. J. Cancer 2010, 103, 391. [DOI] [PMC free article] [PubMed] [Google Scholar]
- 27. Engwegen J. Y., Helgason H. H., Cats A., Harris N., Bonfrer J. M., Schellens J. H., Beijnen J. H., World J. Gastroenterol. 2006, 12, 1536. [DOI] [PMC free article] [PubMed] [Google Scholar]
- 28. Fan Y., Shi L., Liu Q., Dong R., Zhang Q., Yang S., Fan Y., Yang H., Wu P., Yu J. and others. Mol. Cancer 2009, 8, 79. [DOI] [PMC free article] [PubMed] [Google Scholar]
- 29. Yang Y., Zhao S., Fan Y., Zhao F., Liu Q., Hu W., Liu D., Fan K., Wang J., Wang J., Technol. Cancer Res. Treat. 2009, 8, 455. [DOI] [PubMed] [Google Scholar]
- 30. Trougakos I. P., So A., Jansen B., Gleave M. E., Gonos E. S., Cancer Res. 2004, 64, 1834. [DOI] [PubMed] [Google Scholar]
- 31. Chen Y. C., Pohl G., Wang T. L., Morin P. J., Risberg B., Kristensen G. B., Yu A., Davidson B., Shih Ie M., Cancer Res. 2005, 65, 331. [PubMed] [Google Scholar]
- 32. Lauer S. J., Walker D., Elshourbagy N. A., Reardon C. A., Levy‐Wilson B., Taylor J. M., J. Biol. Chem. 1988, 263, 7277. [PubMed] [Google Scholar]
- 33. Altieri D. C., Biochem. J. 2010, 430, 199. [DOI] [PMC free article] [PubMed] [Google Scholar]
- 34. Altieri D. C., Trends Mol. Med. 2001, 7, 542. [DOI] [PubMed] [Google Scholar]
- 35. Suzuki A., Hayashida M., Ito T., Kawano H., Nakano T., Miura M., Akahane K., Shiraki K., Oncogene 2000, 19, 3225. [DOI] [PubMed] [Google Scholar]
- 36. Suzuki A., Ito T., Kawano H., Hayashida M., Hayasaki Y., Tsutomi Y., Akahane K., Nakano T., Miura M., Shiraki K., Oncogene 2000, 19, 1346. [DOI] [PubMed] [Google Scholar]
- 37. Zhen Z. G., Ren S. H., Ji H. M., Ma J. H., Ding X. M., Feng F. Q., Chen S. L., Zou P., Ren J. R., Jia L., Biomed. Pharmacother. 2017, 95, 363. [DOI] [PubMed] [Google Scholar]
- 38. Deng S., Hu B., An H. M., Du Q., Xu L., Shen K. P., Shi X. F., Wei M. M., Wu Y., BMC Complement. Altern. Med. 2013, 13, 128. [DOI] [PMC free article] [PubMed] [Google Scholar]


