

Abstract
Aims
To compare real‐world antidiabetic treatment outcomes over 12 months in obese people with type 2 diabetes mellitus (T2DM) who previously received oral antidiabetic therapy and then initiated a first injectable therapy with liraglutide or basal insulin.
Patients and methods
This was a retrospective, propensity score‐matched, longitudinal cohort study using real‐world data (January 2010 to December 2015) from the Dutch PHARMO Database Network. Adult obese (body mass index [BMI] ≥35 kg/m2) patients with T2DM with ≥2 dispensing dates for liraglutide or basal insulin supported oral therapy (BOT) were selected. The primary endpoint was the change in glycated haemoglobin (HbA1c) from baseline during 12 months of follow‐up. The secondary endpoints were the changes in weight, BMI and cardiovascular risk factors from baseline. Clinical data were analysed using descriptive statistics and compared using mixed models for repeated measures.
Results
Obese patients with T2DM (N = 1157) in each treatment group were matched (liraglutide cohort, n = 544; BOT cohort, n = 613). From 3 months onwards, glycaemic control improved in both cohorts but improved significantly more with liraglutide than with BOT (12 months: −12.2 mmol/mol vs −8.8 mmol/mol; P = .0053). In addition, weight and BMI were significantly lower for treatments with liraglutide vs BOT (12 months: −6.0 kg vs −1.6 kg and − 2.1 kg/m2 vs −0.5 kg/m2, respectively; P < .0001 for both). No significant differences were seen in changes in cardiovascular risk factors.
Conclusions
The results of this real‐world study in matched obese patients with T2DM showed that liraglutide was more effective than BOT for HbA1c control and weight/BMI reductions. Patients were more likely to maintain glycaemic control over time after initiating liraglutide than after initiating BOT.
Keywords: liraglutide, obese, real‐world data, T2DM, the Netherlands
1. INTRODUCTION
In 2013, 56 million people were diagnosed with diabetes in Europe, with a further increase of 10 million projected by 2035.1 Diabetes is associated with disability and is a major cause of premature mortality.2 Compared with that in the general population, the risk of coronary heart disease is 2 to 4 times higher in men and women with type 2 diabetes mellitus (T2DM), respectively.3 Half of people with T2DM die prematurely from a cardiovascular cause, while ~10% die from renal failure. Compared with non‐overweight people, overweight and obese people with T2DM are at an even greater risk of coronary heart disease, stroke, cardiovascular disease and all‐cause mortality,4 and their weight negatively impacts their lives and perception of health status.5
Diabetes is therefore one of the world's leading causes of healthcare expenditure and of economic loss in society. The American Diabetes Association (ADA) calculated that people with diabetes have healthcare expenditure 2.3 times higher than that for the same population without diabetes.6 While the care for people with diabetes who experience macro‐ and microvascular complications is particularly costly to the healthcare system7, 8; metabolic complications may explain ~11% of the extra costs of the disease.6 In the Netherlands, the total economic burden of diabetes was calculated to be €6.8 bn in 2016.9 More than half (~€4.0 bn) of these costs are indirect and are related to productivity losses, welfare payments and complications, with another €2.9 bn spent on disease care and treatment of complications.
In a joint position paper, both the ADA and the European Association for the Study of Diabetes have recommended a stepwise addition of one of five classes of anti‐hyperglycaemic drugs to metformin when patients fail to achieve their glycated haemoglobin (HbA1c) target.10, 11 When considering pharmacological treatments for obese patients with T2DM, it is suggested that medications should be chosen to promote weight loss or to be weight‐neutral, to improve insulin resistance and to reduce blood pressure and blood lipid levels.12, 13 Fear of weight gain and hypoglycaemia are risk factors known to delay intensification of antidiabetic treatment.14, 15 Obtaining tight glycaemic control with certain antidiabetic medications, particularly insulin and sulphonylureas, may paradoxically be accompanied by an increased risk of weight gain and hypoglycaemia,16 while this effect is not observed for antidiabetic treatment with glucagon‐like peptide 1 receptor agonists (GLP‐1RAs), sodium‐glucose co‐transporter‐2 inhibitors and dipeptidyl peptidase‐4 inhibitors. The explanation for these differences is linked to the mode of action of different classes of antidiabetic drugs. Randomized clinical trials (RCTs) have shown that intensification with a long‐acting GLP‐1RA, compared with basal insulin supported oral therapy (BOT) only, leads to improved glycaemic control, weight reduction and a lower risk of hypoglycaemia.17 Although RCTs provide evidence of the efficacy and safety of diabetes treatments, these trials are limited by their design, setting and patient characteristics. Hence, the results cannot be generalized directly to the real‐world clinical setting.18 An evidence gap exists, therefore, between RCTs and real‐world practice that warrants studies using real‐world data.
To our knowledge, there are no real‐world studies that compare liraglutide with BOT in a matched population with T2DM. The primary objective of the present study, therefore, was to compare the outcomes of liraglutide and BOT treatments over a period of 12 months after treatment initiation in obese people with T2DM (body mass index [BMI] ≥35 kg/m2) in the Netherlands. The study focused on patients who were on prior oral antidiabetic (OAD) therapy and who initiated their first injectable therapy with liraglutide or BOT. The secondary objective was to perform the same analysis over a period of 24 months, or until the time point at which the cohort size was still >50% of the size at baseline (≤50% attrition).
2. MATERIALS AND METHODS
2.1. Study design
This was a retrospective, propensity score‐matched, real‐world, longitudinal cohort study in people with T2DM with a BMI ≥35 kg/m2. Data were obtained from the PHARMO Database Network.19 Patients who started treatment with liraglutide or BOT between January 1, 2010 and December 31, 2015 in the Netherlands were included. HbA1c change from baseline to 12 months and to either 24 months or 50% attrition was the primary endpoint. The secondary endpoints were changes in absolute weight, BMI, systolic (SBP) and diastolic blood pressure (DBP), and blood lipids, including total, LDL and HDL cholesterol. The proportion of patients who reached the target HbA1c at 3, 6, 9 and 12 months was also assessed. The HbA1c targets were ≤53 mmol/mol (≤7.0%) for patients aged <70 years, ≤58 mmol/mol (≤7.5%) for older patients with a diabetes duration <10 years, and ≤64 mmol/mol (≤8%) for all remaining patients in line with the Dutch treatment guidelines.20
2.2. Data source
The PHARMO Database Network is a population‐based network of probabilistically linked electronic healthcare databases collecting real‐world data from multiple primary and secondary healthcare settings, representing up to a quarter of the population spread throughout the Netherlands.19 Out‐patient pharmacy drug dispensing and clinical laboratory test results, which were prescribed and ordered by both specialists and general practitioners (GPs), were complemented with the GP records of 1.1 million patients. The GP Database comprises data from electronic patient health records recorded by GPs and includes information on diagnoses, symptoms, clinical assessments, laboratory test results, referrals to specialists and prescriptions. Ethics committee approval was not obtained; in the Netherlands, this approval is not required for database research with anonymous data.
2.3. Study population
From the Out‐patient Pharmacy Database, data from patients using liraglutide or BOT were included based on the following inclusion criteria: (1) BMI ≥35 kg/m2 for BOT users (this criterion was not specified for liraglutide users as BMI ≥35 kg/m2 and specialist initiation are required for GLP‐1RA reimbursement in the Netherlands. As a result, BMI information is often missing in the GP records but assumed to be ≥35 kg/m2); (2) at least a 6‐month history of outpatient data previous to the cohort entry date; (3) new use of liraglutide or BOT, defined as having no dispensing history for these treatments prior to the cohort entry date and ≥2 consecutive dispensing dates of liraglutide or BOT after the cohort entry date; (4) prior OAD therapy; and (5) ≥1 measurement of the analysed data in the year prior to the cohort entry date, as well as ≥1 measurement between 12 weeks after the cohort entry date and the end of follow‐up. The criterion of ≥1 measurement after 12 weeks was added to ensure that the analyses were based on patients for whom it could be reasonably expected that a treatment effect could be observed.
The individual cohort entry date (baseline) was the date of the first dispensing of liraglutide or BOT. Patients were followed from baseline to 24 months or until the time point at which the cohort size was still >50% of the size at baseline (≤50% attrition) to prevent too much bias from differential attrition rates. Reasons for ending the observation earlier were change in the type of treatment, end of database registration (loss to follow‐up), or death. For users of liraglutide, change in treatment was defined as cessation of use or add‐on of any insulin or another GLP‐1RA; for BOT users, change in treatment was defined as either cessation of BOT use or add‐on of any other insulin or a GLP‐1RA. Changes in concomitant OAD drugs were allowed in both cohorts.
A series of steps were followed to select eligible patients and form two matched cohorts of patients receiving either liraglutide or BOT (Figure 1). Propensity score matching was performed to minimize selection bias attributable to the more restrictive reimbursement conditions for GLP‐1RAs than for BOT.21
Figure 1.
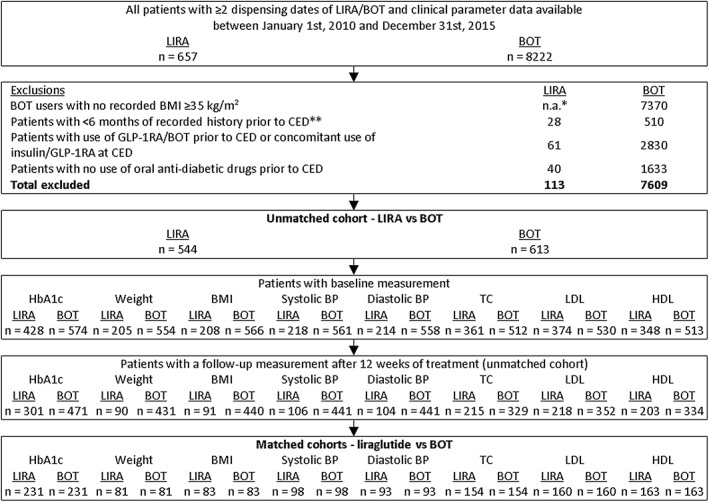
Selection of two matched cohorts of patients on liraglutide (LIRA) or basal insulin supported oral therapy (BOT). *The exclusion criteria ‘no recorded BMI ≥35 kg/m2’ was only applied to BOT users, as it is a reimbursement criteria for glucagon‐like peptide‐1 receptor agonist (GLP‐1RA) use in the Netherlands. **Cohort entry date (CED) = date of the first dispensing of LIRA or BOT within the study period. BMI, body mass index; BP, blood pressure; HDL, high density lipoprotein; LDL, low density lipoprotein; TC, total cholesterol
2.4. Study cohort definition
To ensure comparable treatment cohorts and to include as many patients as possible, selected liraglutide and BOT users were matched per outcome, resulting in eight matched cohorts. Matching (ratio 1:1) was based on propensity scores determined with logistic regression modelling with categorical variables (Table S1) in order to allow the contribution of clinical variables that were not known for all patients, but were not the main outcome of interest. Variables significantly associated with the probability of receiving liraglutide (univariate type III P < .05) were included in a backward selection process, retaining the variables that were significantly associated in the multivariate model (P < .05). Age was always included in the propensity score. The variable “concomitant OAD treatment at start of liraglutide or BOT” was an exact matching criterion outside the scope of the propensity score. Patients were matched on the logit of the propensity score using callipers with a width equal to 0.2 of the standard deviation (SD).
2.5. Statistical analysis
Descriptive statistics (arithmetic mean and SD; median and interquartile range [IQR]; counts [n] and proportions [%]) were calculated for demographic variables, for changes in clinical variables from baseline to 3, 6, 9 and 12 months, and for the 50% attrition time point. For each 3‐month interval, the last measurement was included in the analyses. No lag time was required for the 3‐month time point. Mixed‐effect models repeated measurements analyses were used to compare changes in clinical variables from baseline between patients in the liraglutide and BOT cohorts. All available data were used in the analysis in order to estimate the mean change vs baseline values for each clinical outcome at each time interval. The mixed model allowed missing time points and used available information from the patients with missing time points and similar patients to estimate the least squares mean (LSM) at each time point.22
The model included the patient number as a random effect. Fixed effects included study drug, time interval, interaction between study drug and time interval, age (continuous), gender, baseline value of the modelled outcome, and prior OAD treatment. Other covariates were added as categorical fixed effects if they were significantly associated (P < .05) with the modelled outcome. Modelled point estimates with 95% CIs for the change over time adjusted for confounders were calculated. Point estimates of the difference in LSM with 95% CIs were obtained for every 3 months of follow‐up.
The HbA1c targets were ≤53 mmol/mol (≤7.0%) for patients aged <70 years, ≤58 mmol/mol (≤7.5%) for older patients with a diabetes duration <10 years, and ≤64 mmol/mol (≤8%) for all remaining patients.20 The proportion of patients reaching their HbA1c target was assessed per 3‐month interval. For missing time points, the last observation was carried forward until the next available time point or the end of follow‐up for each patient.
All data were analysed using SAS programs in SAS Enterprise Guide version 7.1 (SAS Institute Inc., Cary, NC, USA) and conducted in Windows using SAS version 9.4.
3. RESULTS
Between January 1, 2010 and December 31, 2015, 8879 patients with ≥2 consecutive dispensing dates for either liraglutide (n = 657) or BOT (n = 8222) were identified in the PHARMO Database Network. Of the insulin users, 7609 (93%) were excluded, mainly because of missing BMI data for 90% of all insulin users. For liraglutide users, prior use of insulin or other GLP‐1RAs accounted for 9% of the 17% who were excluded; 34% of basal insulin users also used fast‐acting insulin. The minimal recorded history of 6 months necessary for baseline assessments was lacking in 4% of liraglutide and 6% of basal insulin users. The failure of oral therapy required for reimbursement of GLP‐1RAs could not be determined for 6% of GLP‐1RA and 20% of basal insulin users. After the general inclusion and exclusion criteria were applied, 544 liraglutide and 613 BOT users were included in the unmatched cohort (Figure 1). Further stepwise selection resulted in two matched cohorts of patients receiving liraglutide or BOT per outcome. This selection resulted in 231 patients per cohort for the primary endpoint of change from baseline in HbA1c. Matching resulted in comparable cohorts. In Figure S1, the logit of the propensity score distribution is given for HbA1c, weight and BMI.
3.1. Demographic and clinical characteristics of the studied cohorts
Patient demographics and their clinical characteristics for the HbA1c outcomes are shown in Table 1. The mean ages and gender distributions in the matched cohorts were similar (liraglutide cohort: 58.3 ± 10.3 years, 44% men; BOT cohort: 61.3 ± 10.5 years, 45% men).
Table 1.
Demographic, clinical and treatment characteristics of the unmatched and matched liraglutide and BOT cohorts at baseline and at 12 months of treatment for the main outcome, glycated haemoglobin
| Liraglutide | BOT | |||
|---|---|---|---|---|
| Unmatched | Matched | Unmatched | Matched | |
| n = 301 | n = 231 | n = 471 | n = 231 | |
| General characteristics | ||||
| Age (years), mean ± SD | 57.5 ± 9.9 | 58.3 ± 10.3 | 62.5 ± 11.1 | 61.3 ± 10.5 |
| Gender male, n (%) | 156 (52) | 101 (44) | 164 (35) | 104 (45) |
| Clinical parameters, mean ± SDa | ||||
| HbA1c (mmol/mol) | 68.4 ± 13.3 | 68.1 ± 13.8 | 70.1 ± 13.2 | 70.2 ± 12.8 |
| On goal, n (%) | 43 (14) | 36 (16) | 69 (15) | 26 (11) |
| BMI (kg/m2) | 39.8 ± 5.5 | 40.0 ± 5.5 | 37.6 ± 4.2 | 37.7 ± 4.4 |
| Weight (kg) | 115.9 ± 17.8 | 115.4 ± 17.3 | 106.1 ± 16.5 | 107.7 ± 17.3 |
| Systolic BP (mm Hg) | 137.9 ± 15.1 | 137.7 ± 15.5 | 138.7 ± 16.1 | 138.4 ± 16.3 |
| Diastolic BP (mm Hg) | 80.6 ± 9.9 | 80.5 ± 10.1 | 80.1 ± 9.4 | 81.1 ± 9.5 |
| TC (mmol/L) | 4.4 ± 1.0 | 4.4 ± 1.0 | 4.6 ± 1.0 | 4.6 ± 1.0 |
| LDL (mmol/L) | 2.2 ± 0.8 | 2.3 ± 0.8 | 2.5 ± 0.9 | 2.5 ± 0.9 |
| HDL (mmol/L) | 1.06 ± 0.28 | 1.08 ± 0.29 | 1.12 ± 0.29 | 1.07 ± 0.29 |
| Cardiovascular co‐medication, n (%) | ||||
| Statins | 222 (74) | 169 (73) | 345 (73) | 168 (73) |
| Anti‐hypertensives | 244 (81) | 184 (80) | 388 (82) | 198 (86) |
| Loop diuretics | 38 (13) | 29 (13) | 75 (16) | 32 (14) |
| Anticoagulants | 106 (35) | 79 (34) | 175 (37) | 91 (39) |
| Cardiac medication | 26 (9) | 20 (9) | 53 (11) | 23 (10) |
| Anti‐diabetic treatment characteristics, n (%) | ||||
| OAD class prior to cohort entry date | ||||
| None | 8 (3) | 5 (2) | 19 (4) | 8 (3) |
| MET + SU | 147 (49) | 124 (54) | 273 (58) | 122 (53) |
| SU | 30 (10) | 22 (10) | 48 (10) | 22 (10) |
| MET | 31 (10) | 22 (10) | 33 (7) | 16 (7) |
| DPP‐4i with SU and/or METb | 63 (21) | 49 (21) | 80 (17) | 50 (22) |
| Other | 22 (7) | 9 (4) | 18 (4) | 13 (6) |
| Concomitant OAD class at cohort entry date | ||||
| None | 24 (8) | 15 (6) | 35 (7) | 15 (6) |
| MET + SU | 135 (45) | 126 (55) | 258 (55) | 126 (55) |
| SU | 42 (14) | 29 (13) | 65 (14) | 29 (13) |
| MET | 76 (25) | 54 (23) | 84 (18) | 54 (23) |
| DPP‐4i with SU and/or METb | 11 (4) | 5 (2) | 22 (5) | 5 (2) |
| Other | 13 (4) | 2 (1) | 7 (1) | 2 (1) |
| OAD class after 12 months | ||||
| None | 21 (7) | 14 (6) | 22 (5) | 12 (5) |
| MET + SU | 88 (29) | 69 (30) | 156 (33) | 77 (33) |
| SU | 23 (8) | 16 (7) | 34 (7) | 14 (6) |
| MET | 71 (24) | 60 (26) | 74 (16) | 47 (20) |
| DPP‐4i with SU and/or METb | 3 (1) | 1 (<0.5) | 4 (1) | 0 (0) |
| Other | 9 (3) | 4 (2) | 3 (1) | 0 (0) |
| <12 months of treatment | 86 (29) | 67 (29) | 178 (38) | 81 (35) |
| Duration of treatment with liraglutide or BOT in months, n (%) | ||||
| 3 ‐ <6 | 25 (8) | 21 (9) | 51 (11) | 29 (13) |
| 6 ‐ <12 | 61 (20) | 46 (20) | 127 (27) | 52 (23) |
| 12 ‐ <24 | 84 (28) | 58 (25) | 135 (29) | 75 (32) |
| ≥24 | 131 (44) | 106 (46) | 158 (34) | 75 (32) |
| Median (IQR) | 20.2 (10.8‐34.5) | 20.8 (10.8‐34.5) | 16.4 (9.4‐30.6) | 16.5 (9.5‐29.5) |
| Reason end of observation, n (%) | ||||
| Cessation of study drug | 180 (60) | 136 (59) | 180 (38) | 93 (40) |
| Add on of insulin/GLP‐1RA | 7 (2) | 5 (2) | 81 (17) | 40 (17) |
| End of follow‐up | ||||
| End of registration | 0 (0) | 0 (0) | 9 (2) | 6 (3) |
| Deceased | 1 (<0.5) | 0 (0) | 8 (2) | 3 (1) |
| End of study period | 113 (38) | 90 (39) | 193 (41) | 89 (39) |
Determined among patients with known value.
DPP‐4i + SU + MET, DPP‐4i + MET, DPP‐4i + SU.
Abbreviations: BOT, basal insulin supported oral therapy; BP, blood pressure; DPP‐4i, dipeptidyl peptidase‐4 (DPP‐4) inhibitors; GLP‐1RA, glucagon‐like peptide‐1 receptor agonists; HbA1c, haemoglobin A1c; HDL, high density lipoprotein cholesterol; IQR, Interquartile range; LDL, low density lipoprotein cholesterol; MET, metformin; OAD, oral anti‐diabetics; SD, standard deviation; SU, sulphonylureas; TC, total cholesterol.
At baseline, the cohorts were comparable in terms of HbA1c, weight, BMI and values of cardiovascular risk biomarkers; at initiation, 16% of the patients in the liraglutide cohort and 11% of the patients in the BOT cohort met their HbA1c target. The mean BMI was 40.0 (±5.5) kg/m2 in the liraglutide cohort and 37.7 (±4.4) kg/m2 in the BOT cohort. Blood pressure and lipid values were also similar in the two cohorts. The median (IQR) time between baseline measurements and start of treatment was 31 (10‐61) days for HbA1c and 50 (22‐110) days for BMI and weight. In both cohorts, the majority of patients were on statins and anti‐hypertensives. Metformin combined with a sulphonylurea was the most often used antidiabetic treatment prior to the cohort entry date, at the cohort entry date and even after 12 months of treatment.
The median (IQR) duration of treatment with the studied drugs (matched cohorts) was 20.8 (10.8‐34.5) months in the liraglutide cohort and 16.5 (9.5‐29.5) months in the BOT cohort. The 50% attrition rate was reached earlier for the BOT cohort in the majority of analyses. Change in study drug (cessation or addition of any insulin or GLP‐1RA therapy) was the most frequent reason for ending follow‐up (liraglutide cohort, 61%; BOT cohort, 57%). Changes in OAD drug use were allowed and were similar between liraglutide and BOT (Table 1).
3.2. Clinical effectiveness
3.2.1. HbA1c levels
Changes in HbA1c from baseline at 3, 6, 9 and 12 months (LSM) are shown in Table 2 and Figure 2. At 3 months, the mean decrease in HbA1c (based on data from 231 patients in each cohort [100%]) was 10.0 mmol/mol in the liraglutide cohort and 3.8 mmol/mol in the BOT cohort; this statistically significant difference favoured liraglutide (−6.2 mmol/mol [95% CI −8.3; −4.1]; P < .0001 [Table 2]). At 6 and 9 months, the mean HbA1c further decreased in both cohorts. At both time points, the differences remained significant in favour of liraglutide (−4.9 mmol/mol [95% CI −6.9; −2.9] and − 4.9 mmol/mol [95% CI −7.1; −2.8], respectively; P < .0001 [Figure S1]).
Table 2.
Least square mean changes from baseline in HbA1c (mmol/mol), weight (kg), and BMI (kg/m2) at 3, 6, 9, and 12 months after treatment initiation in the liraglutide and BOT cohorts
| Liraglutide | BOT | Liraglutide vs BOT | ||||
|---|---|---|---|---|---|---|
| Months after initiation | n (%) | LSM change (95% CI) | n (%) | LSM change (95% CI) | LSM difference (95% CI) | p‐value |
| HbA1c (mmol/mol) | ||||||
| 0 | 231 (100) | 0 | 231 (100) | 0 | 0 | — |
| 3 | 231 (100) | −10.0 (−11.8; −8.3) | 231 (100) | −3.8 (−5.4; −2.2) | −6.2 (−8.3; −4.1) | <0.0001 |
| 6 | 229 (99) | −13.4 (−15.0; −11.7) | 229 (99) | −8.5 (−10.0; −6.9) | −4.9 (−6.9; −2.9) | <0.0001 |
| 9 | 188 (81) | −14.1 (−15.8; −12.3) | 183 (79) | −9.1 (−10.8; −7.5) | −4.9 (−7.1; −2.8) | <0.0001 |
| 12 | 166 (72) | −12.2 (−14.1; −10.4) | 161 (70) | −8.8 (−10.6; −7.0) | −3.4 (−5.8; −1.0) | 0.0053 |
| Weight (kg) | ||||||
| 0 | 81 (100) | 0 | 81 (100) | 0 | 0 | — |
| 3 | 81 (100) | −2.9 (−4.5; −1.2) | 81 (100) | −1.2 (−2.6; 0.2) | −1.7 (−3.6; 0.2) | 0.0802 |
| 6 | 80 (99) | −3.9 (−5.4; −2.4) | 79 (98) | −1.8 (−3.1; −0.4) | −2.2 (−3.9; −0.4) | 0.0160 |
| 9 | 72 (89) | −4.6 (−6.2; −3.1) | 63 (78) | −1.7 (−3.2; −0.2) | −2.9 (−4.8; −1.0) | 0.0026 |
| 12 | 60 (74) | −6.0 (−7.7; −4.4) | 59 (73) | −1.6 (−3.1; −0.1) | −4.4 (−6.4; −2.5) | <0.0001 |
| BMI (kg/m2) | ||||||
| 0 | 83 (100) | 0 | 83 (100) | 0 | 0 | — |
| 3 | 83 (100) | −1.1 (−1.6; −0.6) | 83 (100) | −0.6 (−1.0; −0.2) | −0.4 (−1.0; 0.1) | 0.1311 |
| 6 | 82 (99) | −1.4 (−1.9; −1.0) | 81 (98) | −0.6 (−1.0; −0.2) | −0.8 (−1.3; −0.2) | 0.0051 |
| 9 | 74 (89) | −1.6 (−2.1; −1.2) | 67 (81) | −0.5 (−0.9; −0.1) | −1.1 (−1.7; −0.6) | <0.0001 |
| 12 | 63 (76) | −2.1 (−2.6; −1.6) | 57 (69) | −0.5 (−0.9; 0.0) | −1.6 (−2.2; −1.1) | <0.0001 |
Abbreviations: BMI, body mass index; BOT, basal insulin supported oral therapy; HbA1c, haemoglobin A1c; kg, kilograms; LSM, least square mean; 95% CI, 95% confidence interval.
Figure 2.
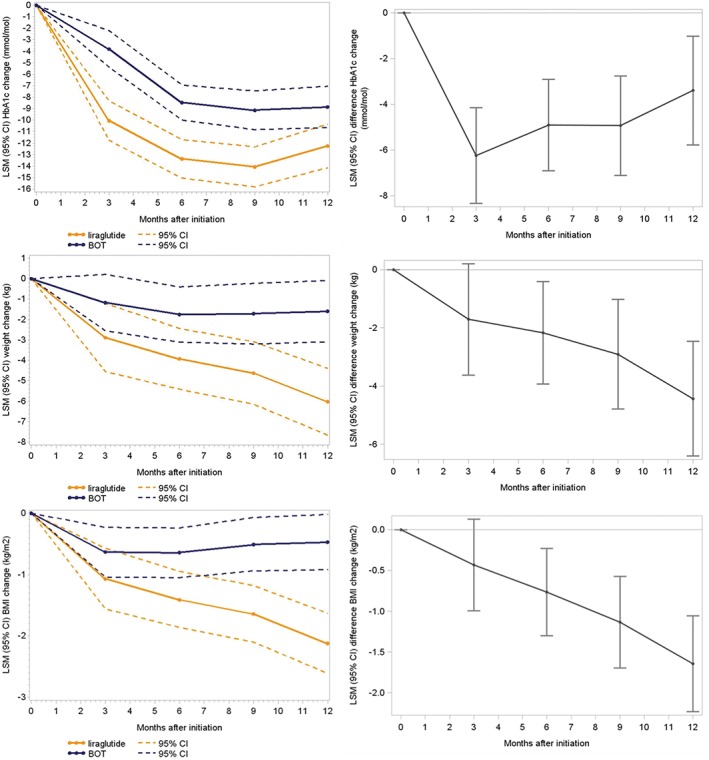
Least squares mean (LSM) changes from baseline in glycated haemoglobin (HbA1c, mmol/mol), weight (kg) and body mass index (BMI, kg/m2) at 3, 6, 9 and 12 months after treatment initiation in the liraglutide and BOT cohorts. BOT: basal insulin supported oral therapy; 95% CI, 95% confidence interval
At 12 months, with 72% (liraglutide) and 70% (BOT) of patients still being treated, the difference in HbA1c from baseline was −12.2 mmol/mol in the liraglutide cohort and − 8.8 mmol/mol in the BOT cohort (Table 2 and Figure 2). The difference between the two cohorts remained greater for liraglutide (−3.4 mmol/mol [95% CI −5.8; −1.0]; P = .0053). These HbA1c findings persisted at 15 months (the 50% attrition time point; Table S2 and Figure S2).
The proportion of patients reaching their individual HbA1c target in the liraglutide cohort and the BOT cohort increased from 16% and 11%, respectively, at baseline to 57% and 33%, respectively, at 3 months. At 12 months, the difference still existed, with 45% of the patients in the liraglutide cohort and 38% in the BOT cohort reaching their target HbA1c (Table 3).
Table 3.
Number and proportion (%) of patients reaching defined HbA1c target (≤53 mmol/mol, ≤58 mmol/mol and ≤64 mmol/mol)a at 3, 6, 9, and 12 months after treatment initiation for the unmatched and matched cohorts treated with liraglutide or BOT
| Unmatched liraglutide | Matched liraglutide | Unmatched BOT | Matched BOT | |||||
|---|---|---|---|---|---|---|---|---|
| Months after initiation | nb | n (%) at goal | nb | n (%) at goal | nb | n (%) at goal | nb | n (%) at goal |
| 0 | 301 | 43 (14) | 231 | 36 (16) | 471 | 69 (15) | 231 | 26 (11) |
| 3 | 280 | 144 (51) | 214 | 123 (57) | 429 | 167 (39) | 206 | 68 (33) |
| 6 | 194 | 97 (50) | 151 | 78 (52) | 262 | 112 (43) | 131 | 45 (34) |
| 9 | 132 | 67 (51) | 106 | 57 (54) | 161 | 71 (44) | 76 | 29 (38) |
| 12 | 83 | 38 (46) | 64 | 29 (45) | 95 | 46 (48) | 45 | 17 (38) |
HbA1c targets were ≤53 mmol/mol (≤7.0%) for patients aged <70 years, ≤58 mmol/mol (≤7.5%) for older patients with a diabetes duration <10 years, and ≤64 mmol/mol (≤8%) for all remaining patients.
Patients still on treatment during interval.
Abbreviations: BOT, basal insulin supported oral therapy; HbA1c, haemoglobin A1c.
3.2.2. Weight and BMI values
In the liraglutide cohort, mean weight declined over time, while a minimal decline was observed in the BOT cohort (Table 2 and Figure 2). The difference in weight change between the liraglutide cohort and the BOT cohort was statistically significant at 12 months (−6.0 vs −1.6 kg; P < .0001) and at 18 months (−5.3 vs −0.6 kg; P < .0001 [Table S2 and Figure S2]).
The mean change in BMI from baseline in the liraglutide cohort steadily decreased, reaching a mean reduction of −2.1 kg/m2 at 12 months (Table 2 and Figure 2). In the BOT cohort, BMI declined by −0.6 kg/m2 at 3 months with no change at subsequent time points. Consequently, the differences between the cohorts increased at each time point and reached significance at 6 (P = .0051), 9 and 12 months (P < .0001). These findings persisted at 15 months, the 50% attrition time point (Table S2 and Figure S2).
3.2.3. Cardiovascular risk biomarkers
The mean changes from baseline and mean differences in change from baseline between cohorts for several cardiovascular risk biomarkers, including SBP, DBP, total cholesterol, HDL cholesterol and LDL cholesterol, are summarized in Table S3 and Figures S3 and S4. The trends over time for SBP and DBP in both cohorts fluctuated and were not significantly different between cohorts. In both cohorts, the lipid levels changed slightly over time, with no statistically significant differences between cohorts. For all cardiovascular biomarkers, the trends persisted at the 50% attrition time point (Table S3 and Figures S3 and S4).
4. DISCUSSION
The results of the present study show that initiating liraglutide, compared with BOT, in a real‐world setting was associated with significant reductions in HbA1c and weight in obese patients with T2DM. Initiating treatment with liraglutide led to optimization of glycaemic control and weight reductions after 3 and 6 months. At 12 months, the differences in HbA1c and weight for liraglutide vs those for BOT were 3.4 mmol/mol and 4.4 kg, respectively. These findings are consistent with clinical evidence from several RCTs23 and real‐world observational studies previously reported for liraglutide.24
To our knowledge, this study comparing the effectiveness of liraglutide and BOT in two propensity score‐matched T2DM cohorts of obese patients is the first of its kind. Only in the early pilot phase of the INITIATOR study was a real‐world comparison made between liraglutide and insulin glargine in a cohort of patients with T2DM.25 That study showed no difference in HbA1c between liraglutide and insulin glargine (weight was not captured) after 9 months of treatment; however, matching was not applied, resulting in significant baseline differences between the study groups.25 In the present study, 70 patients were lost in the primary outcome analysis because of a lack of overlap in matching criteria, indicating that the liraglutide and BOT populations were indeed very different, and matching was imperative for comparison between cohorts.
Nearly 50% of the patients on liraglutide maintained the HbA1c goal levels at 12 months. This sustained optimization of the HbA1c levels was accompanied by a significant decrease in BMI values towards the end of the first year after treatment initiation. These results are in line with other similar long‐term findings from clinical and real‐world studies, showing that liraglutide therapy provides sustained glycaemic control and significant weight loss in patients with T2DM; these two beneficial effects seem to be more pronounced with liraglutide than with other GLP‐1RAs.24, 26 It should also be mentioned that weight changes in the order of a 5% loss lead to decreased insulin resistance and improved glycaemic levels.23
In the present real‐world study, small changes in cardiovascular risk biomarkers, such as blood pressure or lipids, were found, with non‐significant differences between patients on liraglutide and BOT. The observed mean changes vs baseline for SBP fluctuated over time but were very small, in line with the results from clinical trials. For example, data from a pooled analysis of six RCTs showed a rapid and consistent change in SBP with 1.2 mg liraglutide (−2.7 mmHg vs baseline after 26 weeks),27 while in the present real‐world study, the mean change in SBP was −1.2 mmHg at 6 months. Although seemingly small and non‐significant, the changes in lipids (particularly LDL cholesterol) observed in the present study are in line with the data from RCTs showing that liraglutide significantly improves the levels of total cholesterol, LDL cholesterol, free fatty acids, and triglycerides to a small extent.23 Data from the LEADER trial show that treatment with liraglutide leads to a significant reduction in cardiovascular risk in patients with T2DM and a high risk of cardiovascular events.27
Early evidence from the United Kingdom Prospective Diabetes Study found that a 1% decrease in mean HbA1c (ie, 11 mmol/mol) was associated with a statistically significant risk reduction for heart failure, myocardial infarction and stroke.28 More recent data from population‐based studies also showed that achievement of desirable HbA1c levels within 6 months of treatment initiation or adjustment was associated with a lower risk of myocardial infarction or stroke and death in patients with T2DM.29 Another cohort study conducted in obese people with T2DM from the UK showed that adding a GLP‐1RA was associated with a greater decrease in the risk of major adverse cardiovascular events than adding insulin therapy as the third glucose‐lowering agent.30
Furthermore, decreasing cardiovascular risk, reducing weight and avoiding hypoglycaemia are the attributes of treatments that are most valued by people with T2DM.31 These aspects are of crucial importance in treatment decision‐making because their consideration may improve adherence and persistence, which are both needed to achieve the expected clinical benefits.32
The results of the present study should be interpreted in the context of several limitations. First, the study was based on data from a Dutch population sample, therefore, the findings may not be representative of inhabitants of other countries, especially taking into account the specific Dutch reimbursement restrictions (mandatory specialist prescribing, failed oral alternatives, BMI ≥35 kg/m2). Second, information on patients' T2DM history, hypoglycaemia, heart rate, comorbidities, changes in OAD co‐medications, and other factors that may determine the response to treatments were not accounted for during follow‐up or at the end the of study (Table 1). In addition, in this real‐world study, possible side effects of the therapies could not be evaluated. Databases such as the PHARMO Database Network do not provide the level of clinical detail that is available in secondary care outpatient medical records. The information available on the patients eligible for this study was therefore restricted to the type of data provided in the database. Third, database studies can establish only associations and not cause‐and‐effect relationships, although inferential analyses were performed. Fourth, propensity score matching is a well‐recognized statistical technique that allows the design and analysis of real‐world studies while mimicking some of the characteristics of an RCT. The propensity score is a balancing score: conditional on this score, the distribution of observed baseline characteristics will be similar between treated and untreated patients, for instance.33 Sample matching based on propensity scores, however, has some limitations. The number of patients in the matched final sample might be reduced substantially, and this possibility should be balanced with the need to maintain statistical power. Another drawback is that two completely unrelated factors in the model may result in a similar propensity score. Additionally, a correlation between factors in the propensity score model may have the undesired effect that differences between less predictive characteristics may actually increase. In the present study, the varying strengths of the associations of variables in the propensity model sometimes augmented differences in characteristics that were less predictive for receiving GLP‐1RAs (eg, weight was much stronger than age, but age was associated with weight). Further refinement of the matching procedures to reduce these differences resulted in fewer matched patients and thus a lack of power; therefore, these remaining differences in variable distributions were permitted and further adjusted for in the comparative analyses models. Finally, it was assumed that patients took their medicines as dispensed and followed medical recommendations on dosing and frequency. The effect of poor adherence to treatments was not evaluated, which may have affected the outcome measures.
Nevertheless, the study relied on an updated, large and comprehensive database and used a mixed model that allowed longitudinal follow‐up despite intervals with missing outcome information. Observational studies complement clinical trials and provide a valuable research tool for assessing the effectiveness of treatments because these studies account for clinical practice variability and patient diversity in a real‐world setting. Results such as those obtained in the present study could be a relevant and useful source of information for clinicians and payers when updating current clinical guidelines, which require consideration of real‐world evidence and the multifactorial nature of diabetes. The availability of real‐world data in the PHARMO Database Network and other databases also opens up opportunities for further studies, including those with a longer follow‐up time, and the potential to link clinical outcomes with direct healthcare resource use.
In conclusion, the present real‐world evidence study is the first to demonstrate the clinical effectiveness of adding liraglutide vs BOT to existing OAD therapy in two matched cohorts of obese people with T2DM. The results confirmed that intensification with liraglutide was associated with a significant reduction in HbA1c levels compared with those with BOT over a period of 12 months after treatment initiation. In addition, compared with BOT treatment, treatment with liraglutide also led to significant weight and BMI reductions over time. In both cohorts, the fluctuations in SBP, DBP and lipids were small, and no differences were observed between the cohorts. The results of the present study confirm previously reported clinical findings from RCTs of liraglutide. This study provides important insights into the long‐term clinical effectiveness of initiating liraglutide vs BOT in obese people with T2DM in a real‐world setting.
Supporting information
Table S1. Variables and the corresponding categories applied in the propensity score to calculate the probability of receiving liraglutide.
Table S2. Least square mean changes from baseline and least square mean differences for HbA1c (mmol/mol), weight (kg) and BMI (kg/m2) at 15 and 18 months (≥50% attrition) after treatment initiation in the liraglutide and the basal insulin only cohorts.
Table S3. Least square mean changes from baseline and least square mean differences in cardiovascular risk biomarkers at 3, 6, 9, 12, 15, and 18 months (≥50% attrition) after treatment initiation in the liraglutide and the basal insulin only cohorts.
Figure S1. Logit of propensity score distribution prior to (a) and after (b) matching for HbA1c, for BMI and for weight. Footnotes: BMI: Body Mass Index; BOT: basal insulin‐only; HbA1c: haemoglobin A1c; kg: kilograms; LSM: least square mean; 95% CI: 95% confidence interval
Figure S2. Least square mean changes from baseline and least square mean differences in HbA1c (mmol/mol), weight (kg), and BMI (kg/m2) at 3, 6, 9, and 12 months and at the ≥50% attrition time point after treatment initiation in the liraglutide and basal insulin‐only cohorts. Figure S2. Footnotes: BMI: Body Mass Index; BOT: basal insulin‐only; HbA1c: haemoglobin A1c; kg: kilograms; LSM: least square mean; 95% CI: 95% confidence interval
Figure S3 Least square mean changes from baseline and least square mean differences in SBP and DBP (mmHg) at 3, 6, 9, and 12 months and at the ≥50% attrition time point after treatment initiation in the liraglutide and basal insulin‐only cohorts. Figure S3 Footnotes: ≥50% attrition time point was 12 months for diastolic blood pressure BOT: basal insulin‐only; DBP: diastolic blood pressure; LSM: least square mean; mmHg: millimetre of mercury; SBP: systolic blood pressure; 95% CI: 95% confidence interval
Figure S4 Least square mean changes from baseline and least square mean differences in total, LDL and HDL cholesterol (mmol/L) at 3, 6, 9, and 12 months and at the ≥50% attrition time point after treatment initiation in the liraglutide and basal insulin‐only cohorts. Footnotes: BOT: basal insulin‐only; HDL: high density lipoprotein cholesterol; l: litre; LDL: low density lipoprotein cholesterol; LSM: least square mean; TC: total cholesterol; 95% CI: 95% confidence interval
ACKNOWLEDGMENTS
The authors thank all the healthcare providers that contributed information to the PHARMO Database Network. The authors also thank Silvia Paz Ruiz MD MMedSci (Terminal 4 Communications) for providing medical writing support, proofreading, and editing in accordance with the Good Publication Practice (GPP3) guidelines (http://www.ismpp.org/gpp3).
Conflict of interest
J.A.O., E.M.H., F.J.A.P. and R.M.C.H. are employees of the PHARMO Institute for Drug Outcomes Research. This independent research institute performs financially supported studies for government and related healthcare authorities, as well as for several pharmaceutical companies. E.L.H. and A.W.D. are employees of Novo Nordisk. C.K.T. is an employee of Novo Nordisk and owns stocks in Novo Nordisk A/S.
Author contributions
All authors were involved in the design of the study: J.A.O. and E.M.H. performed the analyses; C.K.T., E.L.H. and A.W.D. reviewed data; all authors critically reviewed the manuscript.
Overbeek JA, Heintjes EM, Huisman EL, et al. Clinical effectiveness of liraglutide vs basal insulin in a real‐world setting: Evidence of improved glycaemic and weight control in obese people with type 2 diabetes. Diabetes Obes Metab. 2018;20:2093–2102. 10.1111/dom.13335
Funding information This study, including manuscript development, was financially supported by Novo Nordisk. The authors were allowed to conduct the study and write the manuscript independently of Novo Nordisk.
REFERENCES
- 1. Tamayo T, Rosenbauer J, Wild SH, et al. Diabetes in Europe: an update. Diabetes Res Clin Pract. 2014;103(2):206‐217. 10.1016/j.diabres.2013.11.007. [DOI] [PubMed] [Google Scholar]
- 2. Susan van D, Beulens JWJ, Yvonne T, van der S, Grobbee DE, Nealb B. The global burden of diabetes and its complications: an emerging pandemic. Eur J Cardiovasc Prev Rehabil. 2010;17(suppl 1):s3‐s8. 10.1097/01.hjr.0000368191.86614.5a. [DOI] [PubMed] [Google Scholar]
- 3. Eeg‐Olofsson K, Cederholm J, Nilsson PM, et al. Risk of cardiovascular disease and mortality in overweight and obese patients with type 2 diabetes: an observational study in 13,087 patients. Diabetologia. 2009;52(1):65‐73. 10.1007/s00125-008-1190-x. [DOI] [PubMed] [Google Scholar]
- 4. Liu XM, Liu YJ, Zhan J, He QQ. Overweight, obesity and risk of all‐cause and cardiovascular mortality in patients with type 2 diabetes mellitus: a dose‐response meta‐analysis of prospective cohort studies. Eur J Epidemiol. 2015;30(1):35‐45. 10.1007/s10654-014-9973-5. [DOI] [PubMed] [Google Scholar]
- 5. Summers RH, Moore M, Byrne J, et al. Perceptions of weight, diabetes and willingness to participate in randomised controlled trials of bariatric surgery for patients with type 2 diabetes mellitus and body mass index 30‐39.9 kg/m(2). Obes Surg. 2015;25(6):1039‐1046. 10.1007/s11695-014-1479-4. [DOI] [PubMed] [Google Scholar]
- 6. Petersen M. Economic costs of diabetes in the U.S. in 2012. Diabetes Care. 2016;39(7):1033‐1046. 10.2337/dc12-2625. [DOI] [PMC free article] [PubMed] [Google Scholar]
- 7. Dimitrova M, Doneva M, Valov V, et al. Cost of hospitalizations due to microvascular and macrovascular complications in type 1 and type 2 diabetic patients in Bulgaria. Biotechnol Biotechnol Equip. 2015;29(4):805‐813. 10.1080/13102818.2015.1042912. [DOI] [Google Scholar]
- 8. Domeikienė A, Vaivadaitė J, Ivanauskienė R, Padaiga Ž. Direct cost of patients with type 2 diabetes mellitus healthcare and its complications in Lithuania. Medicina (Kaunas). 2014;50(1):54‐60. 10.1016/j.medici.2014.05.007. [DOI] [PubMed] [Google Scholar]
- 9. Peters ML, Huisman EL, Schoonen M, Wolffenbuttel BHR. The current total economic burden of diabetes mellitus in the Netherlands. Neth J Med. 2017;75(7):281‐297. [PubMed] [Google Scholar]
- 10. Inzucchi SE, Bergenstal RM, Buse JB, et al. Management of hyperglycaemia in type 2 diabetes: a patient‐centered approach. Position statement of the American Diabetes Association (ADA) and the European Association for The Study of Diabetes (EASD). Diabetologia. 2012;55(6):1577‐1596. 10.1007/s00125-012-2534-0. [DOI] [PubMed] [Google Scholar]
- 11. Inzucchi SE, Bergenstal RM, Buse JB, et al. Management of hyperglycaemia in type 2 diabetes, 2015: a patient‐centred approach. Update to a Position Statement of the American Diabetes Association and the European Association for the Study of Diabetes. Diabetologia. 2015;58(3):429‐442. 10.1007/s00125-014-3460-0. [DOI] [PubMed] [Google Scholar]
- 12. Han TS, Lean ME. A clinical perspective of obesity, metabolic syndrome and cardiovascular disease. JRSM Cardiovasc Dis. 2016;5:204800401663337. 10.1177/2048004016633371. [DOI] [PMC free article] [PubMed] [Google Scholar]
- 13. Yandrapalli S, Aronow WS, Saraiva FK, et al. Prevalence of obesity in type 2 diabetes in secondary care: association with cardiovascular risk factors. Diabetes Care. 2015;9(3):753‐767. 10.1007/s00592-013-0460-3. [DOI] [Google Scholar]
- 14. Martyn‐Nemeth P, Schwarz Farabi S, Mihailescu D, Nemeth J, Quinn L. Fear of hypoglycemia in adults with type 1 diabetes: impact of therapeutic advances and strategies for prevention ‐ A review. J Diabetes Complications. 2016;30(1):167‐177. 10.1016/j.jdiacomp.2015.09.003. [DOI] [PubMed] [Google Scholar]
- 15. Marrett E, Stargardt T, Mavros P, Alexander CM. Patient‐reported outcomes in a survey of patients treated with oral antihyperglycaemic medications: associations with hypoglycaemia and weight gain. Diabetes Obes Metab. 2009;11(12):1138‐1144. 10.1111/j.1463-1326.2009.01123.x. [DOI] [PubMed] [Google Scholar]
- 16. Monami M, Dicembrini I, Kundisova L, Zannoni S, Nreu B, Mannucci E. A meta‐analysis of the hypoglycaemic risk in randomized controlled trials with sulphonylureas in patients with type 2 diabetes. Diabetes Obes Metab. 2014;16:833‐840. [DOI] [PubMed] [Google Scholar]
- 17. Abd El Aziz MS, Kahle M, Meier JJ, Nauck M. A meta‐analysis comparing clinical effects of short‐ or long‐acting GLP‐1 receptor agonists versus insulin treatment from head‐to‐head studies in type 2 diabetic patients. Diabetes Obes Metab. 2017;19(2):216‐227. 10.1111/dom.12804. [DOI] [PubMed] [Google Scholar]
- 18. Fadini GP, Zatti G, Consoli A, Bonora E, Sesti G, Avogaro A. Rationale and design of the DARWIN‐T2D (DApagliflozin Real World evIdeNce in Type 2 Diabetes). A multicenter retrospective nationwide Italian study and crowdsourcing opportunity. Nutr Metab Cardiovasc Dis. 2017;27:1089‐1097. 10.1016/j.numecd.2017.08.001. [DOI] [PubMed] [Google Scholar]
- 19. PHARMO Institute for Drug Outcomes Research . http://www.pharmo.nl. 2015. Accessed November 16, 2017.
- 20. Rutten GEHM, De Grauw WJC, Nijpels G, et al. NHG‐standaard diabetes mellitus type 2 (Derde herziening). Huisarts Wet. 2013;56:512‐525. [Google Scholar]
- 21. Klein S, Sheard NF, Pi‐Sunyer X, et al. Weight management through lifestyle modification for the prevention and management of type 2 diabetes: rationale and strategies. A statement of the American Diabetes Association, the North American Association for the Study of Obesity, and the American Society for Clinical Nutrition. Am J Clin Nutr. 2004;80(2):257‐263. [DOI] [PubMed] [Google Scholar]
- 22. Ashbeck EL, Bell ML. Single time point comparisons in longitudinal randomized controlled trials: power and bias in the presence of missing data. BMC Med Res Methodol. 2016;16(43). [DOI] [PMC free article] [PubMed] [Google Scholar]
- 23. Rigato M, Fadini GP. Comparative effectiveness of liraglutide in the treatment of type 2 diabetes. Diabetes, Metab Syndr Obes Targets Ther. 2014;7:107‐120. 10.2147/DMSO.S37644. [DOI] [PMC free article] [PubMed] [Google Scholar]
- 24. Ostawal A, Mocevic E, Kragh N, Xu W. Clinical effectiveness of Liraglutide in type 2 diabetes treatment in the real‐world setting: a systematic literature review. Diabetes Ther. 2016;7(3):411‐438. 10.1007/s13300-016-0180-0. [DOI] [PMC free article] [PubMed] [Google Scholar]
- 25. Thayer S, Wei W, Buysman E, et al. The INITIATOR study: pilot data on real‐world clinical and economic outcomes in us patients with type 2 diabetes initiating injectable therapy. Adv Ther. 2013;30(12):1128‐1140. 10.1007/s12325-013-0074-8. [DOI] [PMC free article] [PubMed] [Google Scholar]
- 26. Trujillo JM, Nuffer W, Ellis SL. GLP‐1 receptor agonists: a review of head‐to‐head clinical studies. Ther Adv Endocrinol Metab. 2015;6(1):19‐28. 10.1177/2042018814559725. [DOI] [PMC free article] [PubMed] [Google Scholar]
- 27. Fonseca V, DeVries J, Henry R, Donsmark M, Thomsen H, Plutzky J. Reductions in systolic blood pressure with liraglutide in patients with type 2 diabetes: Insights from a patient‐level pooled analysis of six randomized clinical trials. J Diabet Complications. 2014;28(3):399‐405. 10.1016/j.jdiacomp.2014.01.009. [DOI] [PMC free article] [PubMed] [Google Scholar]
- 28. Stratton IM. Association of glycaemia with macrovascular and microvascular complications of type 2 diabetes (UKPDS 35): prospective observational study. BMJ. 2000;321(7258):405‐412. 10.1136/bmj.321.7258.405. [DOI] [PMC free article] [PubMed] [Google Scholar]
- 29. Svensson E, Baggesen LM, Johnsen SP, et al. Early glycemic control and magnitude of HbA1c reduction predict cardiovascular events and mortality: population‐based cohort study of 24,752 metformin initiators. Diabetes Care 2017;40:800‐807. 10.2337/dc16-2271. [DOI] [PubMed] [Google Scholar]
- 30. Anyanwagu U, Mamza J, Mehta R, Donnelly R II. Cardiovascular events and all‐cause mortality with insulin versus glucagon‐like peptide‐1 analogue in type 2 diabetes. Heart. 2016;102(19):1581‐1587. 10.1136/heartjnl-2015-309164. [DOI] [PubMed] [Google Scholar]
- 31. Morillas C, Feliciano R, Catalina PF, et al. Patients' and physicians' preferences for type 2 diabetes mellitus treatments in Spain and Portugal: a discrete choice experiment. Patient Prefer Adherence. 2015;9:1443‐1458. 10.2147/PPA.S88022. [DOI] [PMC free article] [PubMed] [Google Scholar]
- 32. Buysman EK, Liu F, Hammer M, Langer J. Impact of medication adherence and persistence on clinical and economic outcomes in patients with type 2 diabetes treated with Liraglutide: a retrospective cohort study. Adv Ther. 2015;32(4):341‐355. 10.1007/s12325-015-0199-z. [DOI] [PMC free article] [PubMed] [Google Scholar]
- 33. Austin PC. An introduction to propensity score methods for reducing the effects of confounding in observational studies. Multivariate Behav Res. 2011;46(3):399‐424. 10.1080/00273171.2011.568786. [DOI] [PMC free article] [PubMed] [Google Scholar]
Associated Data
This section collects any data citations, data availability statements, or supplementary materials included in this article.
Supplementary Materials
Table S1. Variables and the corresponding categories applied in the propensity score to calculate the probability of receiving liraglutide.
Table S2. Least square mean changes from baseline and least square mean differences for HbA1c (mmol/mol), weight (kg) and BMI (kg/m2) at 15 and 18 months (≥50% attrition) after treatment initiation in the liraglutide and the basal insulin only cohorts.
Table S3. Least square mean changes from baseline and least square mean differences in cardiovascular risk biomarkers at 3, 6, 9, 12, 15, and 18 months (≥50% attrition) after treatment initiation in the liraglutide and the basal insulin only cohorts.
Figure S1. Logit of propensity score distribution prior to (a) and after (b) matching for HbA1c, for BMI and for weight. Footnotes: BMI: Body Mass Index; BOT: basal insulin‐only; HbA1c: haemoglobin A1c; kg: kilograms; LSM: least square mean; 95% CI: 95% confidence interval
Figure S2. Least square mean changes from baseline and least square mean differences in HbA1c (mmol/mol), weight (kg), and BMI (kg/m2) at 3, 6, 9, and 12 months and at the ≥50% attrition time point after treatment initiation in the liraglutide and basal insulin‐only cohorts. Figure S2. Footnotes: BMI: Body Mass Index; BOT: basal insulin‐only; HbA1c: haemoglobin A1c; kg: kilograms; LSM: least square mean; 95% CI: 95% confidence interval
Figure S3 Least square mean changes from baseline and least square mean differences in SBP and DBP (mmHg) at 3, 6, 9, and 12 months and at the ≥50% attrition time point after treatment initiation in the liraglutide and basal insulin‐only cohorts. Figure S3 Footnotes: ≥50% attrition time point was 12 months for diastolic blood pressure BOT: basal insulin‐only; DBP: diastolic blood pressure; LSM: least square mean; mmHg: millimetre of mercury; SBP: systolic blood pressure; 95% CI: 95% confidence interval
Figure S4 Least square mean changes from baseline and least square mean differences in total, LDL and HDL cholesterol (mmol/L) at 3, 6, 9, and 12 months and at the ≥50% attrition time point after treatment initiation in the liraglutide and basal insulin‐only cohorts. Footnotes: BOT: basal insulin‐only; HDL: high density lipoprotein cholesterol; l: litre; LDL: low density lipoprotein cholesterol; LSM: least square mean; TC: total cholesterol; 95% CI: 95% confidence interval