Abstract
A numerical model for the adhesion of osteoblasts on titanium micropillar structures is suggested, and a function representing the concentration level of the adhesion on the pillars is constructed based on experimental observation. The introduction of this function helps a well‐known bio‐chemo‐mechanical model to better predict the formation of actin in osteoblasts when they are laid on arrays of titanium micro‐pillars of various size attached to silicon substrate. A parameter study suggests that each pillar is associated with a different pattern of adhesion. Our finding emphasises a capability of the bio‐chemo‐mechanical model that it can well explain the strong influence of the boundary condition on the formation of actin within the cells.
Keywords: actin distribution, bio‐chemo‐mechanical model, computational modelling, osteoblasts‐substrate interaction
1. INTRODUCTION
Knowledge about the interaction between bone cells and their surrounding biomaterials is essential for the improvement in quality of an implant. Numerous experiments have been done to measure mechanical interactions between cells and the underlying substrates. Well‐known methods include those introduced by Harris et al,1 Burton and Taylor,2 and Balaban et al.3 A more efficient method was introduced by Tan et al,4 in which cells are laid on a bed of microneedles so that forces exerted by cells can be measured from the individual displacements of the needles. This method was widely applied and adapted to achieve further understanding on behaviour of the cells. For example, Sniadecki et al5 used magnetic and nonmagnetic posts to apply external forces and monitor traction forces. Matschegewski et al6 investigated the difference in actin cytoskeleton organization of bone cells when they are laid on a planar surface and cubic micropillar structures of different dimensions, respectively.
Besides experiments, numerical modelling has been a good approach to understand mechanisms of the mechanical interaction between cells and the underlying substrate. Several numerical models with different complexities have been developed to simulate the contractility of cells and the organisation of the stress fibres. Examples of existing models are those introduced by Storm et al,7 Satcher and Dewey,8 Mohrdieck et al,9 Nelson et al10 and Sanz‐Herrera et al.11 These models are either passive models, where the cell contractility is not included, or active models—yet neglecting the biochemical cause of the active cell response.
The bio‐chemo‐mechanical (BCM) model proposed by Deshpande et al12 is known as being advantageous compared with other numerical models, as it includes the biochemical processes and can efficiently explain many effects such as the strong dependence of the forces generated by the cells on the substrate compliance as well as the influence of boundary conditions on the orientation and formation of stress fibres. This model was inspired by the experiments of Tan et al,4 where smooth muscle cells were laid on beds of microneedles, and was developed based closely on experimental observations. According to Deshpande et al,13 their model was motivated by several key biochemical processes. One of the involved processes is the activation of myosin II. When a phosphorylation occurs, possibly by light‐chain kinase or by Rho‐kinase, the myosin II tends to take the active extended state. The extended myosins associate to form bipolar filaments, which later enter between the actin filaments bundled together by α actinin to form contractile stress fibres.13
By addressing the biochemical processes, the BCM model is more realistic compared with passive models. Moreover, a full interpretation of experimental data on forces generated by living cells can only be obtained in appropriate constitutive models, where the active response of cells is included.13 Because of its efficiency, the BCM model has been widely applied in modelling the contractile response and actin distribution in cells of different types. McGarry et al14 used this model to simulate the behaviour of smooth muscle cells and other cell lines, such as fibroblasts, on beds of microposts. Together with a biochemical model for focal adhesion,15 this model has been used to simulate the concentration of actin in the cell and of integrins at the contact regions.(16, 17) An application to a 3‐dimensional cell structure was done by Dowling et al. 18
The aim of this paper is to apply the BCM model to predict the tendency for the concentration of actin in osteoblasts observed in the experiments of Matschegewski et al,6 where they were laid on arrays of regular titanium pillars attached to silicon substrates. It is revealed from the experimental results that for osteoblasts, actin was distributed in short fibres on the titanium pillar structure, while in the experiments of Tan et al4 for smooth muscle cells, actin was found as long fibres distributed intensely around the pillars. Therefore, simply applying the approach of McGarry et al,14 which was derived for smooth muscle cells, will not be feasible. We will propose a set of parameters and a hypothesis for inhomogeneous adhesion and show that the BCM model can really help predict the tendency of the osteoblast actin distribution.
2. THE MODEL
2.1. The BCM model
The BCM model12 is defined for a single stress fibre and is described by 3 equations. First, by ignoring the details of the signalling processes, a simple exponential function is used to represent the time dependency of the level of an external signal C. Here, θ is the decay constant of a chemical compound; t is the time measured from the instant of the most recent signal. Second, a nondimensional activation level η∈[0,1] is introduced to describe the remodelling of actin cytoskeleton under external stress. Based on experimental observations, the equation for evolution of η is established as
| (1) |
where the term expresses the rate of stress‐fibre‐formation dependent on the signal C and is controlled by the constant . Similarly, the second term on the right‐hand side is a non‐negative number that expresses the rate of stress fibre dissociation, which depends on the current tension relative to the isometric tension σ 0 and is controlled by the constant . Here, σ 0 is the maximum tension allowed in the stress fibre corresponding to the activation level η and is given as σ 0=η σ max, where σ max is the maximum tension at η=1, that is, when the stress fibre is fully activated. Finally, a linearised Hill equation19 is used to describe the relationship between tension σ and the lengthening/shortening strain rate as
| (2) |
where is the fractional reduction in fibre stress upon increasing the shortening rate relative to . This linearised relation is described in Han and Sniadecki20 and Rodriguez et al.21 When the cells are considered as continuous medium, the theory of continuum mechanics can be used, and the BCM model is included by introducing an active stress tensor so that the total stress in the cell is obtained as
| (3) |
where S passive is the passive stress due to the cell material and depends on the material model used. For example, when it is assumed that the cell behaviour is linearly elastic and the deformation can be large, then S passive becomes the second Piola‐Kirchhoff stress tensor and is related to the Green‐Lagrange strain tensor E by , where is the stiffness tensor and the colon (:) denotes the double contraction of the 2 tensors. To obtain the active stress S active, first, the possible directions for stress fibres at each point in the cell need to be defined. In 2‐dimensional analysis, the stress fibres are assumed to be able to form uniformly in all directions. Each direction is determined by the angle φ between the fibre and the e 1 axis. The unit vector for this direction is . The strain rate in Equation 2 of the stress fibre in the direction is calculated from the material strain rate as
| (4) |
Because of symmetry, the components of the average active stress tensor in Cartesian coordinates are obtained as
| (5) |
where σ is the tension in the stress fibre (in Equation 2). The active stress tensor is written as
| (6) |
In finite element analysis, the above integral can only be calculated numerically. Deshpande et al13 suggested that a large number N d directions for stress fibres should be defined by spacing equally N d angles φ∈[−π/2,π/2] and the trapezoidal rule over these sampling points can be used to obtain the integrals. We have introduced an alternative approach, where a quadratic function is used to approximate the activation level, and obtained similar results while a significant improvement in computing time is achieved.22
2.2. Measure for actin distribution
When the activation level in the cell is obtained, there is a measure that is shown by McGarry et al14 to be corresponding to the patterns of actin distribution. This measure is defined as
| (7) |
where η max is the maximum activation and is the average activation in all directions. For 2D analysis, is written as and is also computed numerically.
2.3. Inhomogeneous cell adhesion
It revealed from the experiments of Matschegewski et al6 that cell adhesion was not completely uniform in the contact region between the cell and the top of the pillars. The adherence was nearly homogeneous, but spot adherence existed on top of the pillars. To model this inhomogeneity of the adhesion, we used a scaling function g(x,y), whose value is in the range [0,1], to represent the concentration level of the adhesion on a single pillar. The value 1 is assigned to the regions where spot adherence occurs, while the zero value indicates the disappearance of the adhesion. The pillars are assumed to have square shape with blunt corners, which are close to those used in the experiments of Matschegewski et al.6 For simplicity and from the observation that spot adherence usually appeared near the periphery of the pillars, especially the corners, we constructed a smooth function that holds a small value everywhere except for the regions near the 4 corners of the pillar. The left part of Figure 1 displays a possible choice for our function, while the right figure shows the 1D plot of a slice through 2 spots. With s being the side of the pillar and we denote
| (8) |
the expression for the adhesion level that we used is
| (9) |
for (x,y)∈[0,s]×[0,s] representing a point on the pillar structure. The values of the function g are in the range [0.1,1]. This is equivalent to the assumption that the adhesion at the peak points is 10 times stronger than that at those points where the strength of adhesion is lowest. When desired, the function can easily be adjusted to meet other assumptions. The simple adhesion model in McGarry et al14 is then modified so that the traction in the cell at the contact region becomes
| (10) |
where k t is the shear stiffness constant of the adhesion, when the cell moves a distance Δi from the pillar.
Figure 1.
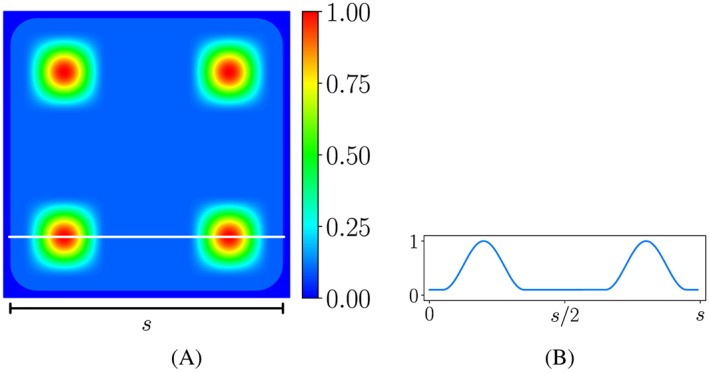
Plot of an exemplary function for the concentration level of the adhesion on a single pillar and plot of a slice through 2 spots. Outside of the pillar, the function vanishes. Maximal function values are reached near the 4 corners of the pillar
Our successful formulation for the inhomogeneous adhesion between cells and the substrate leads to several possible extensions and applications of the model. First, besides in vitro experiments, in silico simulation can be performed to investigate the dependency of the patterns of actin in osteoblasts on the geometry of each pillar and of the pillar array. Second, a framework for the dynamics of focal adhesion can be developed. Such framework already exists in literature, for example, the work of Deshpande et al15 that based on thermodynamic equilibrium of the integrins. However, the appearance of adhesion spots as in the experiments of Matschegewski et al6 cannot be captured. Our formulation provides an insight for the improvement of such model and the achievement of a complete model that can simultaneously characterise the development of the focal adhesions and the formation of stress fibres in cells of different types. Finally, the appropriateness of the BCM model in modelling the actin formation in osteoblasts is confirmed. With the set of parameters we obtained, the model can be used to numerically study the behaviour of osteoblasts in other experimental set‐ups. For example, the study of the dynamics of traction forces in osteoblasts under effects of exposure to external electric fields, which has been studied experimentally by Curtze et al,23 can be performed.
3. RESULTS AND DISCUSSION
We apply the BCM model together with our suggested model for the adhesion of the cell to the pillar structure to simulate the actin distribution of osteoblasts on titanium arrays of different dimensions. The parameters for the BCM model, the material properties of the pillars, and the passive mechanical material properties of the cell are shown in Table 1. The values for , and are the same as those in McGarry et al.14 From experimental observation, we know that osteoblasts generate a very small contraction force. Thus, the values that we used for σ max and are 0.15 [nM/μ m 2] and 10−5[s −1], respectively, are much smaller than the values in McGarry et al.14 At the regions where the cell is in contact with the pillars, the value k t=500 nM/μ m 3 is used for the focal adhesion stiffness, which is also the same as that in McGarry et al,14 and Equation 10 is used for the shear traction.
Table 1.
Parameters for the BCM model, material properties of the pillars, and passive mechanical properties of the cell
| Parameter | Value | Description | |
|---|---|---|---|
|
|
0.15 [nM/μ m 2] | maximum fibre tension | |
| θ | 70 [s] | Decay constant of signal | |
|
|
7 | Tension reduction coefficient with respect to strain rate | |
|
|
10 | Formation rate constant | |
|
|
1 | Dissociation rate constant | |
|
|
10−5[s −1] | Initial fibre contraction rate | |
| k t | 500 [nN/μ m 3] | Focal adhesion stiffness | |
| E cell | 0.4 [nN/μ m 2] | Young modulus of the cells | |
| ν cell | 0.3 | Poisson ratio of the cells | |
| E pillar | 1.0·103 [nN/μ m 2] | Young modulus of the pillars | |
| ν pillar | 0.35 | Poisson ratio of the pillars |
The system of governing equations, which includes the equilibrium condition and Equation 1, is solved using finite element analysis. Since almost no deflection of the pillars was found in the experiments, the usual approach is considering the pillars as rigid bodies and applying a homogeneous Dirichlet boundary condition. Here, we used the approach in McGarry et al14 and modelled the pillars as rounded rectangular surfaces connected to springs of a large stiffness. This relaxation allows the stability of the solution procedure, while the obtained displacement of the pillars is small enough to be ignored. The linear elastic material model is used for both the cell and the pillars.
We used the gmsh generator24 to create the meshes and the open source framework FEniCS, version 2016.2, to compute the solution.25 For time discretisation, we used an explicit method with a maximum time step of 2 seconds and performed a convergence study to make sure that the solution is stable with our choice of time step.
To demonstrate the applicability of our model using an inhomogeneous adhesion function, we conducted the simulations for osteoblasts on arrays of square pillars of different sizes: 5μ m×5μ m and 3μ m×3μ m.For simplicity, we used the same function g(x,y)(Equation 9) for the adhesion at all pillars.
3.1. Osteoblasts on titanium coated pillars of 5 μm × 5 μm
We first apply the model to a cell patch on 26 pillars in our experiment, as shown in Figure 2A. We constructed a cell geometry with the assumption that the initial cell has straight edges between pillars and it fits perfectly to the 26‐pillar subarray depicted in Figure 2B. Moreover, we also assume that the pillars are of perfect square shape with blunt corners. The side length of the pillars is 5μ m, while the radius of the corner fillet is 0.5μ m (area ≈24.77μ m 2). The distance between 2 neighbouring pillars is also 5μ m. The height of each pillar is 5μ m, but this value is not incorporated in the model, since the pillars are represented by top surfaces connected to springs.14 We used the value 7.5nN/μ m for the spring stiffness, which is high enough for the pillar displacement to be close to zero as in the experiments.
Figure 2.
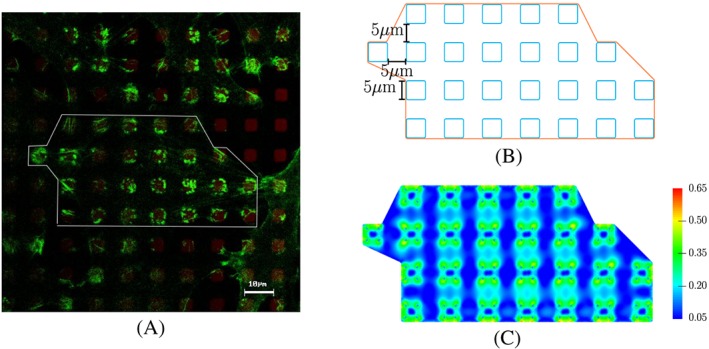
Experimental and predicted distributions of actin in osteoblasts. A, Fluorescence image of the actin filament distribution in MG‐63 osteoblasts (actin in green, LSM 780, bar 10 μ m; with courtesy of H. Rebl). The white line demonstrates a simplified form of 1 cell. The cell lies on several micropillars. B, Sketch of the patch of 1 cell used in the simulation. C, Our predicted result for actin distribution (characterised by the measure Π) using the bio‐chemo‐mechanical model and our description for the cell‐pillar adhesion
The simulation result for actin formation is shown in Figure 2C. It can be seen that on the pillars, the actin is of highest amount, and it is distributed nonuniformly. Moreover, at the longest edges of the cell, there is more actin than at other edges. The obtained maximum displacement of the pillars is around 7μ m, which is 0.14% of the side length of the pillar. Analogous outcome is achieved when we apply the model for an osteoblast on an array of 19 pillars, which is illustrated in Figure 3.
Figure 3.

Experimental and predicted distributions of actin in osteoblasts. A, Experimental result for the actin distribution of a MG‐63 osteoblast on a 5μ m×5μ m pillar array by Matschegewski et al.6 B, Sketch of the cell used in our simulation. C, Our simulation result for steady state actin distribution in this cell using our scaling function for inhomogeneous adhesion. D, Simulated steady state actin distribution when a homogeneous adhesion was used. The simulated actin distribution is characterised by the measure Π in Equation 7
It should be noted that without our adaptation of the model for the adhesion of muscle cells to the adhesion of osteoblasts involving an inhomogeneous adhesion behaviour, the result would not agree with the experiment, as the predicted actin would form around the pillars, and there would be a uniform low level of actin on the pillars (Figure 3). To further improve the agreement between the results using our approach, the complexity of the model should be increased: A more complex function g(x,y) for the adhesion should be constructed, and the function could also be different for each pillar.
3.2. Osteoblasts on titanium coated pillars of 3 μm × 3 μm
Similar steps are applied for the simulation of osteoblasts on an array of pillars of dimension 3μ m×3μ m. The radius for the rounded corners is chosen to be 0.4μ m, and the distance between 2 neighbouring pillars is 3μ m, as in the experiment in Matschegewski et al.6 As the area of the pillar is around 8.85μ m 2, which is smaller than that in the previous example, the corresponding spring stiffness is set to 2.68 nM/μ m.
The predicted actin distribution is shown in Figure 4. As in the previous case, the highest concentration of actin is located on the pillars. Since the distance between the pillars is small, a relatively high level of actin can also be found in the parts of the cell connecting the pillars. In the experiment, at some regions, the actin concentration in those parts is similar to that on the pillars.
Figure 4.
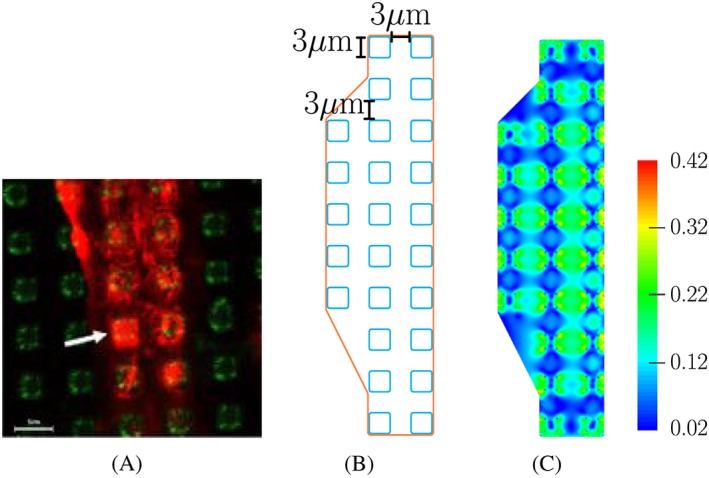
Experimental and predicted distributions of actin in osteoblasts. A, Actin formation of MG‐63 osteoblasts on 3μ m×3μ m pillar array as described by Matschegewski et al.6 B, Sketch of the cell used in our simulation. C, Our predicted actin distribution characterised by the measure Π in Equation 7
3.3. Effect of the adhesion scaling function
To study numerically the dependency of actin patterns on the adhesion between the cell and the pillars, we constructed different configurations for our adhesion scaling function. We varied the location and the area of strong adhesion near the peak points. We also used different number of peak points on each pillar. Examples of our adhesion scaling functions defined on a single pillar are shown in Figure 5.
Figure 5.

Different adhesion scaling functions for 1 single pillar. A, the strongest adhesions locate at 4 spots with a large area distributed uniformly on the pillar. B and C, peak adhesions are at 4 and 3 spots, respectively, with a small area distributed near the corners of each pillar. The functions are obtained by a slight modification of Equations 8 and 9
Using these scaling functions for the adhesion, we performed the analysis for the actin distribution of an osteoblast on an array of 19 pillars of 5μ m×5μ m×5μ m. It can be seen from the analysis results, which are shown in Figures 3 and 6, that changing the size of the peak adherence does not affect much the trend of the actin formation on the pillars. However, the small area of these peak points gives a more smooth actin distribution. Modifying the number of peak points could deliver a different pattern of actin on the pillars, where the amount of actin is affected. We also performed a simulation in which a mix of the 4 scaling functions were used. The result in Figure 7 supports our suggestion that using different scaling functions for different pillars could give a better agreement between simulation and experimental results.
Figure 6.
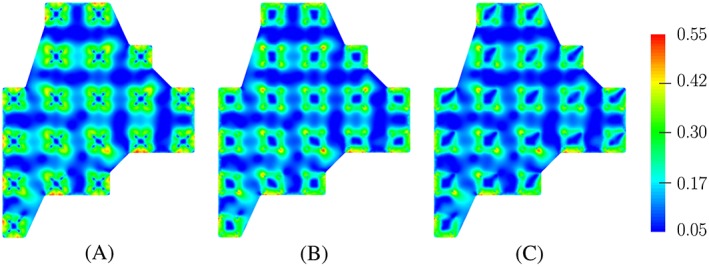
Predicted results for actin distribution of an osteoblast on an array of 19 pillars using different adhesion scaling functions. Each function is applied for all 19 pillars in every simulation
Figure 7.
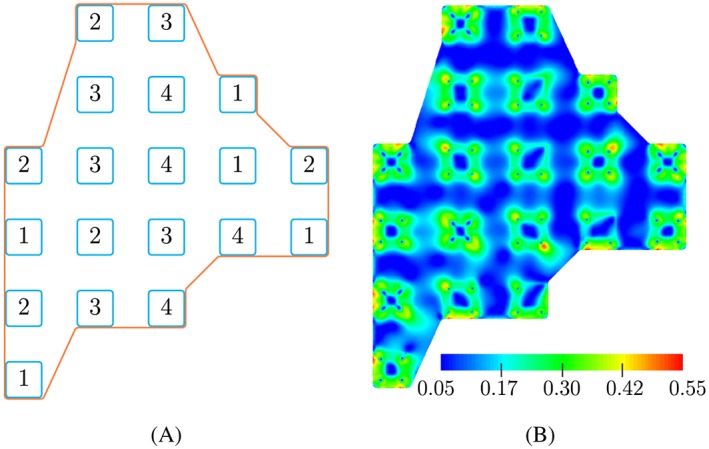
Predicted results for actin distribution of an osteoblast on an array of 19 pillars. A, Sketch of an osteoblast on 19 pillars with different adhesion patterns and B, predicted result for the actin distribution obtained in our simulation. A, 1 indicates the adhesion pattern in Figure 1A, while 2, 3, and 4 express the patterns illustrated in Figure 5A‐C, respectively
4. CONCLUSION
We have described a computational model that can predict the distribution of actin in osteoblasts when they are laid on arrays of titanium micropillars. Our model was based on the BCM model of Deshpande et al.12
The BCM model proposed by Deshpande et al12 has the capability to simulate the contractility and actin formation of biological cells when they are laid on different kinds of substrate. By including the biochemical processes, this model is more realistic than many passive models and other active models. The efficiency of this model has been shown through its applications in a great number of researches. Using this model and a simple model for the adhesion between cell and the substrate, McGarry et al14 successfully simulated the actin distribution in smooth muscle cells and fibroblasts on arrays of polydimethylsiloxane posts. Direct application of the approach of McGarry et al to the experiments with osteoblasts on titanium micropillar arrays would lead to a great disagreement between experimental and simulated results. We suggested that this disagreement was caused by the behaviour of the contact between osteoblasts and the micropillars. We proposed a mathematical model for inhomogeneous adhesion and constructed a function that represents the concentration of adhesion on a pillar: The adhesion is locally strong at a few points near the pillar corners, and it is weaker and almost homogeneous at the remaining area. We demonstrated our approach by applying it to our experiments and to previous experimental results by Matschegewski et al.6 Our finding supports the appropriateness of the BCM model and reconfirms its feature that it is able to capture the strong influence of the boundary condition on the formation of actin within the cells.
ACKNOWLEDGEMENTS
This work was supported by the German Science Foundation (DFG) in the scope of the Research Training Group GRK 1505/2 “Analysis and simulation of electrical interactions of implants with bio‐systems”—welisa. The support is gratefully acknowledged.
Truong D, Bahls CR, Nebe B, van Rienen U. Simulation of actin distribution of osteoblasts on titanium pillar arrays using a bio‐chemo‐mechanical model. Int J Numer Meth Biomed Engng. 2018;34:e3097 10.1002/cnm.3097
REFERENCES
- 1. Harris AK, Stopak D, Wild P. Fibroblast traction as a mechanism for collagen morphogenesis. Nature. 1981;290:249‐251. [DOI] [PubMed] [Google Scholar]
- 2. Burton K, Taylor DL. Traction forces of cytokinesis measured with optically modified elastic substrata. Nature. 1997;385:450. [DOI] [PubMed] [Google Scholar]
- 3. Balaban NQ, Schwarz US, Riveline D, et al. Force and focal adhesion assembly: a close relationship studied using elastic micropatterned substrates. Nature Cell Biology. 2001;3:466‐472. [DOI] [PubMed] [Google Scholar]
- 4. Tan JL, Tien J, Pirone DM, Gray DS, Bhadriraju K, Chen CS. Cells lying on a bed of microneedles: an approach to isolate mechanical force. Proc Natl Acad Sci USA. 2003;100:1484‐1489. [DOI] [PMC free article] [PubMed] [Google Scholar]
- 5. Sniadecki NJ, Anguelouch A, Yang MT, et al. Magnetic microposts as an approach to apply forces to living cells, Vol. 104; 2007:14553‐14558. [DOI] [PMC free article] [PubMed]
- 6. Matschegewski C, Staehlke S, Loeffler R, et al. Cell architecture‐cell function dependencies on titanium arrays with regular geometry. Biomaterials. 2010;31:5729‐5740. [DOI] [PubMed] [Google Scholar]
- 7. Storm C, Pastore JJ, MacKintosh FC, Lubensky TC, Janmey PA. Nonlinear elasticity in biological gels. Nature. 2005;435(7039):191‐400. [DOI] [PubMed] [Google Scholar]
- 8. Satcher RLJ, Dewey CFJ. Theoretical estimates of mechanical properties of the endothelial cell cytoskeleton. Biophys J. 1996;71(1):109‐118. [DOI] [PMC free article] [PubMed] [Google Scholar]
- 9. Mohrdieck C, Wanner A, Roos W, et al. A theoretical description of elastic pillar substrates in biophysical experiments. Chem Phys Chem. 2005;6(8):1492‐1498. [DOI] [PubMed] [Google Scholar]
- 10. Nelson CM, Jean RP, Tan JL, et al. Emergent patterns of growth controlled by multicellular form and mechanics. Proc Natl Acad Sci USA. 2005;102(33). [DOI] [PMC free article] [PubMed] [Google Scholar]
- 11. Sanz‐Herrera JA, Moreo P, Garcia‐Aznar JM, Doblare M. On the effect of substrate curvature on cell mechanics. Biomaterials. 2009;30(34):6674‐6686. [DOI] [PubMed] [Google Scholar]
- 12. Deshpande VS, McMeeking RM, Evans AG. A bio‐chemo‐mechanical model for cell contractility. Proc Natl Acad Sci USA. 2006;103:14015‐14020. [DOI] [PMC free article] [PubMed] [Google Scholar]
- 13. Deshpande VS, McMeeking RM, Evans AG. A model for the contractility of the cytoskeleton including the effects of stress‐fibre formation and dissociation. Proc R Soc A. 2007;463:787‐815. [Google Scholar]
- 14. McGarry JP, Fu J, Yang MT, et al. Simulation of the contractile response of cells on an array of micro‐posts. Proc R Soc A. 2009;367:3477‐3497. [DOI] [PMC free article] [PubMed] [Google Scholar]
- 15. Deshpande VS, Mrksich M, McMeeking RM, Evans AG. A bio‐mechanical model for coupling cell contractility with focal adhesion formation. J Mech Phys Solids. 2008;56(4):1484‐1510. [Google Scholar]
- 16. Ronan W, Deshpande VS, McMeeking RM, McGarry JP. Cellular contractility and substrate elasticity: a numerical investigation of the actin cytoskeleton and cell adhesion. Biomech Model Mechanobiol. 2014;13(2):417‐435. [DOI] [PubMed] [Google Scholar]
- 17. Pathak A, Deshpande VS, McMeeking RM, Evans AG. The simulation of stress fibre and focal adhesion development in cells on patterned substrates. J R Soc Interface. 2008;5(22):507‐524. [DOI] [PMC free article] [PubMed] [Google Scholar]
- 18. Dowling EP, Ronan W, Ofek G, et al. The effect of remodelling and contractility of the actin cytoskeleton on the shear resistance of single cells: A computational and experimental investigation. J R Soc Interface. 2012;9(77):3469‐3479. [DOI] [PMC free article] [PubMed] [Google Scholar]
- 19. Hill AV. The heat of shortening and the dynamic constants of muscle. Proc. R. Soc. B. 1938;126(843):136‐195. [Google Scholar]
- 20. Han SJ, Sniadecki NJ. Simulations of the contractile cycle in cell migration using a bio‐chemical‐mechanical model. Computer Methods in Biomechanics and Biomedical Engineering. 2011;14(5):459‐468. [DOI] [PubMed] [Google Scholar]
- 21. Rodriguez ML, McGarry PJ, Sniadecki NJ. Review on cell mechanics: experimental and modeling approaches. Appl Mech Rev. 2013;65(6):060801‐1‐060801‐41. [Google Scholar]
- 22. Bahls C, Truong D, van Rienen U. Semi‐analytical representation of the activation level in stress fibre directions as alternative to the angular representation in the bio‐chemo‐mechanical model for cell contractility. J Mech Behav Biomed Mater. 2018;77:527‐533. [DOI] [PubMed] [Google Scholar]
- 23. Curtze S, Dembo M, Miron M, Jones DB. Dynamic changes in traction forces with DC electric field in osteoblast‐like cells. J Cell Sci. 2004;117(13):2721‐2729. [DOI] [PubMed] [Google Scholar]
- 24. Geuzaine C, Remacle JF. Gmsh: A 3‐d finite element mesh generator with built‐in pre‐ and post‐processing facilities. Int J Numer Methods Eng. 2009;79(11):1309‐1331. [Google Scholar]
- 25. Logg A, Mardal KA, Wells GN, et al. Automated Solution of Differential Equations by the Finite Element Method. Springer; 2012. [Google Scholar]


