

Abstract
To evaluate the role of constitutive epigenetic changes in normal body cells of BRCA1/BRCA2‐mutation negative patients, we have developed a deep bisulfite sequencing assay targeting the promoter regions of 8 tumor suppressor (TS) genes (BRCA1, BRCA2, RAD51C, ATM, PTEN, TP53, MLH1, RB1) and the estrogene receptor gene (ESR1), which plays a role in tumor progression. We analyzed blood samples of two breast cancer (BC) cohorts with early onset (EO) and high risk (HR) for a heterozygous mutation, respectively, along with age‐matched controls. Methylation analysis of up to 50,000 individual DNA molecules per gene and sample allowed quantification of epimutations (alleles with >50% methylated CpGs), which are associated with epigenetic silencing. Compared to ESR1, which is representative for an average promoter, TS genes were characterized by a very low (< 1%) average methylation level and a very low mean epimutation rate (EMR; < 0.0001% to 0.1%). With exception of BRCA1, which showed an increased EMR in BC (0.31% vs. 0.06%), there was no significant difference between patients and controls. One of 36 HR BC patients exhibited a dramatically increased EMR (14.7%) in BRCA1, consistent with a disease‐causing epimutation. Approximately one third (15 of 44) EO BC patients exhibited increased rates of single CpG methylation errors in multiple TS genes. Both EO and HR BC patients exhibited global underexpression of blood TS genes. We propose that epigenetic abnormalities in normal body cells are indicative of disturbed mechanisms for maintaining low methylation and appropriate expression levels and may be associated with an increased BC risk.
Keywords: allele methylation error, breast cancer susceptibility gene, deep bisulfite sequencing, epimutation, early onset breast cancer, familial breast cancer, single CpG hypermethylation, tumor suppressor gene
Short abstract
What's new?
Cancer can change patterns of DNA methylation, with widespread loss of methylation but also localized increases in methylation. Here, the authors analyzed blood cells, looking for differences in methylation between breast cancer patients and healthy persons. They developed a deep bisulfite sequencing assay to specifically test the promoter regions of 8 tumor suppressor genes, plus the estrogen receptor gene, along with reduced tumor suppressor gene expression. They found that breast cancer patients showed increased methylation changes in multiple tumor suppressor genes, reduced tumor suppressor gene expression. Thus, epigenetic abnormalities could indicate disruptions in the mechanisms that maintain proper methylation, and could signal increased tumor risk.
Abbreviations
- BC
breast cancer
- CTRL
control
- DBS
deep bisulfite sequencing
- EO
early onset
- EMR
epimutation rate
- HR
high risk
- TS
tumor suppressor
Breast cancer (BC) is the most common type of cancer among women worldwide, accounting for 25% of all cancer cases. Up to 30% of BC, in particular early onset (EO) and familial BC cases, are caused by germline mutations in BRCA1, BRCA2, and other BC susceptibility genes.1 Tumorigenesis is a multistep process, involving an accumulation of genetic mutations in multiple genes.2 In addition, there is a progressive loss of global DNA methylation, causing reactivation of retrotransposons and genome instability,3 as well as regional hypermethylation and silencing of tumor suppressor (TS) genes4 that are important for DNA repair and maintaining genome integrity.5 Somatic epimutations in sporadic tumors are restricted to the tumor and its precursor cells. In contrast, constitutive epimutations are present in a proportion of normal body cells. Similar to germline genetic mutations, constitutive epimutations in TS genes may serve as the first hit (according to Knudson's model of tumor development) in these patients.6, 7, 8 The tumors of women with constitutional BRCA1 hypermethylation exhibit a BRCA1‐mutation‐like pathology.9
Previous studies have tested average TS promoter methylation in blood as a biomarker for BC risk.10, 11, 12 However, average methylation of millions of DNA molecules in a genomic DNA sample is a surrogate marker which is sometimes difficult to interpret. Methylation changes could be due to single CpG methylation errors at different positions in a large number of alleles or to a few allele methylation errors, where all or most CpGs in individual DNA molecules are aberrantly methylated. Because it is usually the density of CpG methylation in a cis‐regulatory region rather than individual CpGs that turns a gene “on” or “off,”13, 14 allele methylation errors must be considered as functionally relevant epimutations. Variable proportions (5–30%) of fully methylated BRCA1 or RAD51C alleles have been found in normal body cells of mutation‐negative patients, presenting with phenocopies of cancer syndromes.6, 7 The frequency of constitutively hypermethylated alleles of TS genes in normal healthy individuals without an increased cancer risk remains to be elucidated.
Deep bisulfite sequencing (DBS) can determine the methylation profiles of many thousand individual DNA alleles for multiple genes and samples in a single experiment and, thus, directly measure epimutation rates (EMRs). In this study, we developed a multiplex DBS assay for 8 TS genes including major BC susceptibility genes to analyze two mutation‐negative BC patient cohorts, which satisfied the inclusion criteria of the German Consortium of Hereditary Breast and Ovarian Cancer. We analyzed whole blood, which is easily accessible, to identify constitutive methylation abnormalities in normal body cells. Constitutive epimutations, which arise early in development, are present in a mosaic state in different tissues.6, 7 Although epigenomes differ between cell types, the observed methylation abnormalities of TS genes in blood are thought to be representative for other tissues of the analyzed individual. The main aim of our study was to compare constitutive epigenetic abnormalities between BC patients and controls, estimating their contribution to BC pathogenesis.
Material and Methods
Patients
This study was approved by the Ethics Committee of the Medical Faculty at Würzburg University (no. 337/15). Written informed consent to use DNA samples after completion of genetic diagnostics for research purposes was obtained from all participating women. Two cohorts of BRCA1/BRCA2‐mutation negative patients with BC were recruited through the German Consortium for Hereditary Breast and Ovarian Cancer. Cohort 1 consisted of 43 women with early‐onset (EO) BC, diagnosed before the age of 36 years; cohort 2 consisted of 36 BC patients with a high risk (HR) for a heterozygous mutation (> 95% predicted by Cyrillic). Eleven (26%) of 43 EO BC and 7 (19%) of 36 HR BC patients suffered from a tumor at the time of blood drawing. The majority of BC patients were tumor‐free after therapy. The mean (± standard deviation) tumor‐free interval at the time of blood drawing was 9.5 ± 10.0 years for the EO BC and 3.6 ± 5.8 years for the HR BC group. Eighty age‐matched women without cancer and without familial history for breast and ovarian cancer served as controls.
Deep bisulfite sequencing
Genomic DNAs were isolated from peripheral blood and bisulfite converted with the EpiTect Fast DNA Bisulfite Kit (Qiagen, Hilden, Germany). PCR and sequencing primers (Supporting Information Table S1) were designed in the promoter regions of BRCA1, BRCA2, RAD51C, ATM (region 1 and 2), PTEN, TP53 (region 1 and 2), MLH1, and RB1, and the promoter flanking region of ESR1, using the PyroMark Assay Design 2.0 software (Qiagen). Single nucleotide polymorphisms (SNPs) rs799905 (G/C, MAF 0.45 G) in BRCA1 and rs16943176 (G/A, MAF 0.16 A) in RAD51C were used to distinguish parental alleles in informative samples.
Library preparation for the MiSeq (Illumina, San Diego, USA) and sequence analysis were performed, as previously described.15 Briefly, purified PCR products were quantified with the Qubit System (Life Technologies, Carlsbad, USA), diluted to 0.2 ng/µl and combined into 48 pools, each pool containing the 11 amplicons of a given sample. After A‐tailing and adaptor ligation, indexing PCR was performed with NEBNext Multiplex Oligos for Illumina, Dual Index Primer Set 1 (New England BioLabs, Frankfurt/Main, Germany). All barcoded pools were diluted to 4 nM and pooled into the final library. Paired‐end sequencing was performed on an Illumina MiSeq using the MiSeq Reagent Kit v3 (2 × 300 cycles) cartridge.
After demultiplexing, an initial quality assessment was performed with FastQC, v0.11.2. Adapters and low quality reads were trimmed with TrimGalore, v0.4.0 powered by Cutadapt, v1.6.16 Trimmed paired reads were joined with the fastq‐join option of ea‐utils, v1.1.2–537. The reads were aligned to the human genome reference sequence hg19 UCSC with Bismark, v0.14.3 and Bowtie2, v2.2.6.17, 18 Read alignments were processed with SAMtools v1.19 Non‐bisulfite converted reads were removed from the dataset. For methylation calling, the bismark_methylation_extractor was used.20 GensearchNGS software (PhenoSystems, Wallonia, Belgium) was used for data visualization and further analysis.21 Reads with a length < 100 bp and/or < 5 CpGs were excluded.
Gene expression
RNA was isolated from whole blood samples using miRNeasy Mini Kit (Qiagen). cDNA was synthesized from 1 µg RNA with High Capacity DNA‐to‐cDNA Kit (ThermoScientific, Massachusetts, USA). RT PCR was performed with TaqMan Fast Advanced Master Mix (ThermoScientific), 50 ng cDNA per reaction, and pre‐validated TaqMan assays for BRCA1 (HS01556193_m1), BRCA2 (Hs00609073_m1), RAD51C (Hs00427442_m1), ATM (Hs00175892_m1), PTEN (Hs02621230_s1), TP53 (Hs01034249_m1), MLH1 (Hs00979919_m1), and RB1 (Hs01078066_m1), according to the manufacturer's protocol. RT PCR reactions were run on ABI Viia7 System (Applied Biosystems, Massachusetts, USA). Each sample and negative control was analyzed in technical triplets. GAPDH (Hs02786624_g1) and ACTB (Hs01060665_g1) were used as reference genes for normalization. Blood is a complex tissue for studying gene expression with multiple cell types and differentiation stages contributing to whole blood RNA. In previous blood gene expression studies22, 23, 24, 25 ACTB and GAPDH turnt out to be suitable reference genes. Following normalization with ACTB and GAPDH, the mRNA levels of all studied TS genes in the control group varied within the normal range. Evaluation of melt curve and amplification plots were done with the QuantStudio Real‐Time PCR Software v1.2.4 (ThermoScientific) using the ΔΔCt method.
Statistical analyses
IBM SPSS version 23 was used for descriptive and bivariate statistics. Group comparison analysis was dependent on the distribution of the data as either parametric (T test) or nonparametric (Mann‐Whitney U test). For correlation analysis, either Pearson or nonparametric Spearman correlation was performed according to the data distribution. P values < 0.05 was considered significant. To test a significant relationship between two categorical variables, the χ2 test of independence was used.
Results
Tumor suppressor genes display very low promoter methylation levels
Our DBS assay targets promoter regions in the TS genes BRCA1, BRCA2, RAD51C, ATM (region 1 and 2), PTEN, TP53 (region 1 and 2), MLH1, and RB1 as well as in the estrogen receptor gene ESR1, which is frequently activated during BC development.26 Apart from ESR1 and RB1, all are BC susceptibility genes. The number of analyzed CpGs in the different amplicons ranged from 15 in TP53 region 2 to 52 in the BRCA2 promoter (Supporting Information Table S1). We determined mean methylation (of all analyzed CpGs in a given amplicon) in blood DNA of 43 BRCA1/BRCA2 mutation‐negative women with EO BC, 36 with HR BC, and 80 age‐matched controls. The average read numbers ranged from 5,300 for BRCA2 to 24,500 for ATM region 2 (Supporting Information Table S1). In all 8 analyzed TS genes (10 amplicons) and all analyzed cohorts, mean promoter methylation was < 1% and there was no difference between BC and control groups (Table 1; Supporting Information Fig. S1). Mean methylation of the ESR1 promoter‐flanking region was 5–10 times higher, namely 3.1 ± 0.1%. In our experience with several dozen genes, this is more representative for an unmethylated gene promoter. Evidently, the demethylated state of TS genes is very tightly controlled in normal body cells. In a previous bisulfite pyrosequencing screen of BC susceptibility genes, 6% mean methylation was used as threshold for the identification of constitutive epimutations.7 In the 79 mutation‐negative BC and the 80 control samples analyzed by DBS, only one patient (HR BC30) exhibited such an hypermethylation with a mean BRCA1 methylation of 12.9%.
Table 1.
Mean methylation and epimutation rates in tumor suppressor genes
| EO BC | Controls | HR BC | Controls | |
|---|---|---|---|---|
| Mean methylation ± standard deviation in % (Range in %) | ||||
| BRCA1 |
0.540 ± 0.036 (0.2–1.4) |
0.662 ± 0.059 (0.4–2.6) |
0.850 ± 0.352 (0.3–12.9) 0.506 ± 0.075a (0.3–2.4) |
0.369 ± 0.014 (0.3–0.7) |
| BRCA2 | N/A | N/A |
0.347 ± 0.013 (0.2–0.5) |
0.337 ± 0.014 (0.2–0.5) |
| RAD51C |
0.549 ± 0.049 (0.2–1.7) |
0.585 ± 0.027 (0.3–1.2) |
0.494 ± 0.039 (0.3–1.3) |
0.481 ± 0.032 (0.2–1.1) |
|
ATM
region 1 |
0.342 ± 0.014 (0.2–0.7) |
0.375 ± 0.010 (0.2–0.5) |
0.292 ± 0.012 (0.2–0.5) |
0.264 ± 0.009 (0.2–0.4) |
|
ATM
region 2 |
0.388 ± 0.014 (0.2–0.6) |
0.460 ± 0.012 (0.3–0.7) |
0.356 ± 0.032 (0.2–1.4) |
0.333 ± 0.001 (0.3–0.5) |
| PTEN |
0.403 ± 0.018 (0.2–0.6) |
0.434 ± 0.016 (0.3–0.6) |
0.308 ± 0.015 (0.2–0.7) |
0.289 ± 0.010 (0.2–0.4) |
|
TP53
region 1 |
0.366 ± 0.015 (0.2–0.6) |
0.410 ± 0.013 (0.2–0.6) |
0.319 ± 0.011 (0.2–0.5) |
0.319 ± 0.009 (0.2–0.4) |
|
TP53
region 2 |
0.612 ± 0.059 (0.3–2.1) |
0.514 ± 0.016 (0.3–0.7) |
0.389 ± 0.022 (0.2–0.9) |
0.403 ± 0.027 (0.2–1.1) |
| MLH1 |
0.381 ± 0.017 (0.2–0.7) |
0.456 ± 0.014 (0.3–0.6) |
0.386 ± 0.039 (0.3–1.7) |
0.339 ± 0.008 (0.3–0.4) |
| RB1 |
0.448 ± 0.015 (0.3–0.8) |
0.507 ± 0.012 (0.4–0.7) |
0.356 ± 0.008 (0.3–0.4) |
0.367 ± 0.011 (0.3–0.5) |
| Mean epimutation rate ± standard deviation in % (Range in %) | ||||
| BRCA1 |
0.086 ± 0.037 (0–1.0) |
0.114 ± 0.067 (0–2.3) |
0.567 ± 0.413 (0–14.7) 0.163 ± 0.089a (0–2.5) |
0.006 ± 0.006 (0–0.2) |
| BRCA2 | N/A | N/A | 0 | 0 |
| RAD51C |
0.162 ± 0.053 (0–1.4) |
0.088 ± 0.028 (0–0.8) |
0.128 ± 0.051 (0–1.2) |
0.065 ± 0.035 (0–0.8) |
|
ATM
region 1 |
0 | 0 |
0.003 ± 0.003 (0–0.1) |
0 |
|
ATM
region 2 |
0.001 ± 0.001 (0–0.1) |
0 |
0.031 ± 0.031 (0–1.1) |
0.003 ± 0.003 (0–0.1) |
| PTEN | 0 | 0 |
0.017 ± 0.012 (0–0.4) |
0 |
|
TP53
region 1 |
0 | 0 | 0 | 0 |
|
TP53
region 2 |
0.007 ± 0.004 (0–0.1) |
0.011 ± 0.005 (0–0.1) |
0.040 ± 0.016 (0–0.4) |
0.065 ± 0.033 (0–1.0) |
| MLH1 | 0 | 0 |
0.003 ± 0.003 (0–0.3) |
0 |
| RB1 | 0 | 0 | 0 |
0.006 ± 0.006 (0–0.2) |
Excluding the sample with constitutive epimutation.
Tumor suppressor genes display very low EMRs
Consistent with earlier studies,27, 28, 29, 30, 31 individual alleles with > 50% aberrantly methylated CpGs were considered as epimutations. Table 1 presents the average EMRs of 8 TS genes (10 amplicons) in 79 BC patients (EO and HR) and 80 unaffected controls. It is noteworthy that BRCA2, ATM region 1, PTEN, TP53 region 1, and MLH1 did not show a single epimutation in 80 controls (with 0.4–2.4 million analyzed alleles per gene), and BRCA2, TP53 region 1, and RB1 did not in 80 BC patients. The highest EMRs were observed for BRCA1 (0.31%) and RAD51C (0.15%) in the BC group. The only significant (Mann‐Whitney U test, p = 0.019) difference between BC (0.31%) and control samples (0.06%) was for BRCA1. This between‐group difference also remained significant (Mann‐Whitney U, p = 0.030) after exclusion of the one HR BC sample with constitutive epimutation.
Table 2 presents the number of samples in the BC and control groups with epimutations. The majority of individuals, 22 of 43 (51%) EO BC, 20 of 36 (56%) HR BC, and 51 of 80 (64%) controls did not display a single epimutation in any analyzed TS gene. The highest number of samples (combined BC cases and controls) with epimutations were observed for RAD51C (43/163; 26%), BRCA1 (20/156; 13%), and TP53 region 2 (25/159; 16%), the lowest for BRCA2 (0/72; 0%), TP53 region1 (0/155; 0%), and ATM region 1 (1/159; 0.6%). Three EO BC, 8 HR BC, and 6 control samples displayed epimutations in multiple TS genes (Fig. 1, upper panel). Samples with BRCA1 epimutations were significantly (χ2 test, p = 0.016) more frequent in the BC group (15/78; 19%) than in controls (5/78; 6%) (Table 2). Figure 2 displays all measured EMRs in the 8 analyzed TS genes. The majority (> 80%) of samples with epimutations displayed low (< 1%) EMRs. In 8% the EMRs were in an intermediate range (1%‐2.5%). Only a single sample, HR BC30 displayed a high EMR (14.7%) consistent with a constitutive BRCA1 epimutation. Most BC patients with epimutations had been tumor‐free for several years at the time of analysis, i.e. HR BC30 for > 6 years. Overall, there was no significant correlation (Spearman rho = −0.09; p = 0.5) between epimutations and tumor status.
Table 2.
Number of BC and control samples with epimutations (> 50% methylated CpGs) or single CpG methylation errors
| EO BC | Controls | HR BC | Controls | p valuea | |
|---|---|---|---|---|---|
| Number (percentage) of samples with epimutation | |||||
| BRCA1 | 7/42 (17%) | 4/42 (9.5%) | 8/36 (22%) | 1/36 (3%) | 0.016 |
| BRCA2 | N/A | N/A | 0/36 (0%) | 0/36 (0%) | |
| RAD51C | 14/43 (33%) | 13/44 (30%) | 9/36 (25%) | 7/36 (19%) | |
| ATM region 1 | 0/43 (0%) | 0/44 (0%) | 1/36 (3%) | 0/36 (0%) | |
| ATM region 2 | 1/43 (2%) | 0/44 (0%) | 1/36 (3%) | 1/36 (3%) | |
| PTEN | 0/31 (0%) | 0/32 (0%) | 3/36 (8%) | 0/36 (0%) | |
| TP53 region 1 | 0/41 (0%) | 0/42 (0%) | 0/36 (0%) | 0/36 (0%) | |
| TP53 region 2 | 2/43 (5%) | 5/44 (11%) | 9/36 (25%) | 9/36 (25%) | |
| MLH1 | 0/43 (0%) | 0/44 (0%) | 2/36 (3%) | 0/36 (0%) | |
| RB1 | 0/42 (0%) | 0/42 (0%) | 0/36 (0%) | 1/36 (3%) | |
| Number (percentage) of samplesb with single CpG hypermethylation | |||||
| BRCA1 | 1/35 (3%) | 0/38 (0%) | 0/28 (0%) | 0/35 (0%) | |
| BRCA2 | N.A. | N.A. | 2/36 (5.5%) | 1/36 (3%) | |
| RAD51C | 1/29 (3.5%) | 0/31 (0%) | 0/27 (0%) | 0/29 (0%) | |
| ATM region 1 | 7/43 (16%) | 2/44 (4.5%) | 0/35 (0%) | 1/36 (3%) | |
| ATM region 2 | 4/42 (9.5%) | 0/44 (0%) | 0/35 (0%) | 0/35 (0%) | |
| PTEN | 12/31 (39%) | 1/32 (3%) | 1/33 (3%) | 0/36 (0%) | 0.006 |
| TP53 region 1 | 9/41 (22%) | 1/42 (2.5%) | 1/36 (3%) | 0/36 (0) | 0.010 |
| TP53 region 2 | 7/41 (17%) | 0/39 (0%) | 0/27 (0%) | 0/27 (0%) | 0.014 |
| MLH1 | 10/43 (23%) | 3/44 (7%) | 1/34 (3%) | 0/36 (0%) | 0.027 |
| RB1 | 7/42 (17%) | 1/42 (2.5%) | 1/36 (3%) | 0/35 (0%) | 0.035 |
For a significant difference between BC and control samples.
Excluding samples with epimutations (allele methylation errors) in a given gene.
Figure 1.

Samples with epimutations (top panel) and single CpG hypermethylation (bottom) in multiple TS genes. Lines represent samples, lanes genes. Epimutations and single CpG hypermethylation, respectively, in a given sample are indicated by gray bars. For example HR BC27 exhibits epimutations in BRCA1, RAD51C, PTEN, and TP53 (region 2); EO BC96 single CpG hypermethylation in BRCA1, ATM (region 1 and 2), TP53 (region 2), and RB1.
Figure 2.

Variation in epimutation rates in BC cases and controls. For each of the 8 TS genes (BRCA1, BRCA2, RAD51C, ATM, PTEN, TP53, MLH1, and RB1) EMRs in BC patients and controls are indicated by filled circles. Colored diamonds indicate multiple samples with the same EMR. Colored arrows indicate samples of BC patients with a tumor at the time of analysis. Most epimutations are seen in BRCA1 and RAD51C. Most EMRs are below the 1% threshold. Relatively few EMRs, mainly in BC samples are in the intermediated range from 1% to 2.5%. Only one sample shows an EMR > 10%. Samples without epimutations are not shown.
The amplicons for BRCA1 and RAD51C contained SNPs with a high minor allele frequency, which allowed us to distinguish the two alleles in heterozygous samples. In 14 informative samples for BRCA1 (4 EO BC, 7 HR BC, and 3 controls) and 10 (5 EO BC, 3 HR BC, and 2 controls) for RAD51C, epimutations were always confined to a single parental allele.
Single CpG hypermethylation in TS genes
Single CpG methylation errors delineate alleles with only 1 or 2, rarely more aberrantly methylated CpGs, whereas the majority of the 15–52 analyzed contiguous CpGs was unmethylated. Figure 3 and Supporting Information Figure S2 show that single CpG methylation errors occur at low frequency (usually < 1%) at every CpG in all analyzed genes. The observed minor fluctuations in average methylation levels among neighboring CpGs in an overall hypomethylated promoter may reflect differences in chromatin structure rather than probabilistic events.32 To distinguish between stochastic noise and potentially relevant single CpG hypermethylation, we defined a threshold for each CpG in a given assay based on box plot analysis of control samples without epimutations: single CpG methylation values more than five times the interquartile range (IQR) away from the 75th percentile were considered as abnormal. Using these strict criteria, only a few control samples displayed single CpG hypermethylation, i.e. of BRCA2 CpG2 in control 74 (Fig. 3). In contrast, there was a considerable number of BC samples (without epimutations) with abnormal hypermethylation of multiple CpGs, i.e. of BRCA2 CpGs 4, 9, 12, 17, 26–28, 34, 37, 42, and 52 in HR BC 7. Of 329 analyzed CpGs in 8 TS genes, 110 (33.4%) showed single CpG hypermethylation in the BC cohort and only 12 (3.8%) in controls. Single CpG hypermethylation did not correlate (Spearman rho = −0.03; p = 0.8) with tumor status in BC patients.
Figure 3.
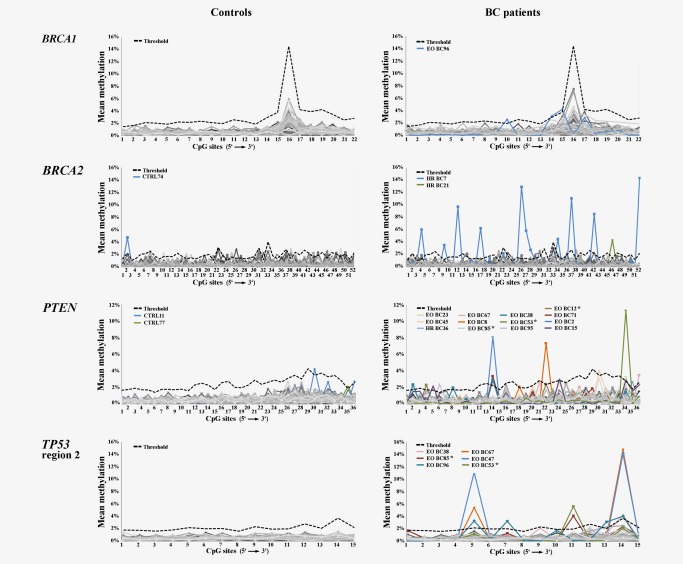
Single CpG methylation profiles of four TS genes (BRCA1, BRCA2, PTEN, and TP53 region 1) in control and BC samples (without epimutations). The x‐axis indicates the number of CpGs (in 5'→3' direction) for a given amplicon, the y‐axis mean methylation of each CpG. The bold black dotted line indicates the threshold for single CpG hypermethylation (5 IQRs away from the 75th percentile in controls). Each sample is indicated by a gray (in different shades) line. Samples with single CpG hypermethylation are indicated by colored lines and sample ID. There are very few hypermethylated single CpGs in controls. Asterisks indicate samples from BC patients with a tumor at the time of analysis. A subset of BC, in particular EO BC samples displays excessive hypermethylation in different individual CpGs.
Table 2 presents the number of BC and control samples with single CpG hypermethylation. It is noteworthy, that BRCA1 and RAD51C, which had the highest number of samples with epimutations, very rarely displayed single CpG hypermethylation. For all other TS genes, the percentage of BC samples with single CpG hypermethylation was always higher than that of controls. For PTEN (χ2 test, p = 0.016), TP53 region 1 (χ2, p = 0.010) and region 2 (χ2, p = 0.014), MLH1 (χ2, p = 0.027), and RB1 (χ2, p = 0.035) there was a significant between‐group difference. Interestingly, 15 of 44 (34%) EO BC, but only 2 of 36 (6%) HR BC samples, and 3 of 80 (4%) control samples displayed single CpG hypermethylation in multiple genes (Fig. 1, lower panel). When considering all BC samples, the age of cancer onset ranged from 21 to 85 years. There was a significant negative correlation (Spearman rho = −0.184; p = 0.018) between the number of genes with single CpG hypermethylation and age at cancer onset (Supporting Information Fig. S3). There was no comparable correlation between the number of genes with epimutations and the age at cancer onset.
Downregulation of TS genes in patients with EO and HR BC
To study possible functional implications of the observed epigenetic abnormalities, TaqMan assays for BRCA1, BRCA2, RAD51C, ATM, PTEN, TP53, MLH1, and RB1 were performed on three control samples, one BC sample with normal methylation patterns (EO BC49), two with single CpG hypermethylation (EO BC96 and 53), and three with low to intermediate EMRs (EO BC74, HR BC8, 11, and 17), respectively. Unfortunately, no RNA could be obtained from the HR BC30 patient with constitutive BRCA1 epimutation. When using CTRL83 as a calibrator, TS gene expression levels in control samples varied from log2 RQ −0.5 to 0.5, which was considered as the normal range (Fig. 4). Expression variation in BC samples was considerably higher: only 8 of 56 (14%) measurements were in the normal range, two (4%) indicative of an overexpression (log2 RQ from 0.5 to 1.0) and 46 (82%) of an underexpression (log2 RQ from −4.0 to −0.5). The majority (31 of 55; 55%) of TS genes showed expression levels below 50% (log2 RQ < −1.0) in all analyzed BC samples, including the one without single CpG hypermethylation and epimutation. Although underexpression in BC samples also affected genes with normal methylation patterns, genes with single CpG hypermethylation (i.e. BRCA1, TP53, and ATM in EO BC96) or epimutations (i.e. BRCA1, RAD51C, and TP53 in HR BC8, BRCA1 in HR BC11 and 17) usually displayed the lowest expression levels.
Figure 4.

Expression levels of tumor suppressor genes BRCA1, BRCA2, RAD51C, ATM, PTEN, TP53, MLH1, and RB1 (indicated by different colors) in blood samples of controls (CTRL81, 82, and 83), BC samples with normal methylation patterns (EO BC49), with single CpG hypermethylation (EO BC96 and 53), and epimutations (EO BC74, HR BC8, 11, and 17), respectively. Diamonds represent relative expression of the color‐coded gene in a given sample. Circles indicate genes with single CpG hypermethylation or epimutation in the analyzed sample. A log2 RQ values of 1 correspond to an expression doubling and of −1 to a division in half (compared to sample CTRL83, which was used as a reference).
Discussion
Allele methylation errors
All analyzed TS genes displayed very low average promoter methylation levels (around 0.5%) and EMRs (0%‐0.3%) in both BC and unaffected control samples. However, even when excluding the one BC sample with constitutive epimutation, the BRCA1 EMR was significantly higher in BC patients than in controls (0.12% vs. 0.06%). Since TS genes are essential for DNA repair, cell cycle control and other mechanisms that maintain genome integrity,5 a highly efficient protection against promoter hypermethylation may be necessary to prevent neoplastic transformation in a normal cell. Promoter hypermethylation of TS genes can serve as the first and/or the second hit in Knudson's model of tumor development. Approximately 20% of sporadic, in particular triple‐negative breast cancers33, 34 and a subset of ovarian cancers35 display BRCA1 promoter hypermethylation. It seems plausible to assume that the few hypermethylated alleles that were observed in some BC and control samples represent stochastic or environmentally induced somatic epimutations. Most (13 of 15; 87%) intermediate and high EMRs were found in BRCA1 and RAD51C. Since in informative samples all abnormal BRCA1 and RAD51C alleles were found on the same parental allele, these epimutations most likely originated in single precursor cells.
Most samples did not display a single epimutation in any of the 8 analyzed genes. Approximately 10% of the samples were endowed with epimutations in multiple TS genes. Most EMRs in both BC and control samples were in the low range (< 1%). Nine of 79 (11%) BC and 4 of 80 (5%) control samples displayed intermediate EMRs between 1% and 2.5%. Only one sample exhibited a high EMR (14.7%), indicating a constitutive BRCA1 epimutation. Consistent with an earlier bisulfite pyrosequencing screen of > 600 patients satisfying the inclusion criteria for hereditary breast and ovarian cancer,7 constitutive epimutations which arise during early embryonal development, may account for a relatively small percentage (1–2%) of BRCA1/BRCA2‐mutation negative BC patients. Evidently, the body must be able to cope with a (very) small proportion of cells with hypermethylated TS alleles, which result from stochastic events and/or adverse environmental exposure and, to some extent, are repaired or eliminated. However, the risk for developing a tumor may increase with accumulating numbers (over age) of cells carrying an epigenetic first hit.
Our DBS assays analyze up to 52 contiguous CpGs per read with a coverage of up to 50,000 reads per sample. Nevertheless, direct measurement of (very) low EMRs in the range of < 0.0001% to 1% remains technically challenging. Sometimes it can be difficult to distinguish true epimutations from technical and bioinformatic artifacts. The sequence divergence between methylated and unmethylated alleles after bisulfite conversion may lead to an amplification bias towards one product, i.e. the unmethylated T‐rich allele.36 In addition, alleles with incomplete bisulfite conversion may mimick hypermethylated alleles. Reduced sequence complexity, asymmetric C to T alignments, and increased searching space, compared to the original reference sequence, can result in false‐positive matches.37 To overcome these problems, we excluded all reads that showed incomplete bisulfite conversion at non‐CpG positions and all reads with low sequencing quality or sequencing errors.
Single CpG hypermethylation
We noted an unusually high rate of single CpG methylation errors at particular positions in a subset of samples (without epimutations). Usually, extreme outliers in box plot analyses are defined by values more than three times the IQR away from the 75th percentile. Because of the overall low IQRs (0.1–0.5%) of single CpG methylation values and to avoid false positives, we set the threshold for single CpG hypermethylation at a 5 IQR distance (in control samples). Single CpG errors are usually interpreted either as errors due to incomplete bisulfite conversion/amplification or as stochastic methylation errors without functional implications.7, 14 Previous studies on the inhibitory effects of MeCP2 in the BRCA1 promoter revealed that expression inhibition does not depend on a specific site(s) but on the density of methylated CpGs.13 In our study single CpG hypermethylation in BRCA1 and RAD51C were very rare, whereas a considerable number of samples showed single CpG hypermethylation in ATM, PTEN, TP53, MLH1, and RB1. Since single CpG hypermethylation was significantly more frequent in BC samples than in controls, it could be directly or indirectly related to tumor pathogenesis. In this context, it is noteworthy that a high percentage (34%) of EO BC samples showed single CpG hypermethylation in multiple TS genes, compared to HR BC (6%) and control samples (4%). It is interesting to speculate that a mechanism preventing or removing single CpG methylation errors may be compromised in EO BC patients. Disturbed maintenance of an unmethylated state may contribute to promoter methylation during tumorigenesis.
TS gene underexpression
Compared to age‐matched controls, all analyzed EO BC and HR BC samples showed an overall underexpression of TS genes. Although usually the genes with single CpG hypermethylation or epimutation displayed the lowest expression levels in a given sample, underexpression was also seen in genes with normal methylation patterns. In EO BC49 where we did not detect any epigenetic abnormalities, all 8 tested TS genes had expression levels below 50%. Since all RNA samples were prepared and run together, we can largely exclude batch effects. Both the observed methylation and expression abnormalities may be due to perturbations of a superordinate mechanism, which predisposes to mutation‐negative EO and HR BC. Accumulating evidence suggests that mutations in a single BRCA1 allele are sufficient to alter the phenotype of breast epithelial cells, leading to cell‐type specific genomic instability and premature senescence.38, 39 In this light, it is plausible to assume that haploinsufficiency of BRCA1 and other tumor suppressor genes confers an increased BC risk. However, future prospective studies on a large number of samples are needed to evaluate the potential of blood TS gene expression as a diagnostic or prognostic marker. At this point we cannot exclude downregulation of TS genes in normal body cells being a consequence of tumor therapy.
Possible effects of circulating tumor cell and/or cell‐free tumor DNA
Since we analyzed DNA samples from whole blood, we have to consider the formal possibility that the observed epimutations and single CpG hypermethylation are derived from circulating tumor cells or cell‐free tumor DNA. A minority (23%) of the analyzed BC patients suffered from a tumor at the time of analysis, whereas the majority had been tumor‐free (after therapy) for several years. Neither epimutations (Fig. 2) nor single CpG hypermethylation (Fig. 3; Supporting Information Fig. S2) were enriched in BC patients with tumor, compared to tumor‐free patients.
Most TS genes displayed comparable and (very) low EMRs in BC patients and controls. Approximately 10% of BC patients and 3% of controls had EMRs > 1% in BRCA1 and/or RAD51C. Single CpG methylation in TS genes even ranged from 2% to >15%. Although we cannot exclude BC dormancy or early‐stage second tumors, circulating tumor cells in these patients occur at very low concentrations of one tumor cell in the background of millions of blood cells and have an average half‐life of only 1–3 h after separation.40, 41 Similarly, cell‐free circulating DNA has a half‐life of approximately 14 h and is rapidly cleared from blood, if not replenished from apoptotic/necrotic cells every few hours.42 Moreover, the vast majority of cell‐free DNA fragments are between 180 and 200 bp,43, 44 and cannot be amplified by our DBS assays, which targets regions between 379 and 597 bp in length. Thus, neither circulating tumor cells nor cell‐free tumor DNA can account for the observed EMRs > 1% or single CpG hypermethylation > 2%.
Conclusions
DBS is a highly efficient technique for both qualitative and quantitative methylation analysis of TS genes. The number of hypermethylated alleles (first hits) in TS genes is very low in normal blood cells. Some TS genes may tolerate a higher number of epimutations (on average up to 0.1% in BRCA1 and RAD51C) than others (< 0.0001% in BRCA2 and TP53 region 1) in the normal body. Constitutive epimutations which are associated with a dramatically increased EMRs are found in a low percentage (1–2%) of mutation‐negative BC patients. In addition to allele methylation errors, we found single CpG hypermethylation in multiple TS genes in normal body cells of approximately one third of EO BC patients. Previous studies45, 46, 47 observed cumulative hypermethylation of TS genes in tumor tissue and/or serum (probably due to cell‐free tumor DNA). The epigenetic abnormalities of TS genes in whole blood DNA in our study are not derived from tumor cells. Most likely they arose in a single cell during early development; epimutations and/or single CpG hypermethylation in blood are thought to reflect the situation in other tissues, including breast and ovary.6, 7 We propose that the observed methylation abnormalities and global underexpression of TS genes in normal body cells are indicative of a compromised process which may contribute to tumorigenesis in mutation‐negative EO and HR BC cases.
Supporting information
Supporting Information
Acknowlegements
The authors thank Daniel Liedtke and Sabine Knaup for help with expression analyses. Conflict of interest: The authors have no conflicts of interest to declare.
References
- 1. Cobain EF, Milliron KJ, Merajver SD. Updates on breast cancer genetics: clinical implications of detecting syndromes of inherited increased susceptibility to breast cancer. Semin Oncol. 2016;43:528–35. [DOI] [PubMed] [Google Scholar]
- 2. Karakosta A, Golias C, Charalabopoulos A, et al Genetic models of human cancer as a multistep process. Paradigm models of colorectal cancer, breast cancer, and chronic myelogenous and acute lymphoblastic leukaemia. J Exp Clin Cancer Res. 2005;24:505–14. [PubMed] [Google Scholar]
- 3. Ehrlich M. Cancer‐linked DNA hypomethylation and its relationship to hypermethylation. Curr Top Microbiol Immunol. 2006;10:251–74. [DOI] [PubMed] [Google Scholar]
- 4. Herman JG, Baylin SB. Gene silencing in cancer in association with promoter hypermethylation. N Engl J Med. 2003;349:2042–54. [DOI] [PubMed] [Google Scholar]
- 5. Majidinia M, Yousefi B. DNA repair and damage pathways in breast cancer development and therapy. DNA Repair (Amst.). 2017;54:22–9. [DOI] [PubMed] [Google Scholar]
- 6. Galetzka D, Hansmann T, El Hajj N, et al Monozygotic twins discordant for constitutive BRCA1 promoter methylation, childhood cancer and secondary cancer. Epigenetics. 2012;7:47–54. [DOI] [PMC free article] [PubMed] [Google Scholar]
- 7. Hansmann T, Pliushch G, Leubner M, et al Constitutive promoter methylation of BRCA1 and RAD51C in patients with familial ovarian cancer and early‐onset sporadic breast cancer. Hum Mol Genet. 2012;21:4669–79. [DOI] [PMC free article] [PubMed] [Google Scholar]
- 8. Sloane MA, Ward RL, Hesson LB. Defining the criteria for identifying constitutional epimutations. Clin Epigenetics. 2016; 8:39 [DOI] [PMC free article] [PubMed] [Google Scholar]
- 9. Wong EM, Southey MC, Fox SB, et al Constitutional methylation of the BRCA1 promoter is specifically associated with BRCA1 mutation‐associated pathology in early‐onset breast cancer. Cancer Prev Res (Phila). 2011;4:23–33. [DOI] [PMC free article] [PubMed] [Google Scholar]
- 10. Snell C, Krypuy M, Wong EM, et al BRCA1 promoter methylation in peripheral blood DNA of mutation negative familial breast cancer patients with a BRCA1 tumour phenotype. Breast Cancer Res. 2008;10:R12 [DOI] [PMC free article] [PubMed] [Google Scholar]
- 11. Iwamoto T, Yamamoto N, Taguchi T, et al BRCA1 promoter methylation in peripheral blood cells is associated with increased risk of breast cancer with BRCA1 promoter methylation. Breast Cancer Res Treat. 2011;129:69–77. [DOI] [PubMed] [Google Scholar]
- 12. Bosviel R, Garcia S, Lavediaux G, et al BRCA1 promoter methylation in peripheral blood DNA was identified in sporadic breast cancer and controls. Cancer Epidemiol. 2012;36:e177–82. [DOI] [PubMed] [Google Scholar]
- 13. Magdinier F, Billard LM, Wittmann G, et al Regional methylation of the 5' end CpG island of BRCA1 is associated with reduced gene expression in human somatic cells. Faseb J. 2000;14:1585–94. [DOI] [PubMed] [Google Scholar]
- 14. Weber M, Hellmann I, Stadler MB, et al Distribution, silencing potential and evolutionary impact of promoter DNA methylation in the human genome. Nat Genet. 2007;39:457–66. [DOI] [PubMed] [Google Scholar]
- 15. Haertle L, Maierhofer A, Böck J, et al Hypermethylation of the non‐imprinted maternal MEG3 and paternal MEST alleles is highly variable among normal individuals. PLoS One. 2017;12:e0184030 [DOI] [PMC free article] [PubMed] [Google Scholar]
- 16. Martin M. Cutadapt removes adapter sequences from high‐throughput sequencing reads. Embnet J . 2011;17:10–2. [Google Scholar]
- 17. Krueger F, Andrews SR. Bismark: a flexible aligner and methylation caller for Bisulfite‐Seq applications. Bioinformatics. 2011;27:1571–2. [DOI] [PMC free article] [PubMed] [Google Scholar]
- 18. Langmead B, Salzberg SL. Fast gapped‐read alignment with Bowtie 2. Nat Methods. 2012;9:357–9. [DOI] [PMC free article] [PubMed] [Google Scholar]
- 19. Li H, Handsaker B, Wysoker A, et al The Sequence Alignment/Map format and SAMtools. Bioinformatics. 2009;25:2078–89. [DOI] [PMC free article] [PubMed] [Google Scholar]
- 20. Robinson JT, Thorvaldsdóttir H, Winckler W, et al Integrative genomics viewer. Nat Biotechnol. 2011;29:24–6. [DOI] [PMC free article] [PubMed] [Google Scholar]
- 21. Wolf B, Kuonen P, Dandekar T, et al DNAseq workflow in a diagnostic context and an example of a user friendly implementation. Biomed Res Int. 2015;2015:403497. [DOI] [PMC free article] [PubMed] [Google Scholar]
- 22. Carrol ED, Salway F, Pepper SD, et al Successful downstream application of the Paxgene Blood RNA system from small blood samples in paediatric patients for quantitative PCR analysis. BMC Immunol. 2007;8:20 [DOI] [PMC free article] [PubMed] [Google Scholar]
- 23. Runne H, Kuhn A, Wild EJ, et al Analysis of potential transcriptomic biomarkers for Huntington's disease in peripheral blood. Proc Natl Acad Sci USA. 2007;104:14424–9. [DOI] [PMC free article] [PubMed] [Google Scholar]
- 24. Zubakov D, Hanekamp E, Kokshoorn M, et al Stable RNA markers for identification of blood and saliva stains revealed from whole genome expression analysis of time‐wise degraded samples. Int J Legal Med. 2008;122:135–42. [DOI] [PMC free article] [PubMed] [Google Scholar]
- 25. Häntzsch M, Tolios A, Beutner F, et al Comparison of whole blood RNA preservation tubes and novel generation RNA extraction kits for analysis of mRNA and MiRNA profiles. PLoS One. 2014;9:e113298 [DOI] [PMC free article] [PubMed] [Google Scholar]
- 26. Jeselsohn R, Buchwalter G, De Angelis C, et al ESR1 mutations ‐ a mechanism for acquired endocrine resistance in breast cancer. Nat Rev Clin Oncol. 2015;12:573–83. [DOI] [PMC free article] [PubMed] [Google Scholar]
- 27. Greger V, Passarge E, Höpping W, et al Epigenetic changes may contribute to the formation and spontaneous regression of retinoblastoma. Hum Genet. 1989;83:155–8. [DOI] [PubMed] [Google Scholar]
- 28. Graff JR, Herman JG, Lapidus RG, et al E‐cadherin expression is silenced by DNA hypermethylation in human breast and prostate carcinomas. Cancer Res. 1995;55:5195–9. [PubMed] [Google Scholar]
- 29. Cunningham JM, Christensen ER, Tester DJ, et al Hypermethylation of the hMLH1 promoter in colon cancer with microsatellite instability. Cancer Res. 1998;58:3455–60. [PubMed] [Google Scholar]
- 30. Kuhtz J, Schneider E, El Hajj N, et al Epigenetic heterogeneity of developmentally important genes in human sperm: implications for assisted reproduction outcome. Epigenetics. 2014;9:1648–58. [DOI] [PMC free article] [PubMed] [Google Scholar]
- 31. Pliushch G, Schneider E, Schneider T, et al In vitro maturation of oocytes is not associated with altered deoxyribonucleic acid methylation patterns in children from in vitro fertilization or intracytoplasmic sperm injection. Fertil Steril. 2015;103:720–7. [DOI] [PubMed] [Google Scholar]
- 32. Schneider E, Pliushch G, El Hajj N, et al Spatial, temporal and interindividual epigenetic variation of functionally important DNA methylation patterns. Nucleic Acids Res. 2010;38:3880–90. [DOI] [PMC free article] [PubMed] [Google Scholar]
- 33. Esteller M, Silva JM, Dominguez G, et al Promoter hypermethylation and BRCA1 inactivation in sporadic breast and ovarian tumors. J Natl Cancer Inst. 2000;92:564–9. [DOI] [PubMed] [Google Scholar]
- 34. Wei M, Grushko TA, Dignam J, et al BRCA1 promoter methylation in sporadic breast cancer is associated with reduced BRCA1 copy number and chromosome 17 aneusomy. Cancer Res. 2005;65:10692–9. [DOI] [PubMed] [Google Scholar]
- 35. Baldwin RL, Nemeth E, Tran H, et al BRCA1 promoter region hypermethylation in ovarian carcinoma: a population‐based study. Cancer Res. 2000; 60:5329–33. [PubMed] [Google Scholar]
- 36. Warnecke PM, Stirzaker C, Melki JR, et al Detection and measurement of PCR bias in quantitative methylation analysis of bisulphite‐treated DNA. Nucleic Acids Res. 1997;25:4422–6. [DOI] [PMC free article] [PubMed] [Google Scholar]
- 37. Xi Y, Li W. BSMAP: whole genome bisulfite sequence MAPping program. BMC Bioinformatics. 2009;10:232 [DOI] [PMC free article] [PubMed] [Google Scholar]
- 38. Sedic M, Skibinski A, Brown N, et al Haploinsufficiency for BRCA1 leads to cell‐type‐specific genomic instability and premature senescence. Nat Commun. 2015;6:7505 [DOI] [PMC free article] [PubMed] [Google Scholar]
- 39. Sedic M, Kuperwasser C. BRCA1 haploinsufficiency: unraveling the molecular and cellular basis for tissue‐specific cancer. Cell Cycle. 2016;15:621–7. [DOI] [PMC free article] [PubMed] [Google Scholar]
- 40. Meng S, Tripathy D, Frenkel EP, et al Circulating tumor cells in patients with breast cancer dormancy. Clin Cancer Res. 2004;10:8152–62. [DOI] [PubMed] [Google Scholar]
- 41. Alix‐Panabières C, Pantel K. Circulating tumor cells: liquid biopsy of cancer. Clin Chem. 2013;59:110–8. [DOI] [PubMed] [Google Scholar]
- 42. Yu SC, Lee SW, Jiang P, et al High‐resolution profiling of fetal DNA clearance from maternal plasma by massively parallel sequencing. Clin Chem. 2013;59:1228–37. [DOI] [PubMed] [Google Scholar]
- 43. Jahr S, Hentze H, Englisch S, et al DNA fragments in the blood plasma of cancer patients: quantitations and evidence for their origin from apoptotic and necrotic cells. Cancer Res. 2001;61:1659–65. [PubMed] [Google Scholar]
- 44. Mouliere F, Robert B, Arnau Peyrotte E, et al High fragmentation characterizes tumour‐derived circulating DNA. PLoS One. 2011;6:e23418 [DOI] [PMC free article] [PubMed] [Google Scholar]
- 45. Dulaimi E, Hillinck J, Ibanez de CI, et al Tumor suppressor gene promoter hypermethylation in serum of breast cancer patients. Clin Cancer Res. 2004;10:6189–93. [DOI] [PubMed] [Google Scholar]
- 46. Fackler MJ, McVeigh M, Mehrotra J, et al Quantitative multiplex methylation‐specific PCR assay for the detection of promoter hypermethylation in multiple genes in breast cancer. Cancer Res. 2004;64:4442–52. [DOI] [PubMed] [Google Scholar]
- 47. Sharma G, Mirza S, Yang YH, et al Prognostic relevance of promoter hypermethylation of multiple genes in breast cancer patients. Cell Oncol. 2009;31:487–500. [DOI] [PMC free article] [PubMed] [Google Scholar]
Associated Data
This section collects any data citations, data availability statements, or supplementary materials included in this article.
Supplementary Materials
Supporting Information