

Abstract
Aims
To compare clinical outcomes in patients with type 2 diabetes (T2D) switching from insulin glargine 100 units/mL (Gla‐100) or insulin detemir (IDet) to insulin glargine 300 units/mL (Gla‐300) or insulin degludec (IDeg).
Materials and Methods
We conducted a retrospective, observational study of electronic medical records for Gla‐300/IDeg adult switchers (March 1, 2015 to January 31, 2017) with active records for 12‐month baseline (glycated haemoglobin [HbA1c] used a 6‐month baseline period) and 6‐month follow‐up periods. Gla‐300 and IDeg switchers were propensity score‐matched using baseline demographic and clinical characteristics. Outcomes were HbA1c change and goal attainment (among patients with HbA1c captured at follow‐up), and hypoglycaemia with fixed follow‐up (intention‐to‐treat [ITT]; 6 months) and variable follow‐up (on‐treatment [OT]; to discontinuation or 6 months).
Results
Each matched cohort comprised 1592 patients. The mean decrease in HbA1c and HbA1c goal (<7.0% [53 mmol/mol] and <8.0% [64 mmol/mol]) attainment rates were similar for Gla‐300 (n = 742) and IDeg (n = 727) switchers. Using fixed follow‐up (ITT method), hypoglycaemia incidence decreased significantly from baseline with Gla‐300 (all hypoglycaemia: 15.6% to 12.7%; P = .006; hypoglycaemia associated with inpatient/emergency department [ED] encounter: 5.3% to 3.5%; P = .007), but not with IDeg. After adjusting for baseline hypoglycaemia, no significant differences in hypoglycaemia incidence and event rate were found at follow‐up (ITT) for Gla‐300 vs IDeg. Using variable follow‐up (OT), hypoglycaemia incidence was similar in both groups, but Gla‐300 switchers had a lower inpatient/ED hypoglycaemia event rate at follow‐up (adjusted rate ratio 0.56; P = .016).
Conclusions
In a real‐world setting, switching from Gla‐100 or IDet to Gla‐300 or IDeg was associated with similar improvements in glycaemic control and hypoglycaemia in adult patients with T2D.
Keywords: basal insulin, glycaemic control, hypoglycaemia, observational study, type, 2 diabetes
1. INTRODUCTION
Current United States (US) guidelines recommend basal insulin therapy as an option for people with type 2 diabetes (T2D) that is uncontrolled using metformin with or without additional oral antidiabetic drugs.1, 2 Second‐generation basal insulin analogues (eg, insulin glargine 300 units/mL [Gla‐300]3 and insulin degludec [IDeg]4) became available in the US in 2015. These have more stable pharmacokinetic and pharmacodynamic profiles and a longer duration of action than the first‐generation basal insulin analogues (eg, insulin glargine 100 units/mL [Gla‐100] or insulin detemir [IDet]).5, 6
The EDITION clinical trial programme, which compared Gla‐300 with Gla‐100 in patients with diabetes, showed that Gla‐300 provides similar glycaemic control to Gla‐100, with less confirmed (≤3.9 mmol/L [70 mg/dL]) or severe hypoglycaemia, over a period of 6 months in patients with T2D.7 Similarly, the BEGIN clinical trial programme, which studied IDeg across the spectrum of diabetes, showed that IDeg was associated with reduced nocturnal confirmed hypoglycaemia when compared with Gla‐100 in patients with T2D.6 Head‐to‐head comparisons between the second‐generation basal insulin analogues are limited to euglycaemic clamp studies. While one euglycaemic clamp study demonstrated a favourable pharmacokinetic and pharmacodynamic profile with IDeg,8 another has reported that, compared with IDeg, Gla‐300 offers a more even pharmacokinetic and pharmacodynamic profile when used in patients with type 1 diabetes (T1D)9; however, no comparative efficacy data comparing the second‐generation basal insulin analogues are available, although 2 head‐to‐head randomized controlled trials (RCTs) comparing Gla‐300 and IDeg are currently underway.10, 11
Growing interest in comparative effectiveness research12 and an increasing demand for real‐world data13 to support clinical decision‐making have established a need for, and highlighted the importance of, the inclusion of non‐RCT data sources (electronic medical records [EMRs], electronic registries, etc.) in clinical studies. For example, the outcomes of switching from first‐generation to second‐generation basal insulin analogues in patients with T2D in routine real‐world clinical practice settings have been studied in the Differentiate Gla‐300 clinical and Economic in reaL‐world Via EMR (DELIVER) studies. DELIVER 2 (in patients aged ≥18 years)14 and DELIVER 3 (in patients aged ≥65 years)15 included patients with T2D who switched from basal insulin to Gla‐300 or another basal insulin (IDet, Gla‐100, or IDeg); DELIVER D included adults with T2D who switched from Gla‐100 to Gla‐300 or IDeg.16
In the present paper, we report the methods and results from DELIVER D+, a real‐world study that included adults with T2D who switched from Gla‐100 or IDet to either Gla‐300 or IDeg. The objective of this study was to compare clinical outcomes (glycated haemoglobin [HbA1c] reduction, HbA1c goal attainment, and hypoglycaemia) for the 2 second‐generation basal insulin analogues in patients receiving care in real‐world clinical practice settings. The outcomes were also evaluated in five subgroups of patients known to potentially have increased risk of hypoglycaemia.
2. MATERIALS AND METHODS
2.1. Study design and data source
DELIVER D+ was a retrospective cohort study covering the period March 1, 2014 to July 31, 2017. Data were obtained from the Predictive Health Intelligence Environment database (IBM Explorys, Cleveland, Ohio), which provides real‐world, real‐time EMR data for ~18% of the US population from 39 integrated healthcare systems. It captures >315 billion clinical, financial, and operational data elements, spanning 55 million unique patients, 420 hospitals and >400 000 providers. Data (demographics, diagnoses, treatment, laboratory results, encounter‐level data, etc.) were standardized and normalized using common ontologies. Data from multiple health systems (inpatient, outpatient, emergency, ambulatory, etc.) were available, with a combination of data from clinical EMRs, healthcare system outgoing bills, and adjudicated payer claims.
2.2. Study population
Adult patients (aged ≥18 years) with T2D (≥1 diagnosis according to International Classification of Diseases version 9 or 10 [ICD‐9/ICD‐10] codes17 ever in the EMR database) who switched from either Gla‐100 or IDet to either Gla‐300 or IDeg during the identification period (March 1, 2015 to January 31, 2017) were included. The date of first prescription of Gla‐300 or IDeg (index basal insulin) in the EMR during the identification period was defined as the index date.
To be included in the cohort, patients had to be active in the EMR system for ≥12 months before the index date (12‐month baseline) and have ≥6 months of follow‐up data after the index date. Patients must have been treated with one basal insulin (Gla‐100 or IDet) and have ≥1 valid HbA1c measure (HbA1c 3% [9 mmol/mol]–15% [140 mmol/mol]) obtained during the 6 months before the index date (6‐month baseline). Patients with T1D were excluded (see Table S1 (Supporting Information) for the algorithm used to identify patients with T1D),18 as were those with a prescription for more than one basal insulin on the index date.
2.3. Outcomes
Patients who switched from Gla‐100 or IDet to Gla‐300 (“Gla‐300 switchers”) were compared with those who switched from Gla‐100 or IDet to IDeg (“IDeg switchers”). HbA1c reduction (baseline to follow‐up) and HbA1c goal attainment (<7.0% [53 mmol/mol] and <8.0% [64 mmol/mol]) were compared (Gla‐300 vs IDeg) for patients who had ≥1 valid HbA1c measure during 3 to 6 months of follow‐up. The last HbA1c value before the index date was used for the baseline HbA1c measurement. The last follow‐up HbA1c measurement (taken in the 3–6 months following the index date) was used.
Hypoglycaemia events (based on ICD‐9/ICD‐10 diagnoses or blood glucose ≤3.9 mmol/L [70 mg/dL] reported in the EMRs; both all hypoglycaemia events and those associated with an inpatient or emergency department [ED] encounter) were analysed for all patients.
Hypoglycaemia outcomes were assessed using two approaches: intention‐to‐treat (ITT; events were assessed over the full 6‐month follow‐up period) and on‐treatment (OT; events were captured during treatment; follow‐up was until the earlier of either discontinuation of index basal insulin or the end of the 6‐month follow‐up period). Treatment discontinuation was defined as switching to another basal insulin or having a prescription gap of >45 days. The discontinuation date was the basal insulin switch date or the last prescription end date.
2.4. Propensity‐score matching
To minimize confounding, patients were propensity‐score‐matched19, 20, 21 (1:1) based on baseline demographics and clinical characteristics using a “greedy nearest neighbour” algorithm. Propensity scores were matched from 2 decimal places to up to 8 decimal places. This selects a patient treated with IDeg, and then selects a patient treated with Gla‐300 with the closest propensity score. Once matched, patients were not reconsidered.
Baseline characteristics used for matching included: age; gender; body mass index; race; insurance type; US geographic region; HbA1c; hypoglycaemia; healthcare resource use; comorbidities (Elixhauser comorbidity index)22 and diabetic complications; antidiabetic injectable use (glucagon‐like peptide 1 receptor agonist, rapid‐acting insulin); baseline basal insulin; oral antidiabetic drug use; and concomitant medication use. Medication use and comorbidities were captured during the 12‐month baseline period; HbA1c and hypoglycaemia events were captured during the 6‐month baseline period. To assess imbalance in individual baseline characteristics, χ2/2‐sample t tests were performed and the standardized mean difference was calculated.
2.5. Statistical analysis
Categorical variables are presented as frequencies and percentages and continuous variables as means ± standard deviation (SD).
Reductions in HbA1c and HbA1c goal attainment were assessed for matched patients with ≥1 HbA1c measure during both 6‐month baseline and 3 to 6‐month follow‐up. HbA1c comparison between baseline and follow‐up within each cohort was tested using paired t tests. HbA1c reduction from baseline was compared between cohorts using a 2‐sample t test. χ2 tests were used to assess differences between the two cohorts in the proportion of patients who reached pre‐specified HbA1c targets within the 6‐month follow‐up period.
Hypoglycaemia incidence using 6‐month fixed follow‐up (ITT) is reported as the percentages of patients with ≥1 event in the two cohorts. Odds ratios, adjusted for baseline hypoglycaemia incidence, were calculated to compare the risk of hypoglycaemia between the two cohorts using logistic regression. Hypoglycaemia event rates using ITT are reported as events per person per year. Adjusted least squares mean differences were calculated for hypoglycaemia event rates in the two cohorts; these were controlled for baseline hypoglycaemia events using a generalized linear model procedure. Hypoglycaemia incidences at follow‐up were compared with baseline incidences for both cohorts using McNemar's test.
Hypoglycaemia incidence using variable follow‐up (OT) was calculated as the number of patients experiencing a first hypoglycaemia event divided by the total follow‐up to first event (incidence per person‐years). Hazard ratios adjusted for baseline hypoglycaemia incidence (determined using a proportional hazard Cox model) were calculated to compare hypoglycaemia incidence risk when receiving treatment for the two cohorts. Hypoglycaemia event rates using variable follow‐up (OT) were calculated as number of events divided by the total follow‐up to discontinuation of index basal insulin or the end of the 6‐month follow‐up (events per person‐year). Adjusted rate ratios (adjusted for baseline hypoglycaemia events using Poisson regression) were calculated to compare hypoglycaemia events in the 2 cohorts.
2.6. Sensitivity analyses
Sensitivity analyses for the HbA1c and hypoglycaemia outcomes were conducted by changing the patient identification period to December 1, 2015 to January 31, 2017, a period during which both second‐generation basal insulin analogues were commercially available in the US. Sensitivity analyses for the HbA1c outcome were also conducted by limiting eligible patients to those who did not discontinue index basal insulin treatment within 75 days of the index date.
2.7. Subgroup analyses
The following subgroups were explored to compare clinical outcomes in various sub‐populations of interest:
patients taking a combination of basal and prandial (both rapid‐acting and short‐acting) insulins: (1) ≥1 new prescription of prandial insulin during the 6‐month baseline period (ie, treatment was initiated within the 6 months before the index date) or (2) a prescription with an end date during 6‐month baseline (ie, a prescription showing the patient was still being treated with a prandial insulin during the 6‐month baseline period);
patients with moderate or severe renal impairment (estimated glomerular filtration rate <60 mL/min/1.73 m2 or nephropathy diagnosis);
patients with baseline HbA1c ≥8.0%;
patients at high hypoglycaemia risk (proxy to SWITCH 2 trial),23 characterized by at least one of the following: (1) ≥1 severe hypoglycaemic (inpatient/ED) episode within the 12‐month baseline period; (2) moderate renal impairment (estimated glomerular filtration rate 30–59 mL/min/1.73 m2); and (3) exposure to insulin for >4 years; (4) recent episode of hypoglycaemia (ICD diagnosis and/or glucose ≤3.9 mmol/L [70 mg/dL] within 12 weeks of baseline);
adults aged ≥65 years.
Hypoglycaemia and HbA1c outcomes using fixed follow‐up (ITT) were compared for Gla‐300 vs IDeg switchers in all subgroups.
3. RESULTS
3.1. Patient selection and matching
The study flow diagram is shown in Figure 1. A total of 3823 Gla‐300 switchers and 1699 IDeg switchers were eligible for inclusion in the study. After propensity‐score matching, there were 1592 patients in each cohort. The outcomes of HbA1c control (HbA1c reduction and goal attainment) were analysed in matched patients who had HbA1c measurements at baseline and at 3 to 6‐months' follow‐up (742 and 727 in matched Gla‐300 and IDeg cohorts, respectively). The outcomes of hypoglycaemia were analysed in 1592 patients in each group.
Figure 1.
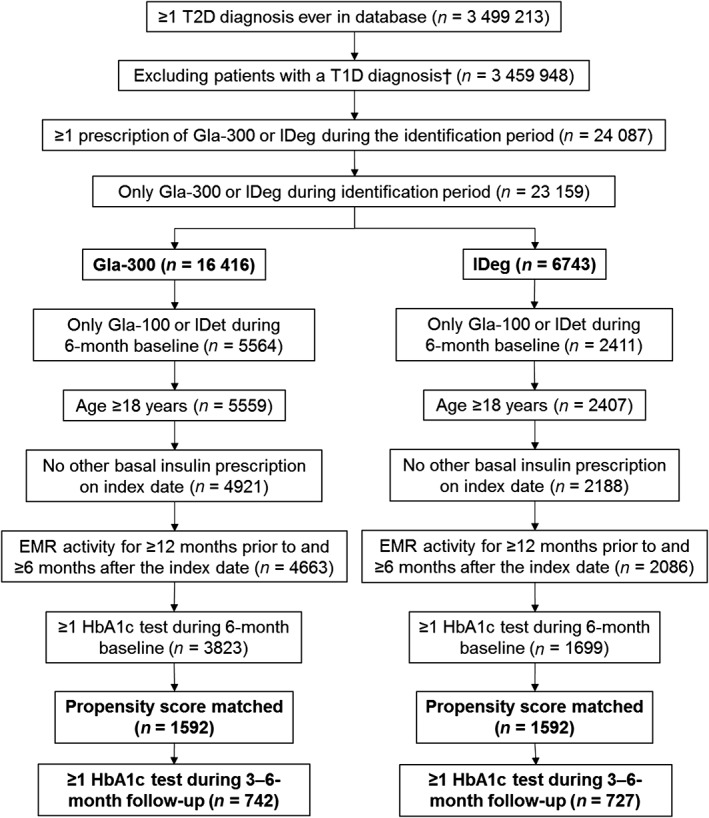
Patient flow chart. EMR, electronic medical records; Gla‐100, insulin glargine 100 units/mL; Gla‐300, insulin glargine 300 units/mL; HbA1c, haemoglobin A1c; IDeg, insulin degludec; IDet, insulin detemir; T1D, type 1 diabetes; T2D, type 2 diabetes. †See Table S1 for the conditions used to identify patients with T1D
3.2. Baseline characteristics
Prior to propensity‐score matching, there were some differences between the two cohorts, mainly related to race, insurance type, geographic region and baseline basal insulin (significantly more patients among the Gla‐300 switchers were previously taking Gla‐100 than among the IDeg switchers [77.3% vs 60.9%; P < .001]; Table S2, Supporting Information). There was, however, little difference in the rate of hypoglycaemia within the 6 months prior to the index date (15.7% of Gla‐300 switchers and 14.2% of IDeg switchers (P = .170) and the incidence rates of various cardiovascular diseases were also similar in the two groups (Table S2, Supporting Information). Any baseline differences were ameliorated after matching (Table 1). In the matched cohorts, the mean age was 59 years and ~50% of patients were men. Approximately 64% of patients in each group had switched from Gla‐100.
Table 1.
Baseline patient characteristics after propensity score matching
| Gla‐300 switchers (n = 1592) |
IDeg switchers (n = 1592) |
SMD | P | |
|---|---|---|---|---|
| Age, years | 59.0 ± 12.2 | 58.7 ± 12.7 | 0.02 | .552 |
| Men, n (%) | 805 (50.6) | 781 (49.1) | 0.03 | .547 |
| Body mass index, kg/m2 | 34.8 ± 7.4 | 34.7 ± 7.4 | 0.02 | .616 |
| Race, n (%) | ||||
| Caucasian | 1192 (74.9) | 1220 (76.6) | 0.04 | .569 |
| African American | 215 (13.5) | 213 (13.4) | 0.00 | .923 |
| Other | 92 (5.8) | 92 (5.8) | 0.00 | 1.000 |
| Unknown | 93 (5.8) | 67 (4.2) | 0.07 | .040 |
| Insurance type, n (%) | ||||
| Commercial | 651 (40.9) | 669 (42.0) | 0.02 | .620 |
| Medicare | 410 (25.8) | 415 (26.1) | 0.01 | .862 |
| Medicaid | 87 (5.5) | 89 (5.6) | 0.01 | .880 |
| Other | 76 (4.8) | 77 (4.8) | 0.00 | .936 |
| Unknown | 368 (23.1) | 342 (21.5) | 0.04 | .329 |
| US geographic region, n (%) | ||||
| Midwest | 882 (55.4) | 877 (55.1) | 0.01 | .905 |
| South | 615 (38.6) | 612 (38.4) | 0.00 | .932 |
| West | 65 (4.1) | 64 (4.0) | 0.00 | .930 |
| Northeast | 30 (1.9) | 39 (2.4) | 0.04 | .279 |
| HbA1c, % | 9.1 ± 1.9 | 9.1 ± 1.8 | 0.00 | .915 |
| Body mass index, kg/m2 | 34.9 ± 7.4 | 34.7 ± 7.4 | 0.02 | .616 |
| Hypoglycaemia incidence in the 6 months prior to the index date, n (%) | 249 (15.6) | 227 (14.3) | 0.04 | .313 |
| Comorbidities, n (%) | ||||
| Hyperlipidaemia | 1283 (80.6) | 1295 (81.3) | 0.02 | .813 |
| Hypertension | 1252 (78.6) | 1253 (78.7) | 0.00 | .984 |
| Obesity | 633 (39.8) | 615 (38.6) | 0.02 | .610 |
| Neuropathy | 472 (29.6) | 477 (30.0) | 0.01 | .871 |
| Depression | 293 (18.4) | 285 (17.9) | 0.01 | .739 |
| Congestive heart failure | 180 (11.3) | 166 (10.4) | 0.04 | .452 |
| Retinopathy | 174 (10.9) | 187 (11.7) | 0.03 | .494 |
| Nephropathy | 152 (9.5) | 148 (9.3) | 0.01 | .817 |
| Peripheral vascular disease | 150 (9.4) | 138 (8.7) | 0.02 | .480 |
| Myocardial infarction | 100 (6.3) | 75 (4.7) | 0.05 | .059 |
| Dementia | 21 (1.3) | 13 (0.8) | 0.05 | .170 |
| Stroke | 8 (0.5) | 5 (0.3) | 0.06 | .405 |
| Elixhauser comorbidities index score22 | 3.7 ± 2.4 | 3.8 ± 2.5 | 0.04 | .217 |
| Treatments in 12 months prior to index date, n (%) | ||||
| Injectables | ||||
| Glucagon‐like peptide 1 receptor agonist | 286 (18.0) | 265 (16.7) | 0.03 | .371 |
| Rapid‐acting insulin | 883 (55.5) | 859 (54.0) | 0.03 | .565 |
| Oral antidiabetic drugs | ||||
| Number | 1.1 ± 0.8 | 1.1 ± 0.8 | 0.01 | .791 |
| Metformin, n (%) | 727 (45.7) | 725 (45.5) | 0.00 | .958 |
| Sulphonylureas, n (%) | 382 (24.0) | 373 (23.4) | 0.01 | .743 |
| Dipeptidyl peptidase‐4, n (%) | 279 (17.5) | 288 (18.1) | 0.01 | .705 |
| Sodium‐glucose co‐transporter‐2 inhibitors, n (%) | 204 (12.8) | 225 (14.1) | 0.04 | .311 |
| Thiazolidinediones, n (%) | 74 (4.7) | 62 (3.9) | 0.04 | .303 |
| Meglitinides, n (%) | 12 (0.8) | 15 (0.9) | 0.02 | .564 |
| α‐glucosidase, n (%) | 2 (0.1) | 7 (0.4) | 0.06 | .096 |
| Other concomitant drugs, n (%) | ||||
| Statins | 1039 (65.3) | 1072 (67.3) | 0.04 | .473 |
| ACE inhibitors | 679 (42.7) | 664 (41.7) | 0.02 | .682 |
| Beta‐blockers | 453 (28.5) | 432 (27.1) | 0.03 | .480 |
| Angiotensin receptor blockers | 172 (10.8) | 174 (10.9) | 0.00 | .914 |
| Calcium channel blockers | 148 (9.3) | 156 (9.8) | 0.02 | .646 |
| Diuretics | 86 (5.4) | 87 (5.5) | 0.00 | .939 |
| Healthcare utilization incidence in 6 months prior to index date, n (%) | ||||
| Inpatient incidence | 229 (14.4) | 220 (13.8) | 0.02 | .671 |
| ED incidence | 391 (24.6) | 402 (25.3) | 0.02 | .696 |
| Endocrinological outpatient incidence | 324 (20.4) | 316 (19.9) | 0.01 | .752 |
| Baseline basal insulin, n (%) | ||||
| Gla‐100 | 1018 (63.9) | 1013 (63.6) | 0.01 | .912 |
| IDet | 574 (36.1) | 579 (36.4) | 0.01 | .883 |
Abbreviations: ACE, angiotensin‐converting enzyme; ED, emergency department; Gla‐100, insulin glargine 100 units/mL; Gla‐300, insulin glargine 300 units/mL; HbA1c, glycated haemoglobin; IDeg, insulin degludec; IDet, insulin detemir; SMD, standardized mean difference. Data are presented as mean ± SD unless otherwise indicated.
3.3. HbA1c control
The mean HbA1c reductions among patients with both baseline and follow‐up HbA1c measurements were similar in the Gla‐300 and IDeg cohorts (0.63 ± 1.7% and 0.58 ± 1.6%, respectively; P = .488). The mean HbA1c decreased significantly from baseline to follow‐up in both cohorts (P < .001; Figure 2A). Patients in both cohorts were equally likely to attain the HbA1c targets of <7.0% (53 mmol/mol) and <8.0% (64 mmol/mol) (Figure 2B).
Figure 2.
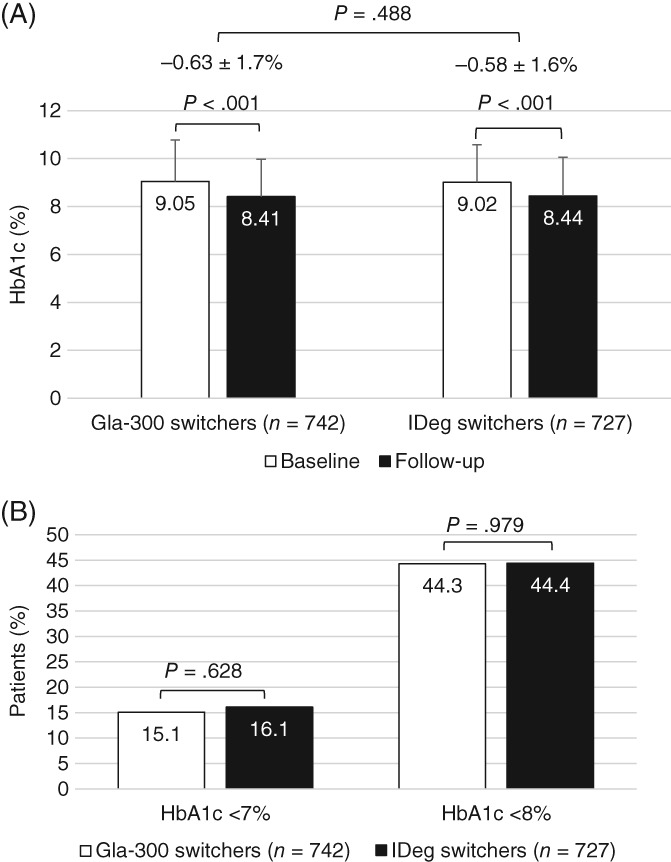
Glycated haemoglobin (HbA1c) outcomes among matched patients with HbA1c test results during baseline (0‐6 months prior to the index date) and follow‐up (3‐6 months after the index date): (A) mean ± SD values during baseline and follow‐up; (B) attainment of goals (<7.0% [53 mmol/mol] and <8.0% [64 mmol/mol]). Gla‐300, insulin glargine 300 units/mL; IDeg, insulin degludec
3.4. Hypoglycaemia
Using fixed follow‐up to 6 months (ITT), the hypoglycaemia incidence rates (Figure 3A) and the adjusted hypoglycaemia event rates (Figure 3B) were similar for Gla‐300 and IDeg switchers. This was also the case for hypoglycaemia associated with an inpatient/ED encounter (Figure 3C and 3D). The incidence rates for all and inpatient/ED hypoglycaemia decreased from baseline to follow‐up in both cohorts, but the differences were only significant for Gla‐300 switchers (Figure 3E).
Figure 3.
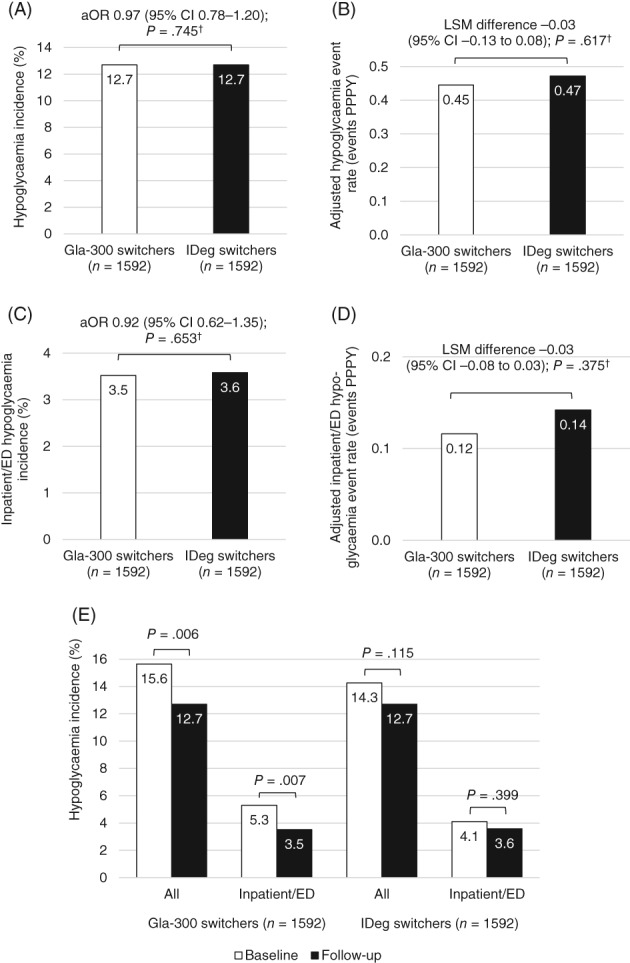
Hypoglycaemia outcomes among all matched patients during fixed 6‐month follow‐up: (A) incidence; (B) adjusted event rate; (C) inpatient/ emergency department (ED) hypoglycaemia incidence; (D) inpatient/ED hypoglycaemia adjusted event rate; (E) hypoglycaemia incidence decreases from baseline to follow‐up. aOR, odds ratio adjusted for baseline hypoglycaemia incidence; CI, confidence interval; Gla‐300, insulin glargine 300 units/mL; IDeg, insulin degludec; LSM, least squares mean; PPPY, per person per year. † P values adjusted for baseline hypoglycaemia incidence
When splitting the follow‐up into 0 to 3 and 4 to 6 months (ie, titration and maintenance), there were no significant differences in hypoglycaemia outcomes between the two cohorts during either time period (Figure S1A‐D, Supporting Information).
In total, 32.0% and 28.5% of patients discontinued treatment in the Gla‐300 and IDeg cohorts, respectively, during 6‐month follow‐up. Using variable follow‐up (OT), there were no significant differences in hypoglycaemia crude incidence rate and hypoglycaemia event rate between the two cohorts, apart from a significantly lower inpatient/ED hypoglycaemic event rate in the Gla‐300 vs IDeg group after adjustment for baseline hypoglycaemia (Table 2).
Table 2.
Hypoglycaemia outcomes using variable (on‐treatment) follow‐up
| Hypoglycaemia | Inpatient/ED hypoglycaemia | |||||||
|---|---|---|---|---|---|---|---|---|
| Gla‐300 switchers(n = 1592) | IDeg switchers(n = 1592) | aHR/aRRa(95% CI) | P b | Gla‐300 switchers(n = 1592) | IDeg switchers(n = 1592) | aHR/aRRa(95% CI) | P b | |
| Patients with ≥1 event, n (%) | 148 (9.3) | 138 (8.7) | – | – | 26 (1.6) | 30 (1.9) | – | – |
| Follow‐up to first event, person‐years | 557 | 572 | – | – | 585 | 598 | – | – |
| Crude incidence rate, PPY | 0.27 | 0.24 | 1.02 (0.81–1.29) | .877 | 0.04 | 0.05 | 0.80 (0.47–1.36) | .417 |
| Events, n | 223 | 222 | – | – | 32 | 47 | – | – |
| Total follow‐up, person‐years | 589 | 603 | – | – | 589 | 603 | – | – |
| Event rate, PPY | 0.38 | 0.37 | 0.94 (0.78–1.14) | .558 | 0.05 | 0.08 | 0.56 (0.35–0.90) | .016 |
Abbreviations: aHR, hazard ratio adjusted for baseline hypoglycaemia incidence; aRR, rate ratio adjusted for baseline hypoglycaemia incidence; ED, emergency department; Gla‐300, insulin glargine 300 units/mL; IDeg, insulin degludec; PPY, per person‐year.
aHR for crude incidence rate (proportional hazard Cox model); aRR for event rate (Poisson regression).
P values adjusted for baseline hypoglycaemia incidence.
3.5. Sensitivity analyses
Changing the identification period to December 1, 2015 to January 31, 2017 (when both products were commercially available to patients) resulted in 2699 and 1699 patients in the unmatched populations, 1520 and 1520 patients in the matched populations, and 700 and 695 patients with follow‐up HbA1c for Gla‐300 and IDeg switchers, respectively. HbA1c reduction results were consistent with the main analysis, with similar reductions being observed in Gla‐300 and IDeg switchers (−0.72 ± 1.75% and −0.58 ± 1.57%, respectively; P = .120). HbA1c goal results were also similar to the main results (<7.0% [53 mmol/mol]: 17.1% vs 16.0%; P = .565 and <8.0% [64 mmol/mol]: 46.6% vs 44.6%; P = .485 for Gla‐300 vs IDeg switchers, respectively), as were hypoglycaemia incidence and event rate results (using both ITT and OT methods).
For patients who continued treatment for ≥75 days and had follow‐up HbA1c (Gla‐300, n = 569; IDeg, n = 572), HbA1c reduction (0.64 ± 1.70% and 0.57 ± 1.52%, for Gla‐300 and IDeg, respectively; P = .428) and goal attainment, results were also similar to the main results.
3.6. Subgroup analyses
Despite some variation in the magnitude of HbA1c reduction in the various subgroups (HbA1c reduction was greatest in those patients with HbA1c ≥8.0% (64 mmol/mol) at baseline, for example), there were no significant differences when comparing HbA1c reductions for Gla‐300 vs IDeg switchers in each of the subgroups (Figure S2A, Supporting Information). With respect to hypoglycaemia incidence (and although incidence was highest among those at high hypoglycaemia risk and those with moderate/severe renal impairment), there were no significant differences when comparing hypoglycaemia incidence for Gla‐300 vs IDeg switchers in each of the subgroups (Figure S2B, Supporting Information).
4. DISCUSSION
In the absence of head‐to‐head trials comparing Gla‐300 and IDeg, DELIVER D+ provides the first comparative evidence on clinical outcomes when switching from Gla‐100/IDet to Gla‐300 or IDeg. In this real‐world study, adults with T2D who switched from first‐generation to second‐generation basal insulin analogues (Gla‐300 or IDeg) achieved similar reductions in HbA1c. This was also found in the DELIVER D study, in which patients switched solely from Gla‐100 to Gla‐300 or IDeg.16
Patients in both DELIVER D+ cohorts achieved significant reductions in HbA1c levels vs baseline. This is in line with DELIVER D,16 DELIVER 2,14 and three other observational studies, in which patients with T2D switched mainly from Gla‐100 or IDet to Gla‐300 (US study)24 or from Gla‐100 or IDet to IDeg (European25 and Japanese26 studies). These three studies reported significant reductions in HbA1c after switching. The results are also in line with RCTs including EDITION 1, 2 and JP 2 (Gla‐300)27, 28, 29 and BEGIN (IDeg).30
As in DELIVER D,16 achievement of HbA1c targets in DELIVER D+ was similar for Gla‐300 and IDeg switchers; however, only ~15% of patients achieved HbA1c <7.0%. This is lower than was achieved with Gla‐300 in EDITION 1, 2 and JP 2 at 6 months (25%–40%)27, 28, 29 and with IDeg in BEGIN at 12 months (49%).30
There are several possible explanations for this: (1) DELIVER D+ examined EMRs of real‐world patients, while in the RCTs, the dose was titrated to target (fasting plasma glucose 4.4–5.6 mmol/L27, 28, 29 or 3.9–<5.0 mmol/L30), indicating that real‐world treatment may not be sufficiently intensified, or that glucose targets are higher in some patients; (2) in the RCTs, close monitoring could have improved adherence; (3) mean baseline HbA1c was higher in DELIVER D+ than in the RCTs, which can be associated with poorer target achievement; and (4) in real‐world use, patients may switch therapies because of poor glycaemic control (and indeed have higher mean HbA1c levels than those seen in the RCTs studying second‐generation basal insulin analogues), which could select patients less likely to achieve glycaemic targets.
The incidicence of hypoglycaemia at follow‐up was largely similar for Gla‐300 vs IDeg switchers; however, using the fixed follow‐up (ITT) method, hypoglycaemia incidence (all and inpatient/ED) reduced significantly from baseline to follow‐up in Gla‐300 switchers; the decreases were not significant for IDeg switchers. When using the variable follow‐up (OT) method and adjusting for baseline hypoglycaemia, Gla‐300 switchers had a significantly lower inpatient/ED hypoglycaemia event rate than IDeg switchers.
In DELIVER D, hypoglycaemia outcomes were similar for Gla‐300 vs IDeg switchers.16 In DELIVER 2 and 3, there was significantly less hypoglycaemia in patients who switched to Gla‐300 vs other basal insulins,14, 15 probably because the “other basal insulin” group mainly included patients treated with first‐generation basal insulin analogues. Overall, the results from the DELIVER studies support reduced hypoglycaemia incidence with second‐generation basal insulin analogues.
Various other studies have also reported reduced hypoglycaemia incidence when switching to second‐generation basal insulin analogues. In the above‐mentioned observational studies (from the US, Europe and Japan), switching to Gla‐30024 or IDeg25, 26 resulted in significant reductions in hypoglycaemia event rates. The improvement in hypoglycaemia with Gla‐300 is also supported by data from the EDITION studies, which reported significantly lower confirmed or severe nocturnal hypoglycaemia in patients randomized to Gla‐300 vs Gla‐100.27, 28, 29 Both the BEGIN and SWITCH 2 studies reported significantly reduced hypoglycaemia in patients randomized to IDeg vs Gla‐100,23, 30 and the DEVOTE trial also reported less adjudicated severe hypoglycaemia in patients using IDeg vs Gla‐100 in a longer 2‐year follow‐up.31 This reduced risk of hypoglycaemia with the second‐generation basal insulin analogues may help reduce barriers for basal insulin use,32 improve adherence,33, 34 and reduce hypoglycaemia‐related healthcare resource utilization and associated costs14; further studies could provide evidence related to these possibilities.
Overall, DELIVER D+ reported that switching from a first‐generation (Gla‐100 or IDet) to a second‐generation (Gla‐300 or IDeg) basal insulin analogue resulted in post‐switch improvements in glycaemic control and hypoglycaemia incidence that were similar for Gla‐300 vs IDeg. These results were consistent among various subgroups of interest, including those with uncontrolled HbA1c, renal impairment and high hypoglycaemia risk (proxy SWITCH 2 trial criteria), and the elderly. Using proxy definitions of RCTs for selecting patients with high hypoglycaemia risk, the similar improvement in incidence and rates of hypoglycaemia compared with RCTs shows that the 2 second‐generation basal insulin analogues have similar clinical outcomes in high‐risk patients with T2D in real‐world practice. Second‐generation basal insulin analogue use may be especially advantageous in certain subgroups of patients who may derive particular benefit from a more stable insulin action and a reduced risk of hypoglycaemia.
In this real‐world study, each subgroup accounted for ~30% to 70% of the overall population. Many of the patients in the subgroups would probably be excluded from RCTs. This has been recognized by Saunders et al.,35 who reported that only ~5% to 50% of people with T2D would have been eligible for the various RCTs that have assessed the impact of glycaemic control on macrovascular disease risk; therefore, although RCTs provide important information on the efficacy and safety of pharmacological agents, the strict inclusion and exclusion criteria and the specialized research facilities and activities often do not reflect the real‐world clinical settings in which the medications are ultimately used. Real‐world studies therefore provide important complementary information about effectiveness in clinical practice, may have better external validity, and are likely to be more generalizable and pertinent to clinicians and healthcare‐delivery systems.13 The design of DELIVER D+ was the same for both cohorts, and the study should therefore provide useful information for decision‐making in the real world.
DELIVER D+ has some limitations, including its retrospective design and that the Predictive Health Intelligence Environment EMR data mostly came from northwest and southern states, so might not be representative of the broader population with T2D in the United States. Further, patients included in the study were early users of second‐generation basal insulin analogues, so their demographic and clinical characteristics might differ from those of basal insulin‐experienced patients in general. Also, diagnoses were based on ICD‐9/ICD‐10 codes; as EMR data may not link the actual diagnosis name, this could have resulted in misclassification. In addition, the database does not provide the date of initial T2D diagnosis. The different prescribing patterns (based on insurance coverage prior to matching [Table S2, Supporting Information]) suggest that upfront medication cost and medication access may be driving some prescription decisions. Further, EMRs only capture medication prescription, not dispensing or consumption. Also, as dosage data were missing in >90% of the EMRs, dose information could not be addressed in DELIVER D+. However, we hope to be able to include dose information in a future study using linked data sources.
The reason for switching was not available in the EMRs, so selection bias may not be completely excluded after propensity‐score matching. It is possible that patients who switched treatments in the present study probably did so because their diabetes was not sufficiently controlled on their previous regimen. Evidence from a retrospective real‐world EU‐TREAT study with no comparator reported that the major reason for switching to IDeg was fluctuation in blood glucose values.25 Switchers may also have received further education about the importance of taking their basal insulin as directed, which could have improved their glycaemic control. Although the majority of inpatient/ED hypoglycaemia episodes would probably be captured in the EMRs, it is probable that a significant number of non‐inpatient/ED hypoglycaemia events were not captured. In addition, self‐monitored blood glucose and continuous blood glucose monitoring data were not available, so the treatment effect on hypoglycaemia could have been underestimated.
Another limitation was the relatively short follow‐up (≤6 months), although this was the same as for the primary endpoint of the EDITION trials,27, 28, 29, 36 but shorter than the BEGIN and DEVOTE trials.30, 31 While pooled 12‐month follow‐up data from EDITION 1, 2 and 3 are now available (showing that Gla‐300 provided more sustained glycaemic control and significantly lower confirmed/severe hypoglycaemia risk compared with Gla‐100),37 further long‐term data for the second‐generation basal insulin analogues would be beneficial. It is noteworthy, however, that the various limitations relevant to EMRs apply to both cohorts and, therefore, may not significantly impact the overall conclusions of the comparisons of the two basal insulins.
In conclusion, the present study provides complementary findings that support results from RCTs and reflect effectiveness in real‐world clinical practice. In nearly 1600 patients with T2D, switching from a first‐generation (Gla‐100 or IDet) to a second‐generation (Gla‐300 or IDeg) basal insulin analogue resulted in similar improvements in glycaemic control, and in >3000 patients, switching to Gla‐300 had a similar or better effect on hypoglycaemia compared with IDeg. The subgroup analyses confirmed the overall findings in various patient subgroups of interest. From the perspective of patients and healthcare practitioners, the benefits associated with these newer basal insulin analogues may lead to improved adherence and quality of care; from the perspective of the integrated delivery networks and healthcare systems, they could provide cost savings by reducing hypoglycaemia‐related healthcare resource utilization.
Supporting information
Table S1. Algorithm for identifying patients with T1D.
Table S2. Baseline patient characteristics for all patients before propensity score matching.
Figure S1. Hypoglycaemia outcomes among all matched patients during fixed 0 to 3 and 4 to 6‐month follow‐up: A, incidence; B, adjusted event rate; C, inpatient/ED hypoglycaemia incidence; D, inpatient/ED hypoglycaemia adjusted event rate.
Figure S2. A, HbA1c reductions and B, hypoglycaemia incidences in the various subgroups.
ACKNOWLEDGMENTS
The authors received writing/editorial support from Yunyu Huang, PhD (Excerpta Medica) and Jenny Lloyd (Compass Medical Communications Ltd., on behalf of Excerpta Medica), funded by Sanofi.
Conflict of interest
S.D.S. has received research support from Sanofi and Novo Nordisk. T.S.B. provides research support for Abbott, Ambra, Ascensia, BD, Boehringer Ingelheim, Calibra Medical, Companion Medical, Dance Biopharm, Dexcom, Eli Lilly, Glooko, Glysens, Kowa, Lexicon, MannKind, Medtronic, Novo Nordisk, Sanofi, Senseonics, Taidoc, Versartis and Xeris, is a consultant honoraria for Abbott, Astra Zeneca, Ascensia, BD, Calibra, Capillary Biomedical, Eli Lilly, Intarcia, Medtronic, Novo Nordisk and Sanofi, and is a speaker honoraria for Abbott, Eli Lilly, Medtronic, Novo Nordisk and Sanofi. R.R. is on advisory panels for AstraZeneca, Abbvie, Sanofi, MSD, Eli Lilly, Janssen, Novo Nordisk and Physiogenex, is a speaker for Bayer and Servier, and has received research funding and provided research support to Danone Research, Amgen, Sanofi and Novo Nordisk. F.L.Z., Z.B., R.P. and J.W. are employees and stockholders of Sanofi. R.A.G. is an employee of Accenture, under contract with Sanofi. L.B. has received grants from and provided research support to AstraZeneca, Janssen Pharmaceuticals, Inc., Lexicon Pharmaceuticals, Inc., Merck & Co., Novo Nordisk and Sanofi, is a speaker for AstraZeneca, Janssen Pharmaceuticals, Inc., Merck & Co., Novo Nordisk and Sanofi, is a consultant for AstraZeneca, GlaxoSmithKline, Intarcia Therapeutics, Inc., Janssen Pharmaceuticals, Inc., Merck & Co., Inc., Novo Nordisk and Sanofi.
Author contributions
F.L.Z., Z.B., R.P. and J.W. designed the study. F.L.Z. and R.A.G. acquired the data. S.D.S. wrote the first draft of the manuscript. All authors contributed to the data analysis and interpretation, and critical review of the manuscript.
Sullivan SD, Bailey TS, Roussel R, et al. Clinical outcomes in real‐world patients with type 2 diabetes switching from first‐ to second‐generation basal insulin analogues: Comparative effectiveness of insulin glargine 300 units/mL and insulin degludec in the DELIVER D+ cohort study. Diabetes Obes Metab. 2018;20:2148–2158. 10.1111/dom.13345
Funding information
This study was funded by Sanofi
REFERENCES
- 1. American Diabetes Association; Standards of Medical Care in Diabetes—2018. Diabetes Care 2018;41(suppl 1):S1–S159. [DOI] [PubMed] [Google Scholar]
- 2. Garber AJ, Abrahamson MJ, Barzilay JI, et al. Consensus Statement by the American Association of Clinical Endocrinologists and American College of Endocrinology on the Comprehensive Type 2 Diabetes Management Algorithm – 2017 Executive Summary. Endocr Pract. 2017;23:207‐238. [DOI] [PubMed] [Google Scholar]
- 3. Sanofi . Toujeo. https://www.drugs.com/pro/toujeo.html. Accessed February 2, 2018.
- 4. Novo Nordisk . Tresiba. https://www.drugs.com/pro/tresiba.html. Accessed February 2, 2018.
- 5. Clements JN, Bello L. Insulin glargine 300 units/mL: a new basal insulin product for diabetes mellitus. Am J Health Syst Pharm. 2016;73:359‐366. [DOI] [PubMed] [Google Scholar]
- 6. Russell‐Jones D, Gall MA, Niemeyer M, Diamant M, Del Prato S. Insulin iDeg results in lower rates of nocturnal hypoglycaemia and fasting plasma glucose vs. insulin glargine: a meta‐analysis of seven clinical trials. Nutr Metab Cardiovasc Dis. 2015;25:898‐905. [DOI] [PubMed] [Google Scholar]
- 7. White JR Jr. Advances in insulin therapy: a review of new insulin glargine 300 units/mL in the management of diabetes. Clin Diabetes. 2016;34:86‐91. [DOI] [PMC free article] [PubMed] [Google Scholar]
- 8. Heise T, Nørskov M, Nosek L, Kaplan K, Famulla S, Haahr HL. Insulin degludec: lower day‐to‐day and within‐day variability in pharmacodynamic response compared with insulin glargine 300 U/mL in type 1 diabetes. Diabetes Obes Metab. 2017;19:1032‐1039. [DOI] [PMC free article] [PubMed] [Google Scholar]
- 9. Bailey TS, Pettus J, Roussel R, et al. Morning administration of 0.4 U/kg/day insulin glargine 300U/mL provides less fluctuating 24‐hour pharmacodynamics and more even pharmacokinetic profiles compared with insulin iDeg 100 U/mL in type 1 diabetes. Diabetes Metab. 2018;44:15‐21. [DOI] [PubMed] [Google Scholar]
- 10. http://ClinicalTrials.gov [Internet]. Bethesda (MD): National Library of Medicine (US). Identifier NCT02738151, Efficacy and Safety of Toujeo Versus Tresiba in Insulin‐Naive Patients With Type 2 Diabetes Mellitus Inadequately Controlled With Oral Antihyperglycemic Drug(s) ± GLP‐1 Receptor Agonist (BRIGHT). https://clinicaltrials.gov/ct2/show/NCT02738151. Accessed February 2, 2018.
- 11. http://ClinicalTrials.gov [Internet]. Bethesda (MD): National Library of Medicine (US). Identifier NCT03078478, A Trial Comparing the Efficacy and Safety of Insulin Degludec and Insulin Glargine 300 Units/mL in Subjects With Type 2 Diabetes Mellitus Inadequately Treated With Basal Insulin With or Without Oral Antidiabetic Drugs. https://clinicaltrials.gov/ct2/show/NCT03078478. Accessed February 2, 2018.
- 12. Tanenbaum SJ. Comparative effectiveness research: evidence‐based medicine meets health care reform in the USA. J Eval Clin Pract. 2009;15:976‐984. [DOI] [PubMed] [Google Scholar]
- 13. Sherman RE, Anderson SA, Dal Pan GJ, et al. Real‐world evidence ‐ what is it and what can it tell us? N Engl J Med. 2016;375:2293‐2297. [DOI] [PubMed] [Google Scholar]
- 14. Zhou FL, Ye F, Berhanu P, et al. Real‐world evidence on clinical and economic outcomes of switching to insulin glargine 300 units/mL vs other basal insulins in patients with type 2 diabetes on basal insulin. Diabetes Obes Metab. 2018;20(5):1293‐1297. [DOI] [PMC free article] [PubMed] [Google Scholar]
- 15. Zhou FL, Ye F, Gupta V, et al. Older Adults with Type 2 Diabetes (T2D) Experience Less Hypoglycemia when Switching to Insulin Glargine 300 U/mL (Gla‐300) vs. Other Basal Insulins (DELIVER 3 Study) [Abstract 986‐P]. The 77th American Diabetes Association Scientific Sessions. San Diego, California; 2017. https://ada.scientificposters.com/epsAbstractADA.cfm?id=1. Accessed February 2, 2018.
- 16. Blonde L, Zhou FL, Bosnyak Z, et al. Real‐world evidence demonstrates comparable clinical outcomes of switching from insulin glargine 100 U/mL (Gla‐100) to insulin glargine 300 U/mL (Gla‐300) vs insulin degludec (iDeg) in patients with type 2 diabetes (T2D). Poster presented at WCIRDC, 2017.
- 17. American Association of Clinical Endocrinologists . Diabetes ICD‐9‐CM Crosswalk to ICD‐10‐CM. 2015. https://www.aace.com/files/socioeconomics/crosswalk/icd9-icd10-crosswalk-for-dm-2015.pdf. Accessed February 2, 2018.
- 18. Klompas M, Eggleston E, McVetta J, Lazarus R, Li L, Platt R. Automated detection and classification of type 1 versus type 2 diabetes using electronic health record data. Diabetes Care. 2013;36:914‐921. [DOI] [PMC free article] [PubMed] [Google Scholar]
- 19. Rosenbaum PR, Rubin DB. The central role of the propensity score in observational studies for causal effects. Biometrika. 1983;70:41‐55. https://academic.oup.com/biomet/article/70/1/41/240879. Accessed December 15, 2017. [Google Scholar]
- 20. Austin PC, Laupacis A. A tutorial on methods to estimating clinically and policy‐meaningful measures of treatment effects in prospective observational studies: a review. Int J Biostat. 2011;7:6. [DOI] [PMC free article] [PubMed] [Google Scholar]
- 21. Austin PC. An introduction to propensity score methods for reducing the effects of confounding in observational studies. Multivariate Behav Res. 2011;46:399‐424. [DOI] [PMC free article] [PubMed] [Google Scholar]
- 22. Quan H, Sundararajan V, Halfon P, et al. Coding algorithms for defining comorbidities in ICD‐9‐CM and ICD‐10 administrative data. Med Care. 2005;43:1130‐1139. [DOI] [PubMed] [Google Scholar]
- 23. Wysham C, Bhargava A, Chaykin L, et al. Effect of insulin degludec vs insulin glargine U100 on hypoglycemia in patients with type 2 diabetes: the SWITCH 2 randomized clinical trial. JAMA. 2017;318:45‐56. [DOI] [PMC free article] [PubMed] [Google Scholar]
- 24. Tong L, Wang H, Gupta S, et al. Effect of switching to insulin glargine 300 U/mL on clinical outcomes in patients with type 2 diabetes: A medical chart‐review study in the US [poster]. http://www.kantarhealth.com/docs/publications-citations/tong-wang-gupta-et-al-switching-basal-insulin-to-toujeo-in-t2d%E2%80%93-amcp-nexus-2016. Accessed February 2, 2018.
- 25. Siegmund T, Tentolouris N, Knudsen ST, et al. A European, multicentre, retrospective, non‐interventional study (EU‐TREAT) of the effectiveness of insulin degludec after switching basal insulin in a population with type 1 or type 2 diabetes. Diabetes Obes Metab. 2018;20:689‐697. [DOI] [PMC free article] [PubMed] [Google Scholar]
- 26. Shimoda S, Sato M, Sekigami T, et al. A 1‐year, prospective, observational study of Japanese outpatients with type 1 and type 2 diabetes switching from insulin glargine or detemir to insulin iDeg in basal‐bolus insulin therapy (Kumamoto Insulin IDeg Observational study). J Diabetes Investig. 2016;7:703‐710. [DOI] [PMC free article] [PubMed] [Google Scholar]
- 27. Riddle MC, Bolli GB, Ziemen M, et al. New insulin glargine 300 units/mL versus glargine 100 units/mL in people with type 2 diabetes using basal and mealtime insulin: glucose control and hypoglycemia in a 6‐month randomized controlled trial (EDITION 1). Diabetes Care. 2014;37:2755‐2762. [DOI] [PubMed] [Google Scholar]
- 28. Yki‐Jarvinen H, Bergenstal R, Ziemen M, et al. New insulin glargine 300 units/mL versus glargine 100 units/mL in people with type 2 diabetes using oral agents and basal insulin: glucose control and hypoglycemia in a 6‐month randomized controlled trial (EDITION 2). Diabetes Care. 2014;37:3235‐3243. [DOI] [PubMed] [Google Scholar]
- 29. Terauchi Y, Koyama M, Cheng X, et al. New insulin glargine 300 U/ml versus glargine 100 U/ml in Japanese people with type 2 diabetes using basal insulin and oral antihyperglycaemic drugs: glucose control and hypoglycaemia in a randomized controlled trial (EDITION JP 2). Diabetes Obes Metab. 2016;18:366‐374. [DOI] [PMC free article] [PubMed] [Google Scholar]
- 30. Garber AJ, King AB, Del Prato S, et al. Insulin degludec, an ultra‐longacting basal insulin, versus insulin glargine in basal‐bolus treatment with mealtime insulin aspart in type 2 diabetes (BEGIN Basal‐Bolus Type 2): a phase 3, randomised, open‐label, treat‐to‐target non‐inferiority trial. Lancet. 2012;379:1498‐1507. [DOI] [PubMed] [Google Scholar]
- 31. Marso SP, McGuire DK, Zinman B, et al. Efficacy and safety of degludec versus glargine in type 2 diabetes. N Engl J Med. 2017;377:723‐732. [DOI] [PMC free article] [PubMed] [Google Scholar]
- 32. Ross SA, Tildesley HD, Ashkenas J. Barriers to effective insulin treatment: the persistence of poor glycemic control in type 2 diabetes. Curr Med Res Opin. 2011;27(suppl 3):13‐20. [DOI] [PubMed] [Google Scholar]
- 33. Garcia‐Perez LE, Alvarez M, Dilla T, Gil‐Guillen V, Orozco‐Beltran D. Adherence to therapies in patients with type 2 diabetes. Diabetes Ther. 2013;4:175‐194. [DOI] [PMC free article] [PubMed] [Google Scholar]
- 34. Dalal MR, Kazemi MR, Ye F. Hypoglycemia in patients with type 2 diabetes newly initiated on basal insulin in the US in a community setting: impact on treatment discontinuation and hospitalization. Curr Med Res Opin. 2017;33:209‐214. [DOI] [PubMed] [Google Scholar]
- 35. Saunders C, Byrne CD, Guthrie B, et al. External validity of randomized controlled trials of glycaemic control and vascular disease: how representative are participants? Diabet Med. 2013;30:300‐208. [DOI] [PubMed] [Google Scholar]
- 36. Bolli GB, Riddle MC, Bergenstal RM, et al. New insulin glargine 300 U/ml compared with glargine 100 U/ml in insulin‐naive people with type 2 diabetes on oral glucose‐lowering drugs: a randomized controlled trial (EDITION 3). Diabetes Obes Metab. 2015;17:386‐394. [DOI] [PMC free article] [PubMed] [Google Scholar]
- 37. Ritzel R, Roussel R, Giaccari A, Vora J, Brulle‐Wohlhueter C, Yki‐Järvinen H. Better glycaemic control and less hypoglycaemia with insulin glargine 300 U/mL vs glargine 100 U/mL: 1‐year patient‐level meta‐analysis of the EDITION clinical studies in people with type 2 diabetes. Diabetes Obes Metab. 2018;20:541‐548. [DOI] [PMC free article] [PubMed] [Google Scholar]
Associated Data
This section collects any data citations, data availability statements, or supplementary materials included in this article.
Supplementary Materials
Table S1. Algorithm for identifying patients with T1D.
Table S2. Baseline patient characteristics for all patients before propensity score matching.
Figure S1. Hypoglycaemia outcomes among all matched patients during fixed 0 to 3 and 4 to 6‐month follow‐up: A, incidence; B, adjusted event rate; C, inpatient/ED hypoglycaemia incidence; D, inpatient/ED hypoglycaemia adjusted event rate.
Figure S2. A, HbA1c reductions and B, hypoglycaemia incidences in the various subgroups.