Abstract
Background
The metabolic syndrome is a constellation of risk factors including dyslipidemia, dysglycemia, hypertension, a pro‐inflammatory state, and a prothrombotic state. All of these factors are accentuated by obesity. However, obesity can be defined by body mass index (BMI), percent body fat, or by body fat distribution. The latter consists of upper body fat (subcutaneous and visceral fat) and lower body fat (gluteofemoral fat). Waist circumference is a common surrogate marker for upper body fat.
Methods
Data from the National Health and Nutrition Examination Survey (NHANES) for the years 1999‐2006 was examined for associations of metabolic risk factors with percent body fat, waist circumference, and BMI.
Results
Associations between absolute measures of waist circumference and risk factors were similiar for men and women. The similarities of associations between waist circumference and risk factors suggests that greater visceral fat in men does not accentuate the influence of upper body fat on risk factors.
Conclusions
Different waist concumference values should not be used to define abdominal obesity in men and women.
Keywords: body fat, metabolic syndrome, obesity, risk factors
1. INTRODUCTION
The metabolic syndrome is a constellation of risk factors for atherosclerotic cardiovascular disease (ASCVD). Metabolic risk factors include dyslipidemia (elevated triglycerides and reduced high density lipoproteins [HDL]), dysglycemia, elevated blood pressure, a pro‐inflammatory state and a prothrombotic state.1, 2 Most patients with metabolic syndrome are obese. Several methods have been employed to identify and classify obesity. Most common is the Body Mass Index (BMI). According to the World Health Organization, a BMI of >30 kg/m² defines obesity.3, 4, 5 In populations, BMI correlates with total body fat content; but in some individuals, BMI is not a reliable indicator of body fat.6, 7 Moreover, in Asian populations, BMI by WHO standards underestimates body fat content.8, 9, 10, 11 Several reports12, 13, 14 show that BMI correlates with metabolic risk factors, but there are exceptions.15, 16 Theoretically, a better indicator of body fat is a direct measure of % body fat. Although there are no accepted definitions of obesity based on % body fat, commonly used cut‐points for men and women are >25% and >35%, respectively.17
The mechanisms underlying the association of obesity with metabolic syndrome are a topic of great interest. Beyond being a marker for overnutrition, many workers contend that adipose tissue is more than a fat storage tissue. Recent studies show that adipose tissue is metabolically active in several ways. The primary function of adipose tissue is to store triglyceride and to release nonesterified fatty acids (NEFA) as an energy source. Release of NEFA is maximal during fasting. A host of other products called adipokines are produced and released by adipose tissue. These include leptin, adiponectin, angiotensinogen, various cytokines, resistin, among others.18, 19 All of these products may influence metabolic risk factors.
There is growing interest in the concept that different adipose tissue beds vary in their influence on metabolic risk. Three major adipose beds have been identified: gluteofemoral fat (lower body fat), upper body subcutaneous fat and visceral fat. These three beds apparently release NEFA and adipokines at different rates or into different circulatory systems.20, 21, 22, 23 For example, visceral adipose tissue releases NEFA into the portal circulation and delivers them directly into the liver. Furthermore, visceral adipose tissue may be a rich source of various adipokines.24 The most common form of obesity associated with the metabolic syndrome is upper body obesity, which consists of excess of both subcutaneous and visceral adipose tissues.1, 2 Upper body obesity is commonly called abdominal obesity, and a strong surrogate for upper body obesity is waist circumference. Opinion differs as to whether subcutaneous or visceral fat correlates more closely with metabolic syndrome. Visceral obesity is considered by many to be a dominant cause of the syndrome.25 Other workers hold that upper body subcutaneous tissue is more important.26 If visceral obesity supersedes other adipose beds, this would imply that metabolic abnormalities induced in the liver are the major cause of the syndrome. On the other hand, the mass of upper body subcutaneous fat is approximately threefold greater than visceral adipose tissue27; subcutaneous adipose tissue releases NEFA mainly into the systemic circulation. This source of NEFA could have a greater impact on skeletal muscle.26 Metabolic dysfunction in skeletal muscle may have a greater impact on metabolic syndrome than hepatic changes.28
Lower body fat correlates poorly with risk factors.29 The reason is uncertain, but possibilities have been proposed. For example, compared with upper body adipose tissue, lower body adipose tissue appears to turnover fatty acids slowly, has the ability to recruit more adipocyte with weight gain for fat storage and is less prone to adipose tissue inflammation.22, 30, 31 On the other hand, excess lower body fat may still have some adverse effect on metabolism.32, 33, 34, 35 In addition, % body fat has been reported to correlate with metabolic syndrome similarly to upper body fat36, 37, 38; if so, a role for lower body fat cannot be discounted.
The belief that upper body fat predominates as a cause of metabolic syndrome underlies the recommendation that waist circumference can be used in the clinical definition of the syndrome.1, 2 In accord, recent studies support the view that waist circumference is more strongly correlated with metabolic risk factors than other measures of body fat.39, 40 Of interest, to define abdominal obesity, different guidelines use different thresholds for waist circumference.4 For men, the waist circumference threshold is generally set higher than for women4; these gender differences have not been justified through clinical evidence comparing cut‐points to metabolic risk factors. This study compares three measures of obesity in men and women to determine their relative contributions to metabolic risk factors: these are total body fat, upper body fat and BMI.
2. METHODS
In this study, we conducted a secondary analyses of data collected in adults for the National Health and Nutrition Examination Survey (NHANES) for the years 1999‐2006. NHANES was initiated in 1956 as part of the National Health Survey Act (National Health and Nutrition Examination Survey data. Hyattsville (MD): US Department of Health and Human Services, Centers for Disease Control and Prevention, National Center for Health Statistics; 2016. https://www.cdc.gov/Nchs/Nhanes/survey_methods.htm. Accessed November 1, 2016).
The files that detail data collection, methods of procedure and other specifications are available at the CDC (https://www.cdc.gov/nchs/nhanes/nhanes_questionnaires.htm). The secondary analysis of the data presented in the current manuscript does not require approval from the Institutional Review Board because the data are de‐identified and available in the public domain.
2.1. Population sample
Briefly, the NHANES strategy for sampling the population is as follows. All USA counties are divided into 15 groups based on subject characteristics. One county is then selected from each large group and together these form the 15 counties in the NHANES yearly surveys. Within each county, 20‐24 smaller groups with a large number of households are selected and from these subgroups, about 30 households are selected within each group. Thereafter, randomly selected household members are interviewed.
In the current analysis, data from a total of 22 624 adults having virtually complete set outcome measures was included. Of these, 47.6% were men. Data from non‐Hispanic Black, Whites and Hispanics were included and combined. Men and women were in the similar age range. The average age for men was 47.2 ± 20.6 years and for women, it was 46.2 ± 20.8 years. Men had a lower average BMI than women (26.8 ± 7.3 kg/m2 vs 27.7 ± 8.4 kg/m2; P < .01). Men also had a lower % body fat than women (26.9 ± 7.6% of total weight vs 34.7 ± 14.9%; P < .01) and a higher waist circumference than women (93.5 ± 25.8 cm vs 89.5 ± 26.1 cm; P < .01). Other subject characteristics have been detailed previously (https://www.cdc.gov/nchs/nhanes/nhanes_ questionnaires.htm).
Some of the participants were taking medications for various conditions and they provided the information regarding the type of medication they were taking. Among responders to the medication questionnaire, 6.4% (% of total cohort) were taking hypoglycaemic agents, 10.7% were taking hypocholesterolemic agents, and 18.2% were taking anti‐hypertensives.
2.2. Database
The data accessed and analysed for the current secondary analysis included demography, anthropometric measures, health‐related information including estimates of physical activity, current medications, blood pressure, fasting blood glucose and insulin levels, triglycerides, HDL cholesterol and hs‐CRP levels. In addition, body composition analysis by dual x‐ray absorptiometry (DXA) was included. BMI was calculated as the ratio of body weight (kg) to the height squared, waist circumference was measured at the level of the right ileum in cm to the nearest mm. Body fat was done by dual X‐ray absorptiometry using a Hologic QDR‐4500A fan‐beam densitometer and software version Discovery v12.4 from mif‐2005 forward and version 8.26:3a prior to 2005. Blood pressure was measured after resting quietly in a sitting position for 5 minutes. Three consecutive blood pressure readings were obtained. Plasma triglyceride, cholesterol and lipoprotein cholesterol were measured colorimetrically in serum. HDL cholesterol was measured using sulphated alpha‐cyclodextrin in the presence of Mg+2 and polyethylene glycol‐coupled cholesterol esterase and cholesterol oxidase. LDL cholesterol was estimated as total cholesterol—triglyceride/5 – HDL cholesterol. C‐reactive protein was measured by latex enhanced nephelometry. Glucose was measured by the hexokinase method and insulin by eLISA. HOMA‐IR 2 was calculated as the product of fasting blood glucose and insulin levels by the method of Levy et al41 using the program provided on line by the Diabetes Trials Unit of the Oxford Centre for Diabetes, Endocrinology and Metabolism of the University of Oxford (https://www.dtu.ox.ac.uk/homacalculator/download.php). Waist circumference was used as a surrogate for integrated measure of upper body obesity. Information about physical activity also was retrieved from the main database. These data were provided as categories of physical activity, ranging from very low activity to heavy work.
2.3. Biostatistical analyses
Subject demography was summarized as means ± standard deviation. Metabolic parameters were summarized as medians. Comparisons of parameters between men and women were done using a general lineal model approach for multivariate analysis and the comparisons were adjusted for age and physical activity differences between the sexes. Tukey‐Kramer Multiple Comparison Test was also carried out. Log transformations were done for HOMA‐IR2, C‐reactive protein and triglyceride levels before doing statistical comparisons of these parameters between men and women. NCSS9 software (https://www.ncss.com/download/ncss/updates/ncss-9/) was employed for all statistical analyses.
3. RESULTS
Figure 1 compares body fat parameters with homoeostatic model assessment for insulin resistance from fasting glucose and insulin concentrations (HOMA‐IR2).41 If all body fat is metabolically equivalent in men and women, the relation between % body fat and HOMA‐IR2 should be the same. In fact, however, for a given percentage of body fat, men had higher HOMA‐IR2 values than women. This implies that body fat is not metabolically equivalent between men and women. As substantial portion of body fat in women is in the gluteofemoral region, this finding supports the view that fat in the lower body is metabolically less active than upper body fat. Such is consistent with previous reports in the literature.22, 29, 30, 31
Figure 1.
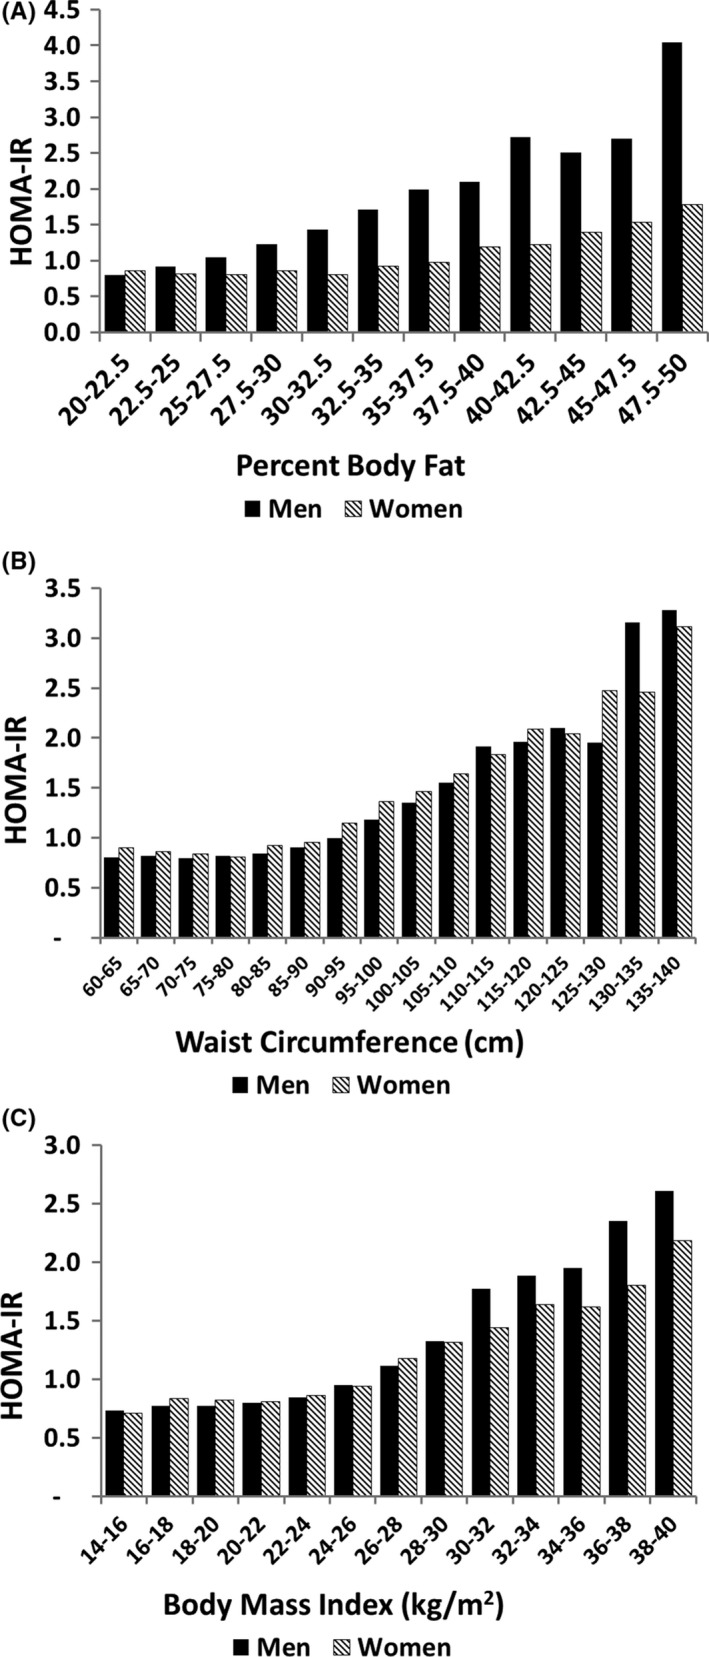
Relation of body fat parameters to HOMA‐IR2: (A) percent body fat; (B) waist circumference; and (C) body mass index. Insulin resistance was calculated according to The Oxford Centre for Diabetes, Endocrinology & Metabolism: Diabetes Trial Unit. HOMA Calculator 2009 [http://www.dtu.ox.ac.uk/]. The HOMA‐IR2 levels were significantly different between men and women (P = .000) across the % body fat intervals. There were no significant differences in HOMA‐IR2 between men and women across waist circumference intervals (P = .99) or Body Mass Index (P = .84)
A different picture was observed for waist circumference (Figure 1B). The relation between HOMA‐IR2 and waist circumference is virtually identical for men and women at all levels of waist circumference. This implies that upper body obesity is a major determinant of insulin resistance, and it has equivalent effects in men and women. One might expect that upper body obesity in men would have a greater effect than in women because men have more visceral fat than women. If visceral fat is metabolically more active than subcutaneous fat, men should have higher HOMA‐IR2 than women at the same waist circumference. As HOMA‐IR2 was similar in men and women as a function of waist circumference, it seems likely that visceral fat affects insulin resistance similarly to subcutaneous fat.
Of interest, the effect of BMI on HOMA‐IR2 is likewise similar for men and women (Figure 1C). This is surprising since BMI is commonly considered a surrogate for total body fat. BMI, therefore, must reflect a greater influence on insulin resistance than exclusively through % body fat. In data not shown, lean body mass correlated similarly to BMI with respect to HOMA‐IR2. Thus, BMI may be more of an indicator of overall metabolic state (or nutritional state) than % body fat alone.
Another metabolic risk factor is elevated triglyceride. Figure 2A shows the relationship between % body fat and serum triglyceride in men and women. Triglyceride levels were higher in men at all levels of % body fat, except in the very obese. Again, this finding most likely can be explained by a greater amount of upper body fat in men for every % of body fat. In contrast, at every level of waist circumference, mean triglyceride levels on the whole were similar in men and women (Figure 2B). These results once more suggest that upper body fat is a major determinant of mean triglyceride level. Although visceral fat has been reported to have a greater effect on triglycerides than upper body subcutaneous fat,29 lack of difference in triglycerides between men and women at every level of waist circumference implies that any predominance of visceral fat over subcutaneous fat is small.
Figure 2.
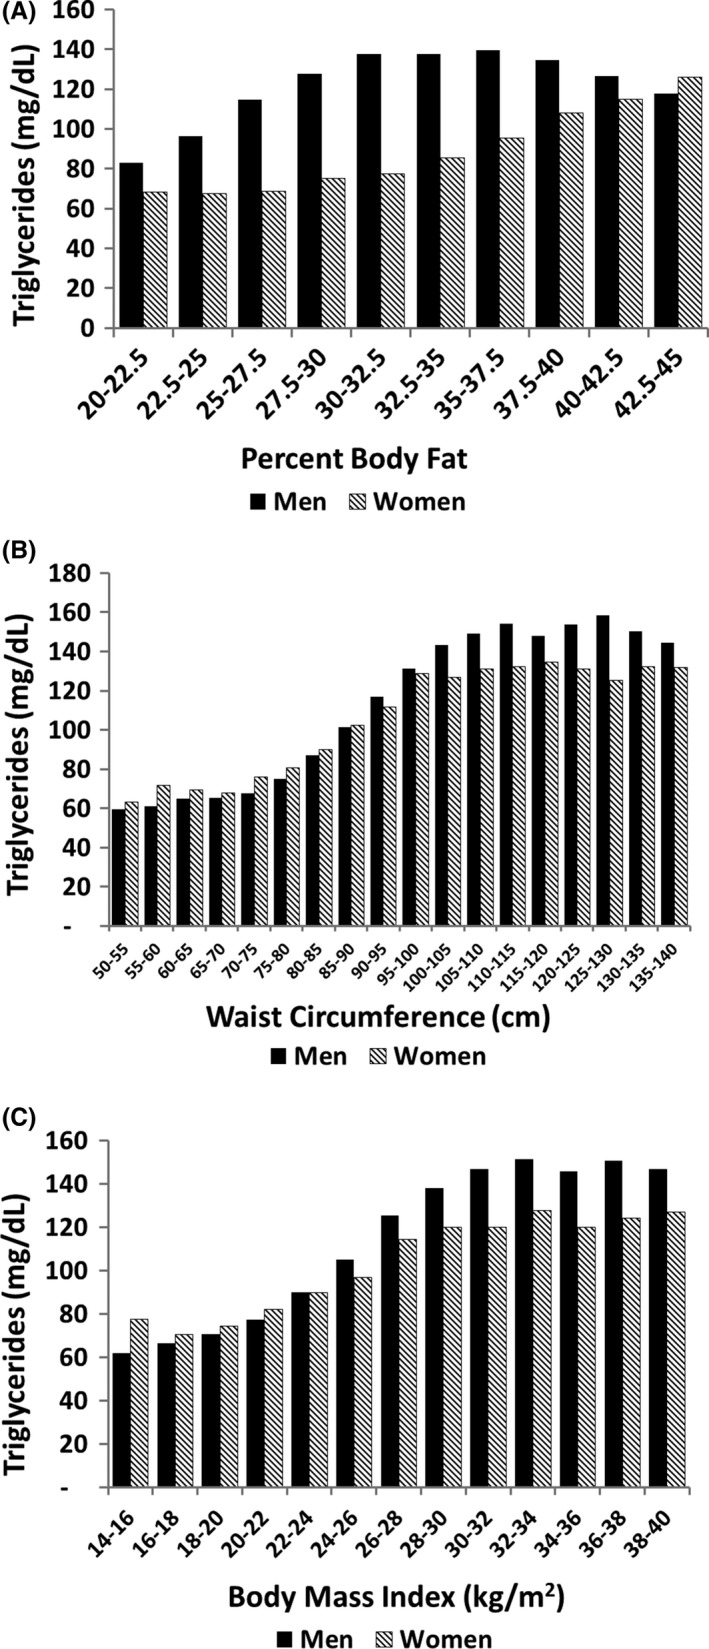
Relation of body fat parameters to serum triglycerides: (A) percent body fat; (B) waist circumference; and (C) body mass index. Triglyceride levels were significantly different between men and women across percent body fat (P = .02) but not across waist circumference (P = .63) or BMI (P = .99)
When BMI was plotted against triglyceride levels, results were similar to those for waist circumference (Figure 2C). Again, these findings suggest that BMI reflects metabolic risk beyond that predicted by total body fat content. At a given BMI, men and women appear to have similar metabolic risk.
Systolic blood pressures likewise are dependent on % body fat (Figure 3A). But for a given % body fat, men have higher blood pressures than women up to a level of marked obesity. It is possible that lower body fat in women has little effect on blood pressure. Support for this possibility can be seen by relationships with waist circumference (Figure 3B). In both men and women, systolic blood pressures essentially plateau in the higher ranges of waist circumference. Regardless, upper body obesity appears to be the major correlate of mean systolic blood pressures in both men and women. Similar results were obtained when blood pressures were plotted against BMI (Figure 3C).
Figure 3.
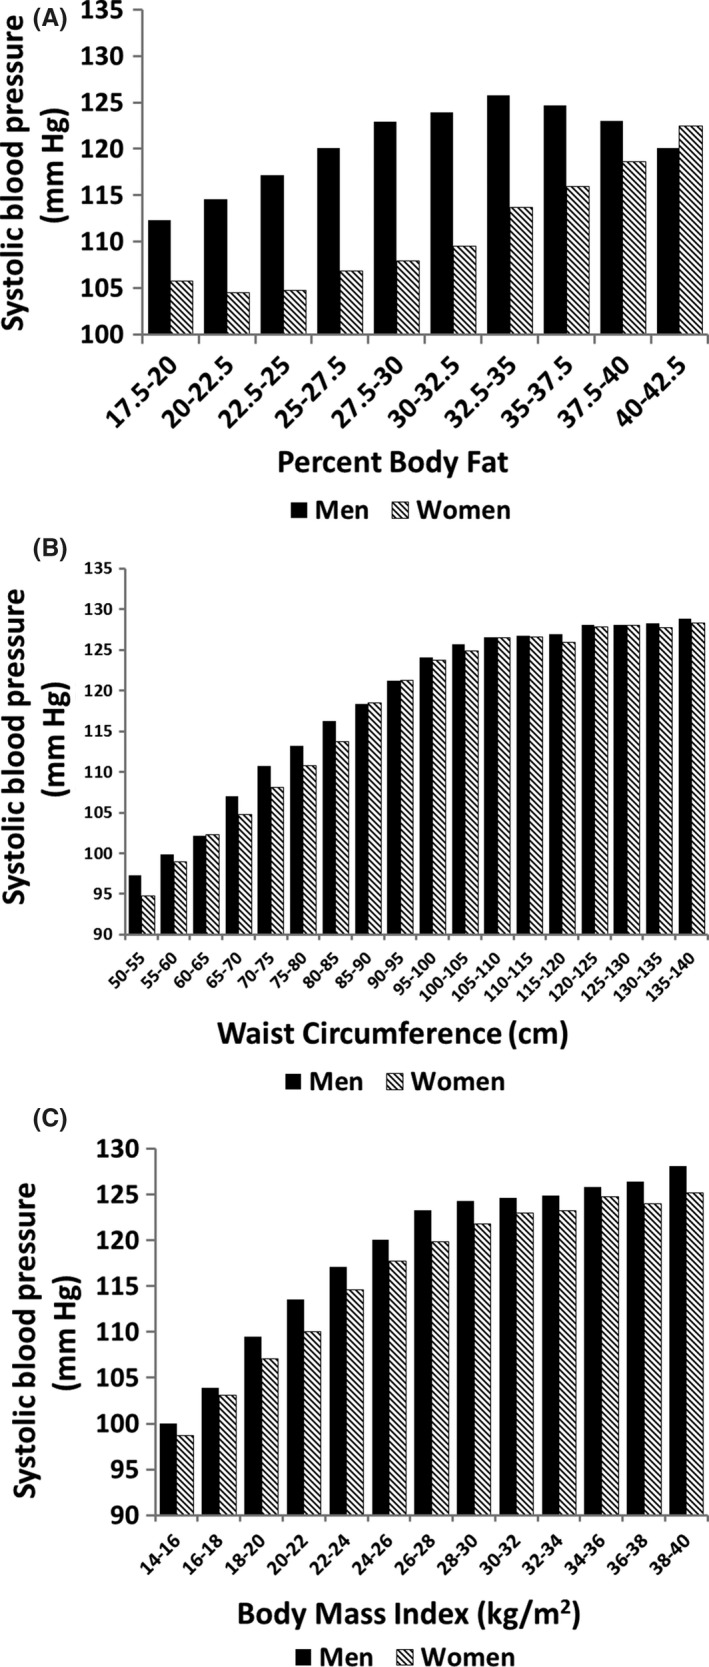
Relation of body fat parameters to systolic blood pressure: (A) percent body fat; (B) waist circumference; and (C) body mass index. Systolic blood pressure was significantly different between men and women across percent body fat (P = .001) but not across waist circumference or BMI (P = .99)
HDL‐C levels are inversely related to waist circumference in both men and women (Figure 4 A). But at the same waist circumference, women have higher HDL‐C levels than men. It is an established fact that Caucasian women have a higher HDL‐C than men. This difference watch first appears at puberty and is likely hormonally mediated.42 A similar pattern was noted for the plot of HDL‐C against BMI (Figure 4B).
Figure 4.
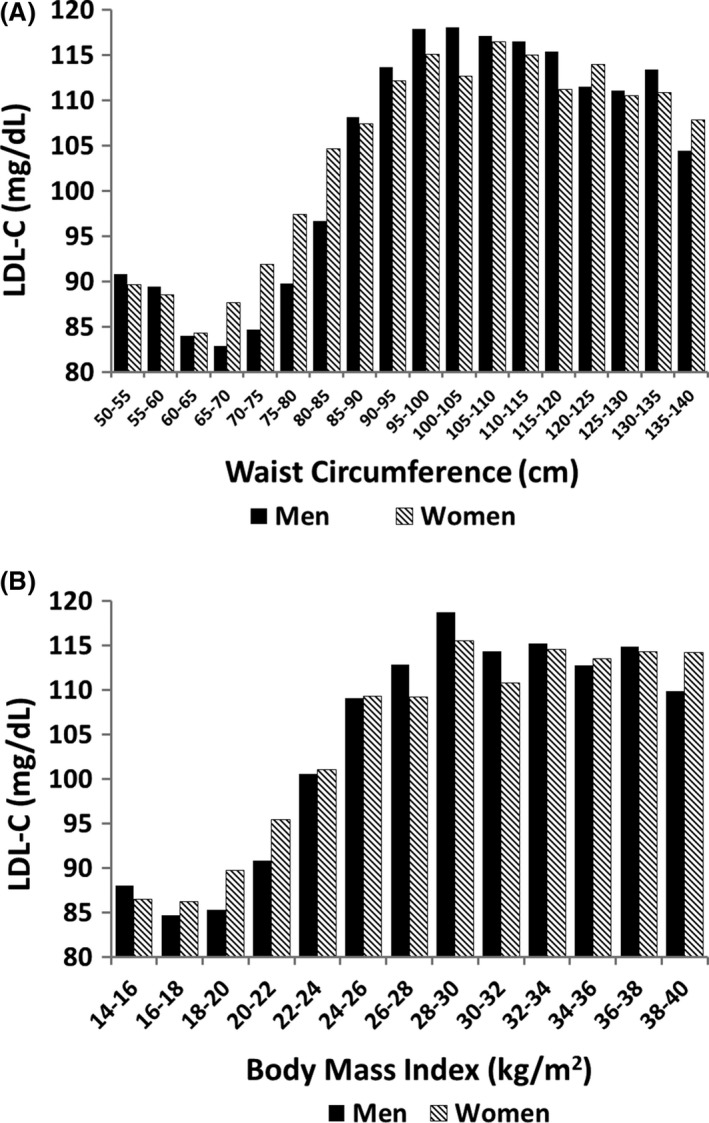
Relation of body fat parameters to LDL cholesterol: (A) percent body fat; and (B) waist circumference. There were no significant differences between LDL cholesterol levels in men and women across percent body fat or waist circumference (P = .99)
In contrast to the findings for HDL‐C, levels of LDL‐C were similar for men and women regardless of waist circumference (Figure 5A). At low waist circumference, LDL‐C concentrations were relatively low, but they plateaued when waist circumference levels rose to the moderate range. Importantly, men and women had similar mean LDL‐C levels across a broad range of waist circumferences. A similar pattern was noted in the plot of LDL‐C against BMI (Figure 5B).
Figure 5.
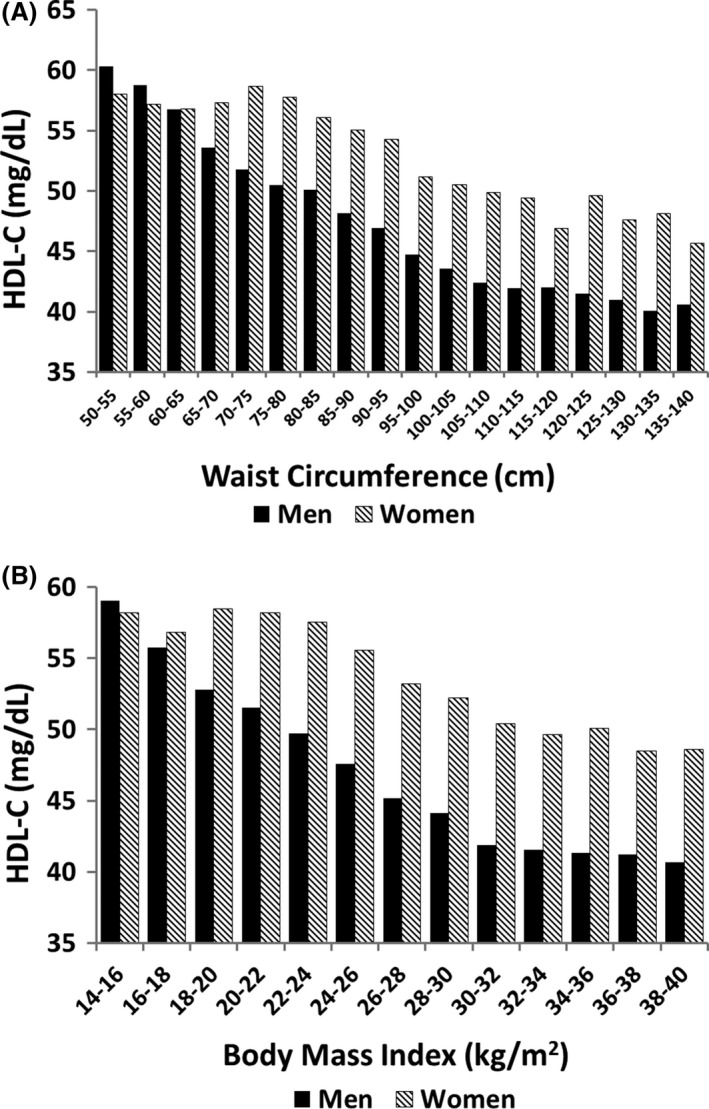
Relation of body fat parameters to HDL cholesterol: (A) percent body fat; and (B) waist circumference. There were significant differences in HDL cholesterol levels between men and women across waist circumference and BMI (P = .005)
Relationship between body fat content and C‐reactive protein (CRP) is presented in Figure 6A. In the lower range of % body fat, CRP levels were higher in men than women; but at higher % body fat, levels were similar. These findings suggest that CRP levels are more sensitive to upper body fat than to lower body fat; but at higher body fat content, total body fat presumably affects CRP levels similarly to upper body fat. At higher ranges of waist circumference, women have higher CRP than men (Figure 6B). The reason for this difference is not clear, but has been reported previously.43 For a given BMI, women also have higher CRP's than men, but both are dependent on BMI (Figure 6C). It is possible that factors other than body fat account for the difference in CRP concentrations between men and women. But the strong effect of body weight on CRP levels implies that increasing obesity is a major cause of elevated CRP.
Figure 6.
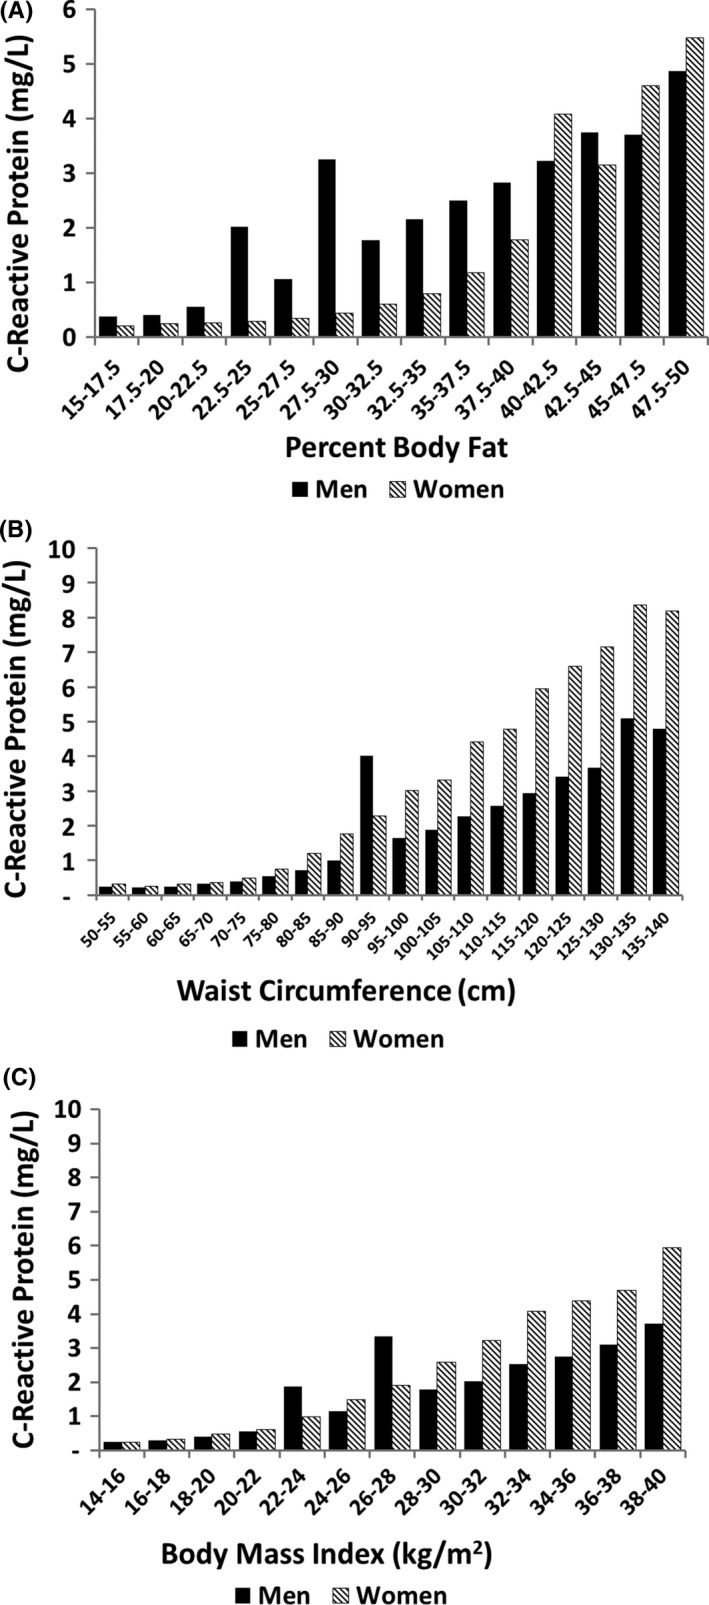
Relation of body fat parameters to C‐reactive protein: (A) percent body fat; (B) waist circumference; and (C) body mass index. There were significant differences in C‐reactive protein between men and women across waist circumferences (P = .04) but not across percent body fat or body mass index (P = .99)
4. DISCUSSION
Several tentative conclusions can be drawn from this analysis. First, it is clear that there is a striking difference between influences of whole body fat on metabolic risk factors in women compared to men. This difference disappeared when only upper body fat is considered. This difference most likely can be explained by the differential relationship of upper and lower body fat on risk factors.
A gender similarity in the relation between waist circumference and risk factor level in both men and women strongly implies that risk factors were strongly tied to upper body obesity, as reflected by waist circumference. The data indicate that there is no need for different cut‐points to define increased waste circumference in men and women. This contrasts to what is currently recommended.22, 29, 30, 31 For a diagnosis of metabolic syndrome, waist circumference cut‐points should be the same in men and women.
No sharp thresholds in waist circumference could be identified for defining abdominal obesity (upper body obesity). The relation between waist circumference and risk factors generally are graded and progressive. Any definition, therefore, must be arbitrary.
If visceral fat has a greater impact on metabolic risk factors than the upper body subcutaneous fat, one might expect that the influence of waist circumference on risk factors should be stronger for men than for women. Such was not the case. This implies that the adverse effects of upper body obesity on risk factors are similar for visceral and subcutaneous abdominal fat.
Consideration should be given to including CRP in the definition of metabolic syndrome.44 CRP can represent a marker for a pro‐inflammatory state, as it affects cardiovascular risk.45, 46, 47 Although women appear to have higher CRP levels than men, both rise progressively with increasing waist circumference. Other factors besides body fat must be in play to explain the higher CRP levels in women.
A limitation of this study was that only limited data were available on medication usage. Considering the large number of subjects in the study, it is doubtful that the results would be materially changed even if full medication use were available. Medications can affect metabolic risk factors, but they are rarely sufficient to normalize these factors.
Finally, although BMI is correlated with total body fat, the discordance between results for % body fat and BMI suggests that BMI affects metabolic risk factors in ways beyond body fat content. In fact, BMI appears to predict risk factors similarly to waist circumference. This finding supports the use of BMI as an alternative to waist circumference for defining the metabolic syndrome. The reason for this similarity in predictive power is not apparent. One possibility is that both BMI and upper body fat are indicative of nutritional status. Elevations in both BMI and waist circumference may belie an excess nutrient intake, which likely is the true culprit in causation of metabolic syndrome.
Grundy SM, Williams C, Vega GL. Upper body fat predicts metabolic syndrome similarly in men and women. Eur J Clin Invest. 2018;48:e12941 10.1111/eci.12941
REFERENCES
- 1. Grundy SM, Brewer HB Jr, Cleeman JI, Smith SC Jr, Lenfant C; American Heart Association ; National Heart, Lung, and Blood Institute . Definition of metabolic syndrome: report of the National Heart, Lung, and Blood Institute/American Heart Association conference on scientific issues related to definition. Circulation. 2004;109:433‐438. [DOI] [PubMed] [Google Scholar]
- 2. Alberti KG, Eckel RH, Grundy SM, et al. Harmonizing the metabolic syndrome: a joint interim statement of the International Diabetes Federation Task Force on Epidemiology and Prevention; National Heart, Lung, and Blood Institute; American Heart Association; World Heart Federation; International Atherosclerosis Society; and International Association for the Study of Obesity. Circulation. 2009;120:1640‐1645. [DOI] [PubMed] [Google Scholar]
- 3. WHO . Physical status: the use and interpretation of anthropometry. Report of a WHO Expert Committee. WHO Technical Report Series 854. Geneva, Switzerland: World Health Organization, 1995. [PubMed] [Google Scholar]
- 4. Expert Panel on the Identification, Evaluation, and Treatment of Overweight and Obesity in Adults . Executive summary of the clinical guidelines on the identification, evaluation, and treatment of overweight and obesity in adults. Arch Intern Med 1998;158:1855‐1867. [DOI] [PubMed] [Google Scholar]
- 5. World Health Organization . Report of a WHO consultation on obesity. Obesity: preventing and managing global epidemic. Geneva, Switzerland: World Health Organization, 1998. [PubMed] [Google Scholar]
- 6. Shah NR, Braverman ER. Measuring adiposity in patients: the utility of body mass index (BMI), percent body fat, and leptin. PLoS ONE. 2012;7:e33308. [DOI] [PMC free article] [PubMed] [Google Scholar]
- 7. Zanovec M, Wang J, O'Neil CE. Development and comparison of two field‐based body fat prediction equations: NHANES 1999–2004. Int J Exerc Sci. 2012;5:223‐231. [DOI] [PMC free article] [PubMed] [Google Scholar]
- 8. Wulan SN, Westerterp KR, Plasqui G. Ethnic differences in body composition and the associated metabolic profile: a comparative study between Asians and Caucasians. Maturitas. 2010;65:315‐319. [DOI] [PubMed] [Google Scholar]
- 9. WHO expert consultation . Appropriate body‐mass index for Asian populations and its implications for policy and intervention strategies. Lancet. 2004;363:157‐163. [DOI] [PubMed] [Google Scholar]
- 10. He W, Li Q, Yang M, et al. Lower BMI cutoffs to define overweight and obesity in China. Obesity (Silver Spring). 2015;23:684‐691. [DOI] [PubMed] [Google Scholar]
- 11. Kagawa M, Uenishi K, Kuroiwa C, Mori M, Binns CW. Is the BMI cut‐off level for Japanese females for obesity set too high? A consideration from a body composition perspective. Asia Pac J Clin Nutr. 2006;15:502‐507. [PubMed] [Google Scholar]
- 12. Farin HM, Abbasi F, Reaven GM. Comparison of body mass index versus waist circumference with the metabolic changes that increase the risk of cardiovascular disease in insulin‐resistant individuals. Am J Cardiol. 2006;98:1053‐1056. [DOI] [PubMed] [Google Scholar]
- 13. Ebron K, Andersen CJ, Aguilar D, et al. A larger body mass index is associated with increased atherogenic dyslipidemia, insulin resistance, and low‐grade inflammation in individuals with metabolic syndrome. Metab Syndr Relat Disord. 2015;13:458‐464. [DOI] [PubMed] [Google Scholar]
- 14. Yoon SH, Han KT, Kim SJ, et al. Combined effect of body mass index and body size perception on metabolic syndrome in South Korea: results of the fifth Korea National Health and Nutrition Examination Surveys (2010‐2012). BMC Public Health. 2015;15:554. [DOI] [PMC free article] [PubMed] [Google Scholar]
- 15. Gómez‐Ambrosi J, Silva C, Galofré JC, et al. Body mass index classification misses subjects with increased cardiometabolic risk factors related to elevated adiposity. Int J Obes (Lond). 2012;36:286‐294. [DOI] [PubMed] [Google Scholar]
- 16. Gómez‐Ambrosi J, Silva C, Galofré JC, et al. Body adiposity and type 2 diabetes: increased risk with a high body fat percentage even having a normal BMI. Obesity (Silver Spring). 2011;19:1439‐1444. [DOI] [PubMed] [Google Scholar]
- 17. Ho‐Pham LT, Campbell LV, Nguyen TV. More on body fat cutoff points. Mayo Clin Proc. 2011;86:584. [DOI] [PMC free article] [PubMed] [Google Scholar]
- 18. Lehr S, Hartwig S, Sell H. Adipokines: a treasure trove for the discovery of biomarkers for metabolic disorders. Proteomics Clin Appl. 2012;6:91‐101. [DOI] [PubMed] [Google Scholar]
- 19. Berg AH, Scherer PE. Adipose tissue, inflammation, and cardiovascular disease. Circ Res. 2005;96:939‐949. [DOI] [PubMed] [Google Scholar]
- 20. Jensen MD, Haymond MW, Rizza RA, Cryer PE, Miles JM. Influence of body fat distribution on free fatty acid metabolism in obesity. J Clin Invest. 1989;83:1168‐1173. [DOI] [PMC free article] [PubMed] [Google Scholar]
- 21. Nielsen S, Guo Z, Johnson CM, Hensrud DD, Jensen MD. Splanchnic lipolysis in human obesity. J Clin Invest. 2004;113:1582‐1588. [DOI] [PMC free article] [PubMed] [Google Scholar]
- 22. Karpe F, Pinnick KE. Biology of upper‐body and lower‐body adipose tissue—link to whole‐body phenotypes. Nat Rev Endocrinol. 2015;11:90‐100. [DOI] [PubMed] [Google Scholar]
- 23. Ritchie SA, Connell JM. The link between abdominal obesity, metabolic syndrome and cardiovascular disease. Nutr Metab Cardiovasc Dis. 2007;17:319‐326. [DOI] [PubMed] [Google Scholar]
- 24. Fontana L, Eagon JC, Trujillo ME, Scherer PE, Klein S. Visceral fat adipokine secretion is associated with systemic inflammation in obese humans. Diabetes. 2007;56:1010‐1013. [DOI] [PubMed] [Google Scholar]
- 25. Klein S. The case of visceral fat: argument for the defense. J Clin Invest. 2004;113:1530‐1532. [DOI] [PMC free article] [PubMed] [Google Scholar]
- 26. Jensen MD. Is visceral fat involved in the pathogenesis of the metabolic syndrome? Human model. Obesity (Silver Spring). 2006;14(Suppl 1):20S‐24S. [DOI] [PubMed] [Google Scholar]
- 27. Grundy SM, Neeland IJ, Turer AT, Vega GL. Waist circumference as measure of abdominal fat compartments. J Obes. 2013;2013:454285. [DOI] [PMC free article] [PubMed] [Google Scholar]
- 28. Petersen KF, Dufour S, Savage DB, et al. The role of skeletal muscle insulin resistance in the pathogenesis of the metabolic syndrome. Proc Natl Acad Sci U S A. 2007;104:12587‐12594. [DOI] [PMC free article] [PubMed] [Google Scholar]
- 29. Vega GL, Adams‐Huet B, Peshock R, Willett D, Shah B, Grundy SM. Influence of body fat content and distribution on variation in metabolic risk. J Clin Endocrinol Metab. 2006;91:4459‐4466. [DOI] [PubMed] [Google Scholar]
- 30. Søndergaard E, Gormsen LC, Nellemann B, Jensen MD, Nielsen S. Body composition determines direct FFA storage pattern in overweight women. Am J Physiol Endocrinol Metab. 2012;302:E1599‐E1604. [DOI] [PubMed] [Google Scholar]
- 31. Jensen MD. Role of body fat distribution and the metabolic complications of obesity. J Clin Endocrinol Metab. 2008;93(11 Suppl 1):S57‐S63. [DOI] [PMC free article] [PubMed] [Google Scholar]
- 32. Barber TM, Golding SJ, Alvey C, et al. Global adiposity rather than abnormal regional fat distribution characterizes women with polycystic ovary syndrome. J Clin Endocrinol Metab. 2008;93:999‐1004. [DOI] [PubMed] [Google Scholar]
- 33. Sokolov EI, Aleksandrovich OV, Shcheltsyna NV, et al. Low‐density lipoprotein subfractions during abdominal and gluteofemoral obesity. Bull Exp Biol Med. 2003;136:455‐457. [DOI] [PubMed] [Google Scholar]
- 34. Peppa M, Koliaki C, Hadjidakis DI, et al. Regional fat distribution and cardiometabolic risk in healthy postmenopausal women. Eur J Intern Med. 2013;24:824‐831. [DOI] [PubMed] [Google Scholar]
- 35. Tittelbach TJ, Berman DM, Nicklas BJ, Ryan AS, Goldberg AP. Racial differences in adipocyte size and relationship to the metabolic syndrome in obese women. Obes Res. 2004;12:990‐998. [DOI] [PubMed] [Google Scholar]
- 36. Wannamethee SG, Shaper AG, Morris RW, Whincup PH. Measures of adiposity in the identification of metabolic abnormalities in elderly men. Am J Clin Nutr. 2005;81:1313‐1321. [DOI] [PubMed] [Google Scholar]
- 37. Oda E, Kawai R. Comparison among body mass index (BMI), waist circumference (WC), and percent body fat (%BF) as anthropometric markers for the clustering of metabolic risk factors in Japanese. Intern Med. 2010;49:1477‐1482. [DOI] [PubMed] [Google Scholar]
- 38. Mooney SJ, Baecker A, Rundle AG. Comparison of anthropometric and body composition measures as predictors of components of the metabolic syndrome in a clinical setting. Obes Res Clin Pract. 2013;7:e55‐e66. [DOI] [PubMed] [Google Scholar]
- 39. Janssen I, Katzmarzyk PT, Ross R. Waist circumference and not body mass index explains obesity‐related health risk. Am J Clin Nutr. 2004;79:379‐384. [DOI] [PubMed] [Google Scholar]
- 40. Zhu S, Wang Z, Heshka S, Heo M, Faith MS, Heymsfield SB. Waist circumference and obesity‐associated risk factors among whites in the third National Health and Nutrition Examination Survey: clinical action thresholds. Am J Clin Nutr. 2002;76:743‐749. [DOI] [PubMed] [Google Scholar]
- 41. Levy JC, Matthews DR, Hermans MP. Correct homeostasis model assessment (HOMA) evaluation uses the computer program. Diabetes Care. 1998;21:2191‐2192. [DOI] [PubMed] [Google Scholar]
- 42. Eissa MA, Mihalopoulos NL, Holubkov R, Dai S, Labarthe DR. Changes in fasting lipids during puberty. J Pediatr. 2016;170:199‐205. [DOI] [PMC free article] [PubMed] [Google Scholar]
- 43. Khera A, Vega GL, Das SR, et al. Sex differences in the relationship between C‐reactive protein and body fat. J Clin Endocrinol Metab. 2009;94:3251‐3258. [DOI] [PMC free article] [PubMed] [Google Scholar]
- 44. Ridker PM, Wilson PW, Grundy SM. Should C‐reactive protein be added to metabolic syndrome and to assessment of global cardiovascular risk? Circulation. 2004;109:2818‐2825. [DOI] [PubMed] [Google Scholar]
- 45. Ridker PM, Hennekens CH, Buring JE, Rifai N. C‐reactive protein and other markers of inflammation in the prediction of cardiovascular disease in women. N Engl J Med. 2000;342:836‐843. [DOI] [PubMed] [Google Scholar]
- 46. Emerging Risk Factors Collaboration , Kaptoge S, Di Angelantonio E, Lowe G, Pepys MB, Thompson SG, Collins R, Danesh J. C‐reactive protein concentration and risk of coronary heart disease, stroke, and mortality: an individual participant meta‐analysis. Lancet. 2010;375:132‐140. [DOI] [PMC free article] [PubMed] [Google Scholar]
- 47. La Franca E, Caruso M, Sansone A, et al. Relationship between inflammatory markers and new cardiovascular events in patients with acute myocardial infarction who underwent primary angioplasty. Glob J Health Sci. 2013;5:48‐54. [DOI] [PMC free article] [PubMed] [Google Scholar]


