

Abstract
Shear‐induced hemolysis is a major concern in the design and optimization of blood‐contacting devices. Even with a small amount of mechanical stress, inflammatory reactions can be triggered in the cells. Blood damage is typically estimated using continuum fluid dynamics simulations. In this study, we report a novel cell damage index (CDI) obtained by simulations on the single‐cell level in a lattice Boltzmann fluid flow. The change of the cell surface area gives important information on mechanical stress of individual cells as well as for whole blood. We are using predefined basic channel designs to analyze and compare the newly developed CDI to the conventional blood damage calculations in very weak shear stress scenarios. The CDI can incorporate both volume fraction and channel geometry information into a single quantitative value for the characterization of flow in artificial chambers.
Keywords: Blood damage index, —Blood cell dynamics, —Cell activation, —Hemolysis, —Lattice Boltzmann method, —Immersed boundary method
When designing devices for circulatory support of patients, such as blood pumps or artificial organs that get into contact with blood, it is important to consider hemolysis caused by flow. Shear forces in the pulsatile flow, collisions with other blood cells, and the contact with the device surfaces can result in hemolysis. Even small amounts of nonphysiological mechanical stress can lead to inflammatory reactions in blood cells, which is an issue in cell sensitive applications, like dynamic cell culturing. Therefore, understanding the mechanical stimuli and the resulting stress on blood cells is important to design both microfluidic in vitro systems and critical parts of circulation‐assisting devices.
In this work, we introduce the cell damage index (CDI) as a relative measure for blood cell activation and/or damage. The main purpose of this study is to show that the CDI can be used to compare different microfluidic geometries with respect to their mechanical load on cells. Therefore, we chose simple geometries with an apparent effect on cell deformation. It is not the aim of the article to fully characterize microfluidic systems, but to demonstrate a new concept for a relative measure of blood cell damage.
The mechanical load is closely related to shear stress acting on the blood cells, which was used previously to estimate cell damage. Dimasi et al. 1 designed microfluidic channels which emulate given shear stress profiles. In our work, we use the deformation of the cell surface instead of this shear stress to compare the effect microfluidic channels have on the cells.
Applications, in which the knowledge of blood or cell damage is important, are heart assisted pumps or cardiovascular implants. In order to model the effect of shear stress in ventricular assist devices, Dimasi et al. 2 created microfluidic platforms designed in such a way that the shear stress of the microfluidic platform matches the stresses in the ventricular assist devices.
Consolo et al. measured the platelet activation in microfluidic devices in order to analyze mechanical circulatory support devices with respect to thrombotic risk 3.
There have been numerous attempts to quantify the blood cell damage. Lysis of red blood cells happens in milliseconds within large shear stress (>450 N/m2) whereas long exposure to lower shear stress (150 N/m2) may also damage the cell 4. Working with small blood volumes in for example, microfluidic systems, short perfusion times and having only low shear forces, prevents the use of standard characterization methods, like hemolysis measurements or up‐regulation of inflammatory protein markers. In previous work, we have established a setup to measure the blood cell activation by following intracellular calcium transients, presumably caused by applied mechanical stress on the cell membrane 5. Current limiting factors, like the missing time information of actual cell stimulation to the first calcium burst and the lack of understanding of varying frequency and amplitude of the transients, prevents the method from being used as a quantitative measurement tool for blood cell activation.
Using computer simulations, the damage of blood cells can be estimated based on the fact that constant uniform shear stress can be related to free hemoglobin in plasma 6. The driving force for the development of calculation schemes has been the design and fabrication for artificial heart pumps [ventricular assist devices 7]. A power law‐based equation by Giersiepen et al. 8 can be used to calculate the hemolysis of erythrocytes.
| (1) |
In the computation, the shear stress τ is integrated over the exposure time t to obtain the so‐called blood damage index (BDI), which is an estimate for hemolysis index, HI(%). The integration can be done over the whole fluidic domain (Eulerian approach) or following the fluidic pathways (more‐often used Lagrangian approach), which mimic the trajectories of blood cells 6. The constants C, a and b used in the equation need to be calibrated using experimental data with specific application and fluidic properties, for example, range of Reynolds number, in mind. An overview of various Lagrangian formulations is given by Li et al. 9 or Taskin et al. 6 Due to the simplicity of power law‐based equations and fast computations, major contributions have been made within this top‐down approach, yet still, the computational results cannot accurately predict hemolysis 6.
Another drawback of the BDI computation is the difficult applicability in microfluidic systems. From literature, we know that the apparent blood viscosity is decreasing drastically below tube diameters of about 500 µm 10. At such dimensions, especially relevant in the vascular system, the Fahraeus‐Lindqvist effect is responsible for the viscosity drop 11. Erythrocytes travel near the center, whereas plasma is left near the wall. This effect is not present in BDI calculations, as in uniform fluid no cell‐free layer can occur.
In this work, we use the change of blood damage indices of different microfluidic channel geometries and compare it with the change of the newly introduced CDI. The blood damage indices are used only for relative comparison and not for prediction of hemolysis or cell activation.
In contrast to the power law‐based equations, a strain‐based model has been investigated by several research teams. Here, the deformations of individual cells are quantified using simple models of blood cells to estimate the hemolysis in whole blood [e.g., 12]. A similar approach is used by 13. They use a stress tensor description of an elastic ellipsoid to mimic blood flow. No cell–cell/cell–boundary interactions are taken into account. Also 14 looks at the hemolysis at cell scale and considers deformations of cells by measuring their axial and transversal diameters; however, it only applies the information on flow velocity directly at the cell and does not consider the behavior of the cell in flow or cell–cell interactions. Moreover, this approach still relies heavily on the commonly used hemolysis indices. Conversely, there are much more detailed investigations, for example, 15, 16, which model formation of pores in the cell membrane and actual release of hemoglobin into the blood plasma.
Top‐down or bottom–up, both ways try to estimate the actual damage of blood cells by comparing it to the release of free hemoglobin in large shear force regimes. Right now, using the state‐of‐the‐art quantification methods, the blood cell activation, without destruction of the cell membrane, can only be measured with large blood volumes and long perfusion times.
Recently, we have developed a computational model of individual red blood cells, represented by boundary meshes of elastically interacting nodes 17, 18. The cell model is implemented in a lattice Boltzmann fluid dynamics code using an immersed boundary method with full two‐way coupling 19. Due to this accurate cell model [validations have been performed with stretching experiments from literature 20] and fast computations using the parallelized fluid dynamics code, the model of the red blood cell can be used to support the strain‐based bottom–up approach. The information on the individual object level can be used to obtain information on the hemolysis of whole blood as well as the stress on single blood cells. Especially with very weak shear forces (too low to cause serious damage the membrane), the stress on the model membrane can be used to quantitatively compare different channel geometries and to find the system with the least contribution to the blood cells activation.
Using computer simulations, the stress on cells can be analyzed under various conditions without the time‐consuming testing of microfluidic systems or artificial devices. It is possible to independently vary parameters and quantify their effect on the blood cell damage and/or activation. Based on our previous findings 5, we demonstrate a proof of concept with the potential to aid the future optimization and design of microfluidic in vitro systems and critical parts of circulation‐assisting devices.
Content of the article
The article is focused on the computational analysis of single cell flow in well‐defined microfluidic channels. We introduce the CDI, which includes effects of fluid, channel walls of the device and mutual interactions among cells. It is not immediately clear, which changes of the object (and there are several to choose from) should be tracked and incorporated into the CDI. We do not have information on local stress on the cell membrane during deformation from biological experiments. According to 21, the destruction of the cell membrane can occur immediately, when a specific threshold of relative increase of cell surface is achieved. Also, as shown by 4, a smaller increase of cell membrane area, if lasting long enough, can damage the cell membrane. Therefore, we infer that the increase in cell surface has a major effect on the cell activation and/or damage. With this idea in mind, we propose an index, which includes both magnitude of cell surface change and duration of this change. We analyze the CDI to obtain statistically significant results and compare the values to Lagrangian BDI calculations (stress along streamlines). Furthermore, we show the advantage of using the CDI, due to additional information obtained from the individual cells.
Methods and Models
Simulations setup
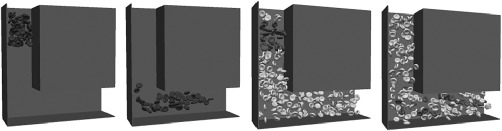
For the comparison of established BDI calculations and the newly proposed CDI, we decided to analyze simple microfluidic geometries (Fig. 1). Simulation parameters are listed in Table 1. Using the same square channel cross section, we varied the bend between light lines in Fig. 1.
Figure 1.
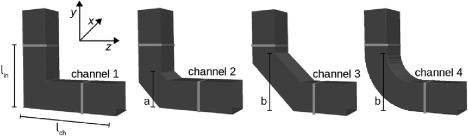
Channel geometry for testing and comparing the cell damage index (CDI) and blood damage index (BDI). The channel cross section is the same for each channel, whereas the region of interest (between the light lines) is varied. The blood cells are randomly seeded on the top left corner above the line l in.
Table 1.
Simulation parameters of the fluid, red blood cells, and the channel geometries
| Parameter | Value | Unit | |
|---|---|---|---|
| Blood | Velocity mean | 0.02 | m/s |
| Density | 1060 | kg/m3 | |
| Dynamic viscosity | 3.5 | mPa·s | |
| Reynolds number Re | 0.23 | ||
| Red blood cells * | Diameter | 7.82 | µm |
| IB nodes | 141 | ||
| Mass IB node † | 8.4e‐15/141 | kg | |
| Fluidic friction | 3.65e‐9/141 | ||
| Time step Δt | 10 | µs | |
| Elastic coefficients | Stretching k s | 0.0044 | |
| Bending k b | 0.0715 | ||
| Local area k al | 0.005 | ||
| Global area k ag | 1.0 | ||
| Volume k v | 1.25 | ||
| Channel geometry | Cross section | 38 × 38 | (µm)2 |
| Length channel l ch, inlet l in | 140, 85 | µm | |
| Bending position a, b | 50, 80 | µm |
At the beginning of the simulations, the blood cells are randomly seeded and rotated in the top cube of the vertical channel (above the light line), whereas the rest of the channel is empty. Model parameters for the red blood cells are listed in Table 1. The fluid is flowing from the top inlet to the outlet on the right with a mean velocity of 0.02 m/s [typical value taken from biological experiments 22]. With a Reynolds number of 0.23, the flow is strictly laminar.
We want to predict the quality of a microfluidic channel in terms of stress on blood cells. Current hemolysis indices deliver a single value for a fluidic system. We would like to extend this concept so that the new index takes into account local cell information with accurate blood rheology in microfluidic systems, while not necessarily damaging the blood cell membrane (low shear stress scenarios). For comparison of different microfluidic systems and different blood damage indices, we do not know how much mechanical stress actual parts of the channel induce on the blood cells. We just get the information that one system (as a whole, like a black box) induces more or less stress than another one. Therefore, we do not mind that the trajectories are longer for the cells in channel 1 compared to channel 3.
Continuum fluid dynamics
The microfluidic geometry used for the simulations is designed with the open‐source Salome platform (http://www.salome-platform.org, accessed January 10, 2018). A tetrahedral mesh is generated from each geometry and feeds the open‐source finite element solver ElmerFEM (http://www.csc.fi/web/elmer, accessed January 10, 2018). Here, we compute steady state pressure and velocity fields inside the given geometry. The obtained results are visualized using ParaView (http://www.paraview.org, accessed January 10, 2018), which is an open‐source, multiplatform data analysis and visualization application. In ParaView, we also generate fluidic streamlines, from which we can integrate the shear stress τ. Fluid parameters (density, viscosity) are set for whole blood.
Single blood cell dynamics
For the computation of single red blood cells, we use the open source platform ESPResSo 23, which is aimed for soft matter research. We have added a framework for elastic objects in the lattice Boltzmann fluid dynamics code 19. The objects are represented by a boundary mesh of elastically interacting nodes, which are bidirectionally coupled to the surrounding plasma. The velocity information from the fluid is transferred to the boundary nodes of the cells and the forces obtained by the equation of motion (elastic deformation, movement, cell–cell collisions) are transferred back to the lattice Boltzmann equation, which computes the velocity in the system. The parameters of the red blood cells are listed in Table 1. Physiologically, red blood cells would have a certain size distribution and different elastic properties according to their age, health, and surrounding environment 24; however, as typically done in computational studies [e.g., by Fedosov et al. 25, 26], we assume uniformity. Also, we are not simulating the full volumetric content of blood cells in whole blood due to the computational demand. We are limiting the number of blood cells in the simulation box and increasing the surrounding fluid to the same density and viscosity as whole blood.
Validation of single blood cell model
To establish confidence in the computational model, one can simulate real experiments with single cells and compare simulated and experimental behavior. We have performed calibration studies based on experimental data from stretching experiments of individual red blood cells 20. In these experiments, two silica beads are attached to the opposite sides of a red blood cell. One silica bead is attached to the channel surface and the other is being trapped by optical tweezers and pulled with a well‐defined force. For different values of this force, the principal dimensions of the red blood cell are measured along transversal and longitudinal directions. The data in 20 demonstrate the dependence of the cell deformation on the stretching force.
Our computational model is based on five elastic moduli: stretching , bending and local area modulus cover local properties of a membrane while global area and volume modulus keep global properties of the cell such as they preserve the cell's surface and its volume. The corresponding elastic coefficients must be properly set so that the model represents real cells well enough. To this aim, the data from the stretching experiments reported in 20 may be used. In our initial study 17, we set up a computational experiment where the opposite sides of the cell were pulled with given forces and the response of the cell was observed in terms of longitudinal and transversal diameter of the cell. The computational data was compared to those from biological experiments and correct values of model parameters were identified. However, since then, the model has undergone several changes and the latest calibration revealed the parameters of elastic coefficients presented in Table 1.
This way we confirmed sufficient accuracy of the model concerning the cell deformation.
Indices and theory
The amount of blood cell damage can be quantified using different computational approaches. In models based on continuum fluid dynamics, the BDI is computed from the velocity streamlines. On the other side, single cell dynamics allows the evaluation of deformation for each individual cell. We consider the two approaches.
Blood damage index
We are using Lagrangian approaches for calculating the blood damage in the given microfluidic geometry. We apply a power law based on the calculation of the HI(%) in Eq. (1). Whereas in Eq. (1) it is assumed that the shear stress τ on the blood cells is constant over the total exposure time t, the stress varies with time and position in the microfluidic channel. In order to account for the time and space dependence we consider small time intervals Δti with constant shear stress τi. This is done for a certain number N lines of streamlines from the inlet to the outlet of the device. By integrating over time and averaging over the streamlines 12 different blood damage indices (BDIi) can be defined. The blood damage indices defined in literature 6, 9 differ by the way the integrant is defined.
We are using three different approaches of computing the BDI in accordance to 6 and 9.
Integration of Eq. (1) fails to estimate hemolysis; therefore, several groups used its time derivative. No damage history is included in the calculation.
- Summation of the linearized damage 28:
(3)
In order to overcome the nonlinearity in time of Eq. (1), a linearized damage is introduced.
- Accumulation of the time derivative of a defined mechanical dose 29:
(4)
The summation is done with the whole mechanical dose until time step i (damage history) and the mechanical dose within .
The scalar shear stress is calculated by the obtained velocity field and its stress tensors τ with components τij [von Mises criterion used by 30].
| (5) |
In Eqs. (2), (4), we are applying the power law constants by Giersiepen et al. 8 (C = 3.62e‐5; a = 0.785; b = 2.416) due to an applicable shear stress range lower than 250 Pa, whereas other constants [overview is given in 6] change the results only marginally. Note that some research groups choose the multiplicative constant for obtaining a HI from 0 to 100% [C = 3.62e‐5 in e.g., 6 and 9], whereas others calculate a value between 0 and 1 [C = 3.62e‐7 in for example, 13 and 28].
We use 840 streamlines uniformly distributed at the inlet of the channels.
Cell damage index
For the estimation of the blood cell damage using individual cells, we have defined the following indices. Their mutual relationships are depicted in Fig. 2.
Figure 2.
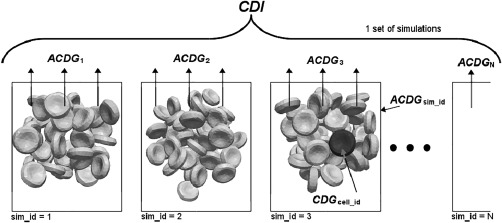
Scheme of relationships between CDI, ACDGsim_id, and CDGcell_id.
- cumulative deviation of global area for one cell CDGcell_id
(6)
Si is the current global area of the cell; S 0 is the original area of the cell (in relaxed state) and is the current absolute relative change of global area. The sum is computed for each cell in the monitored region of the channel with constant time steps Δt. For coarser time discretization, we would have fewer terms in the sum, but they would be multiplied by a larger time step. Therefore, CDG values with fine and coarse time discretizations should be comparable up to the deformations that are not resolved any more with the larger time step.
Also note that while in BDI we look at shear stress over time, here we are looking at relative change of area over time, which is like strain over time. In principle, the stress resulting from this strain could be obtained by performing pointwise calculations.
- average cumulative deviation of global area from all tracked cells in one simulation ACDGsim_id
(7)
where n cell is the number of cells in a simulation, for which we track CDGcell_id
- extended CDI as arithmetic mean of ACDGsim_id from a set of simulations with the same channel geometry
(8)
where N sim is the number of simulations in the set, for which we calculate the index. Each simulation starts with a random position of the cells.
Results and Discussion
In initial simulations, we show that the proposed indices for the CDI are statistically significant. Further on, we compare the computed blood cell damage for channels 1–4 using continuum BDI and the newly developed CDI. The advantage of the individual cell simulations is demonstrated afterwards. Leverett et al. 4 reported, that in large shear stress (300 Pa), the change of hematocrit (volumetric content of red blood cells in whole blood) has no effect on hemolysis. In our simulations, we are using only a fraction of the reported shear stress (about 10 Pa). We can see that under such conditions, the cell–cell interactions have an impact on the resulting CDI, as they also contribute to the surface deformation (while not necessarily to cell damage, but presumably to cell activation).
Analysis of CDI
At first, we are interested in the hypothesis that CDGcell_id depends on the initial position and rotation of the cell. We compute ACDGsim_id for channel 1 with 10 cells, the standard deviation σ(CDGcell_id), minimum and maximum values of CDGcell_id (Table 2). The resulting damage has a large variance (σ(CDGcell_id) > 70% of ACDGsim_id); therefore, we conclude that CDGcell_id depends strongly on the initial position and rotation.
Table 2.
ACDGsim_id for channel 1 with 10 cells, standard deviation σ, minimum, and maximum from all values CDGcell_id
| ACDGsim_id | σ(CDGcell_id) | min(CDGcell_id) | max(CDGcell_id) |
|---|---|---|---|
| 0.084 | 0.062 | 0.023 | 0.241 |
In order to reduce the variance, we analyze a set of 10 simulations with 10 cells each (with random initial positions). The resulting CDI is obtained by averaging the 10 simulation results ACDGsim_id (first line in Table 3). Again, the standard deviation σ(ACDGsim_id) is calculated from these values (this time it is 18% of CDI). Minimum and maximum values are closer to the CDI as well. Averaging a set of simulations for a given geometry is necessary to obtain a good approximation of the CDI.
Table 3.
CDI for channel 1 for a set of 10 simulations with 10, 30, and 50 cells each, standard deviation σ, minimum, and maximum from all values ACDGsim_id
| Blood cells | CDI | σ(ACDGsim_id) | min (ACDGsim_id) | max (ACDGsim_id) |
|---|---|---|---|---|
| 10 | 0.087 | 0.016 | 0.064 | 0.121 |
| 30 | 0.116 | 0.012 | 0.101 | 0.137 |
| 50 | 0.148 | 0.009 | 0.131 | 0.163 |
In the next step, we increase the number of cells for each simulation to see the influence on the CDI and its standard deviation σ(ACDGsim_id) (Table 3). Apparently due to mutual cell interactions the CDI is increasing with more cells in the system (more information on cell–cell interactions are provided in Sections "Influence of cell‐cell interactions and “Change of hematocrit”). σ(ACDGsim_id) is decreasing with more cells in the system to only 6% of CDI with 50 cells per simulation. Applying a linear extrapolation suggests a trend to a converged value of CDI (Fig. 3).
Figure 3.
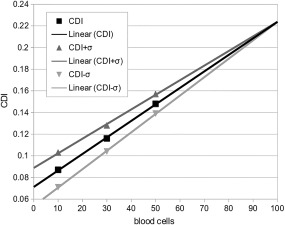
The CDI and its standard deviation are shown for an increased number of blood cells. A converged value of CDI can be observed with a linear extrapolation.
In Fig. 4, we show the CDI comparison of channels 1–4 using 50 cells in each simulation (10 values of ACDGsim_id per channel). With the exception of channel 4, 80% of ACDGsim_id are in the interval CDI ± 1σ. With more than 30 cells in each simulation, we get a clear indication of the stress load for each channel (CDI(ch 1) < CDI(ch 2) < CDI(ch 3)) with a further reduction of the standard deviation σ. Interestingly, channel 4 shows a larger damage than channel 3, despite a “smoother” bending. One of the possible explanations is that the length of cell trajectories is responsible for this difference, so more damage accumulates.
Figure 4.
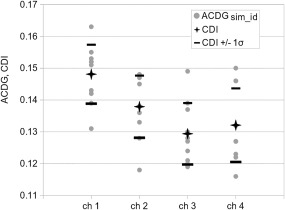
The following values are given for each channel: ACDGsim_id (points)—10 simulations in one set (50 cells each); CDI (stars)—average of ACDGsim_id; (CDI − σ) and (CDI + σ) (lines), where σ is the standard deviation of ACDGsim_id.
One thing to keep in mind is that we are talking about relative differences between channel geometries. Occurring stress on the blood cell membranes can but not necessarily lead to blood cell damage. The comparison can give an indication on the quality of each channel, which is the relative difference of blood cell activation and/or damage. According to Fig. 3, we assume a linear trend to a converged CDI, therefore, the relative difference between each channel CDI will not be affected by an increased number of blood cells.
Comparison of CDI and BDI
The BDI is not meant to measure the mechanical stress on blood cells in very weak shear stress scenarios. It is basically only an estimation of actual blood cell damage and as demonstrated by Taskin in 6, there are scenarios when BDI power law equations cannot accurately predict hemolysis. Nevertheless, we are comparing our newly developed CDI and commonly used BDI equations by the relative difference of channel geometries quality. The relative difference of channel quality or the ranking, which geometry will have the least contribution to blood cell activation, shall be comparable.
In Table 4, we compare the relative change of all channels to each channel 1 using the CDI (Eq. (8), 50 cells per simulation, 10 simulations per channel) and BDI1 to BDI3 (Eqs. (2), (3), (4)). The ranking of channel quality is the same for all blood damage calculations with a maximum deviation between the calculation schemes of less than 3%. Clearly, the trend is the same for CDI and BDI computations, but especially in channel 2 the CDI shows a smaller relative damage than the BDI results. One explanation could be that streamlines of the BDI calculations pass the channel walls much closer than the blood cells would [Fahraeus‐Lindqvist effect 11]. Especially in microfluidic systems, a transition of viscosity is seen due to this effect. And the shear stress in typical parabolic flow is maximal close to the channel walls. With “smoother” bends of the channel, the CDI and the individual BDIs approach each other, because the streamlines describe the trajectories of blood cells much better.
Table 4.
Comparison of CDI and BDI1 to BDI3 for channels 1–4 with their ratios to reference values (channel 1)
| Ch. | CDI | CDI/CDIref | BDI1 | BDI1/BDI1ref | BDI2 | BDI2/BDI2ref | BDI3 | BDI3/BDI3ref |
|---|---|---|---|---|---|---|---|---|
| 1 | 0.148 | 1.000 | 8.027e‐5 | 1.000 | 8.255e‐5 | 1.000 | 8.127e‐5 | 1.000 |
| 2 | 0.138 | 0.932 | 7.707e‐5 | 0.960 | 7.880e‐5 | 0.955 | 7.756e‐5 | 0.954 |
| 3 | 0.129 | 0.872 | 6.891e‐5 | 0.859 | 7.048e‐5 | 0.854 | 6.926e‐5 | 0.852 |
| 4 | 0.132 | 0.892 | 7.158e‐5 | 0.892 | 7.289e‐5 | 0.883 | 7.168e‐5 | 0.882 |
Influence of cell–cell interactions
In the previous sections, we placed the blood cells right next to the channel inlet and started the simulations. Now we are filling also the rest of the channel with cells, so that the cells of interest are in contact with other cells right away (Fig. 5). For comparison, we are using channel 1 only.
Figure 5.
Initial and intermediate position of cells in an empty channel (on the left) and with a fully filled channel (on the right). The tracked cells are depicted darker.
As expected, mutual interactions of cells change the stress occurring on the blood cells. Table 5 shows the difference of CDI and the standard deviation σ of the filled channel and the empty one. The positions of the cells throughout the simulations were about the same, so the velocity of the fluid should be comparable. That means that the surrounding cells only marginally change the speed of the cells. Even though the velocities are comparable, the CDI for the completely filled channel is higher, which is most likely caused by the cell–cell interactions.
Table 5.
CDI for empty and full channel 1 is given as ratio to the reference value as well as the standard deviations σ(ACDGsim_id) of the individual channel simulations and their ratio to CDI
| Channel 1 | CDI | CDI/CDIref | σ(ACDGsim_id) | σ(ACDGsim_id)/CDI |
|---|---|---|---|---|
| Empty | 0.148 | 1.000 | 0.009 | 0.063 |
| Full | 0.185 | 1.251 | 0.015 | 0.081 |
The full channel simulation represents a hematocrit Ht of 5%.
Change of hematocrit
Increasing the number of cells in the channel (increasing the volume fraction of red blood cells in whole blood) has an effect on the resulting CDI. We fill channel 1 with a certain number of cells to obtain a hematocrit of 5, 10, and 15% (Fig. 6). Again, we compute 10 simulations with random starting positions of the cells and calculate the CDI.
Figure 6.
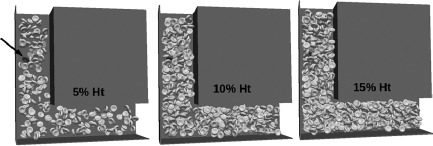
Snapshots from simulations with hematocrit Ht of 5, 10, and 15%. The black arrow shows the cell, which is examined more closely later in Fig. 7.
The results in Table 6 show that with larger volume fraction of red blood cells, the CDI is increasing, which confirms the previous findings. The standard deviation σ(ACDGsim_id) is decreasing, which means that the difference between the individual simulation results gets smaller with more cells included in the simulation (denser cell packing). Consequently, with larger hematocrit, we need fewer simulations to achieve the same accuracy of CDI.
Table 6.
CDI for channel 1 with hematocrit Ht of 5, 10, and 15% is shown as ratio to reference values
| Ht | CDI | CDI/CDIref | σ(ACDGsim_id) | σ(ACDGsim_id)/CDI |
|---|---|---|---|---|
| 5% | 0.185 | 1.000 | 0.015 | 0.081 |
| 10% | 0.278 | 1.503 | 0.017 | 0.061 |
| 15% | 0.360 | 1.946 | 0.007 | 0.019 |
The standard deviations σ(ACDGsim_id) calculated from 10 values ACDGsim_id and their ratios to CDI are shown as well.
To understand the increase of CDI, we follow a single cell for each simulation with hematocrit of 5, 10, and 15% (similar starting position). Its velocity profile and occurring cell damage CDGcell_id are shown in Fig. 7. Trajectories and velocities are in a similar range, yet the cell damage is significantly different. This difference can be explained by local fluctuations of the cell velocity, caused by the interactions with other cells. Fluidic forces from the plasma as well as interaction forces from surrounding cells are acting on the cell, resulting in small steep changes of the velocity profile. Throughout the channel, the cell is exposed to local fluctuations, which cumulates the damage with time (and with distance). Here again, the cells do not necessarily need to be damaged, but the cumulative contribution to the cell activation is captured. As a consequence, it can be used as a comparative characteristic to evaluate a channel geometry, especially for dense flows, and not as an absolute quantity.
Figure 7.
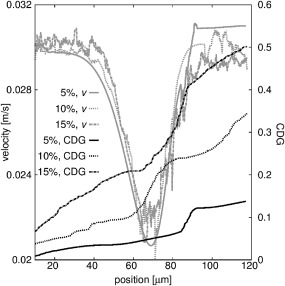
The velocity of a single cell is shown for simulations in channel 1 with hematocrit of 5, 10, and 15%—light lines (the cell is highlighted in Fig. 6). The cumulative damage of this cell CDGcell_id is shown with dark lines on the right axis. The position of the cell is the absolute distance to its initial starting position.
Conclusion
In this work, we have proposed and examined a novel method for evaluating cell damage in microfluidic channels. The method relies on detailed information on the deformations of individual cells. With this method, the increase of the cell's surface is evaluated and summed up over the cell population and over time. With the experimental results of hemolysis reporting that hemolysis occurs for an increased surface above a certain threshold 21, one can use the relative increase in the cell's surface as an indicator for cell damage. The limitation of this approach is that we do not know how much damage occurs for a specific relative increase of the cells' surfaces. This is however not a disadvantage when the overall aim is a relative comparison of different geometries. Even without proper evaluation of the absolute damage, one can decide which channel geometry causes more or less damage.
We have compared the proposed damage index to known blood damage calculations and concluded that while it generally shows the same trends, it also gives us much more detailed information on the single cell level. This might be especially useful in the design of critical parts of blood pumps or other sensitive microfluidic devices, as well as in the optimization of existing microfluidic in vitro systems.
Author Contributions
Markus Gusenbauer: model development, concept/design, data collection, data analysis/interpretation, drafting article, approval of article. Renáta Tóthová: model development, data collection, data analysis/interpretation, drafting article. Giulia Mazza: data analysis/interpretation. Martin Brandl: critical revision of article, approval of article. Thomas Schrefl: critical revision of article, approval of article. Iveta Jančigová: model development, data analysis/interpretation, critical revision of article. Ivan Cimrák: model development, data analysis/interpretation, critical revision of article, approval of article.
Acknowledgments
The authors gratefully acknowledge the financial support of the NÖ Forschungs‐ und Bildungsges.m.b.H. (NFB) through the Life Science Calls (Project ID: LSC13‐024). Iveta Jančigová and Renáta Tóthová were supported by the Slovak Research and Development Agency (contract number APVV‐15‐0751). Ivan Cimrák was supported by the Ministry of Education, Science, Research and Sport of the Slovak Republic (contract number VEGA 1/0643/17).
References
- 1. Dimasi A, Rasponi M, Sheriff J, et al. Microfluidic emulation of mechanical circulatory support device shear‐mediated platelet activation. Biomed Microdevices 2015;17:117. [DOI] [PMC free article] [PubMed] [Google Scholar]
- 2. Dimasi A, Rasponi M, Consolo F, et al. Microfludic platforms for the evaluation of anti‐platelet agent efficacy under hyper‐shear conditions associated with ventricular assist devices. Med Eng Phys 2017;48:31–8. [DOI] [PMC free article] [PubMed] [Google Scholar]
- 3. Consolo F, Dimasi A, Rasponi M, et al. Microfluidic approaches for the assessment of blood cell trauma: a focus on thrombotic risk in mechanical circulatory support devices. Int J Artif Organs 2016;39:184–93. [DOI] [PubMed] [Google Scholar]
- 4. Leverett L, Hellums J, Alfrey C, Lynch E. Red blood cell damage by shear stress. Biophys J 1972;12:257–73. [DOI] [PMC free article] [PubMed] [Google Scholar]
- 5. Gusenbauer M, Mazza G, Brandl M, et al. Sensing platform for computational and experimental analysis of blood cell mechanical stress and activation in microfluidics. Procedia Eng 2016;168:1390–3. [Google Scholar]
- 6. Taskin ME, Fraser KH, Zhang T, Wu C, Griffith BP, Wu ZJ. Evaluation of Eulerian and Lagrangian models for hemolysis estimation. ASAIO J 2012;58:363–72. [DOI] [PubMed] [Google Scholar]
- 7. Fraser KH, Taskin ME, Griffith BP, Wu ZJ. The use of computational fluid dynamics in the development of ventricular assist devices. Med Eng Phys 2011;33:263–80. [DOI] [PMC free article] [PubMed] [Google Scholar]
- 8. Giersiepen M, Wurzinger LJ, Opitz R, Reul H. Estimation of shear stress‐related blood damage in heart valve prostheses in‐vitro comparison of 25 aortic valves. Int J Artif Organs 1990;13:300–6. [PubMed] [Google Scholar]
- 9. Li H, Ruan X, Qian W, Fu X. Numerical estimation of hemolysis from the point of view of signal and system. Artif Organs 2014;38:1065–75. [DOI] [PubMed] [Google Scholar]
- 10. Pries AR, Neuhaus D, Gaehtgens P. Blood viscosity in tube flow: dependence on diameter and hematocrit. Am J Physiol 1992;263:H1770–8. [DOI] [PubMed] [Google Scholar]
- 11. Fåhræus R, Lindqvist T. The viscosity of the blood in narrow capillary tubes. Am J Physiol 1931;96:562–8. [Google Scholar]
- 12. Arora D, Behr M, Pasquali M. A tensor‐based measure for estimating blood damage. Artif Organs 2004;28:1002–15. [DOI] [PubMed] [Google Scholar]
- 13. Pauli L, Nam J, Pasquali M, Behr M. Transient stress‐ and strain‐based hemolysis estimation in a simplified blood pump. Int J Numer Method Biomed Eng 2013;29:1148–60. [DOI] [PMC free article] [PubMed] [Google Scholar]
- 14. Ezzeldin HM, Tullio MD, Vanella M, Solares SD, Balaras E. A strain‐based model for mechanical hemolysis based on a coarse‐grained red blood cell model. Ann Biomed Eng 2015;43:1398–409. [DOI] [PubMed] [Google Scholar]
- 15. Sohrabi S, Liu Y. A cellular model of shear‐induced hemolysis. Artif Organs 2017;41:E80–91. doi: 10.1111/aor.12832. [DOI] [PMC free article] [PubMed] [Google Scholar]
- 16. Vitale F, Nam J, Turchetti L, et al. A multiscale, biophysical model of flow‐induced red blood cell damage. AIChE J 2014;60:1509–16. [Google Scholar]
- 17. Cimrák I, Gusenbauer M, Schrefl T. Modelling and simulation of processes in microfluidic devices for biomedical applications. Comput Math Appl 2012;64:278–88. [Google Scholar]
- 18. Jančigová I. Modeling elastic objects in fluid flow with biomedical applications. Inf Sci Technol 2015;8:22. [Google Scholar]
- 19. Cimrák I, Gusenbauer M, Jančigová I. An ESPResSo implementation of elastic objects immersed in a fluid. Comput Phys Commun 2014;185:900–7. [Google Scholar]
- 20. Mills JP, Qie L, Dao M, et al. Nonlinear elastic and viscoelastic deformation of the human red blood cell with optical tweezers. Mech Chem Biosyst 2004;1:169–80. [PubMed] [Google Scholar]
- 21. Evans EA, Waugh R, Melnik L. Elastic area compressibility modulus of red cell membran. Biophys J 1976;16:585–95. [DOI] [PMC free article] [PubMed] [Google Scholar]
- 22. Bukowska DB, Derzsi L, Tamborski S, Szkulmowski M, Garstecki P, Wojtkowski M. Assessment of the flow velocity of blood cells in a microfluidic device using joint spectral and time domain optical coherence tomography. Opt Express 2013;21:24025–38. [DOI] [PubMed] [Google Scholar]
- 23. Arnold A, Lenz O, Kesselheim S, et al. Espresso 3.1: molecular dynamics software for coarse‐grained models In Griebel M, Schweitzer MA, eds. Meshfree Methods for Partial Differential Equations VI. Berlin, Heidelberg: Springer, 2013;1–23. [Google Scholar]
- 24. Baskurt OK, Hardeman MR, Rampling MW. Handbook of Hemorheology and Hemodynamics. Amsterdam, DC: IOS press, 2007;69. [Google Scholar]
- 25. Fedosov DA, Pan W, Caswell B, Gompper G, Karniadakis GE. Predicting human blood viscosity in silico. Proc Natl Acad Sci USA 2011;108:11772. [DOI] [PMC free article] [PubMed] [Google Scholar]
- 26. Fedosov DA, Caswell B, Karniadakis GE. A multiscale red blood cell model with accurate mechanics, rheology, and dynamics. Biophys J 2010;98:2215–25. [DOI] [PMC free article] [PubMed] [Google Scholar]
- 27. Zimmer R, Steegers A, Paul R, Affeld K, Reul H. Velocities, shear stresses and blood damage potential of the leakage jets of the Medtronic Parallel bileaflet valve. Int J Artif Organs 2000;23:41–8. [PubMed] [Google Scholar]
- 28. Garon A, Farinas M‐I. Fast three‐dimensional numerical hemolysis approximation. Artif Organs 2004;28:1016–25. [DOI] [PubMed] [Google Scholar]
- 29. Grigioni M, Morbiducci U, D'Avenio G, Di Benedetto G, Del Gaudio C. A novel formulation for blood trauma prediction by a modified power‐law mathematical model. Biomech Model Mechanobiol 2005;4:249–60. [DOI] [PubMed] [Google Scholar]
- 30. Bludszuweit C. Three‐dimensional numerical prediction of stress loading of blood particles in a centrifugal pump. Artif Organs 1995;19:590–6. [DOI] [PubMed] [Google Scholar]