Abstract
Investigation of protein–ligand interactions is crucial during early drug‐discovery processes. ATR‐FTIR spectroscopy can detect label‐free protein–ligand interactions with high spatiotemporal resolution. Here we immobilized, as an example, the heat shock protein HSP90 on an ATR crystal. This protein is an important molecular target for drugs against several diseases including cancer. With our novel approach we investigated a ligand‐induced secondary structural change. Two specific binding modes of 19 drug‐like compounds were analyzed. Different binding modes can lead to different efficacy and specificity of different drugs. In addition, the k obs values of ligand dissociation were obtained. The results were validated by X‐ray crystallography for the structural change and by SPR experiments for the dissociation kinetics, but our method yields all data in a single and simple experiment.
Keywords: ATR-FTIR, binding kinetics, biosensors, conformational changes, HSP90
The detailed understanding of ligand‐induced conformational changes at high spatiotemporal resolution within a protein is of fundamental interest.1, 2 As the established biophysical methods that provide such information (X‐ray crystallography, NMR spectroscopy) are very time and material consuming, new biophysical techniques are emerging which aim for a faster delivery of information on conformational changes.3 However, all of these techniques deliver either indirect information about conformational changes related to changes in the hydrodynamic diameter (surface acoustic waves,4 electroswitchable DNA chip5) or depend on labeling the protein in the correct position (second harmonic generation6). Infrared (IR) spectroscopy, however, provides specific information on conformational changes in a label‐free and time‐resolved manner by utilizing the sensitivity of the absorption frequency of protein amide I bands towards the secondary structure.7 This correlation between the IR spectrum and protein structure enables direct molecular interpretation of the spectra and thereby allows different types of ligand‐induced conformational changes to be dissected. As attenuated total reflection (ATR) IR spectroscopy features a surface‐based detection principle, it permits the use of flow‐through systems and, therefore, offers the possibility to investigate reversible ligand–protein interactions.8
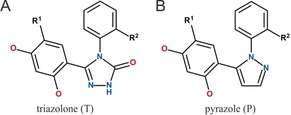
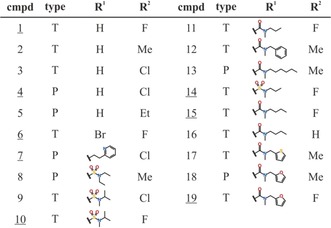
In particular, multiple reflection ATR measurements performed on thin films of proteins immobilized on germanium IREs allow for a broad spectral region to be analyzed (4000–900 cm−1) as well as a signal‐to‐noise ratio high enough for detecting reversible ligand interactions. Recently, we established a robust method to specifically immobilize his‐tagged and lipidated proteins on germanium IREs through binding to solid‐supported lipid bilayers9, 10 and to nitrilotriacetic acid (NTA) groups attached to planar surfaces as well as to dextran brushes based on self‐assembled monolayers (SAMs) of silanes or thiols.11, 12, 13, 14 This recent breakthrough allowed us to use ATR‐FTIR spectroscopy as a flow‐through‐based sensor of conformational change to examine the conformational effects of binding resorcinol scaffold inhibitors to the molecular chaperone heat‐shock protein 90 (HSP90). HSP90 consists of three domains and works as a dimer in promoting the correct folding of other proteins.15 The N‐terminal domain (HSP90 NTD, 25 kDa), which was analyzed in this study and will subsequently be referred to as HSP90, comprises an ATP binding pocket located between α‐helix 2, α‐helix 3, and the central β‐sheet (Figure 1 A). As HSP90 is a target for cancer treatment, several HSP90 inhibitors that affect this binding pocket are currently being evaluated in clinical trials.16 In the course of the drug‐discovery process, certain inhibitors were found to stabilize the formation of a transient subpocket, thereby resulting in a loop‐to‐helix transition in α‐helix 3.17, 18 This ligand‐induced conformational change can be seen as a typical effect when exploring additional interactions next to established ligand‐binding pockets, which is often driven to increase the specificity of drug effects by an increase in selectivity.19 To explore this inhibitor‐induced conformational change we performed ATR‐FTIR measurements of a total of 19 resorcinol inhibitors with two kinds of scaffolds, triazolones and pyrazoles, each with two different substituents R1 and R2 (Table 1). For six of the thirteen triazolones and for two of the six pyrazoles, X‐ray cocrystal structures exist that show the respective effects of loop versus helix stabilization on the HPS90 binding pocket. Based on this data, the compounds can be subdivided into two groups: loop binders and helix binders (Figure 1 B). The kinetic data from surface plasmon resonance (SPR) measurements together with the structural data were used for validation of our IR‐based sensor of conformational change.
Figure 1.
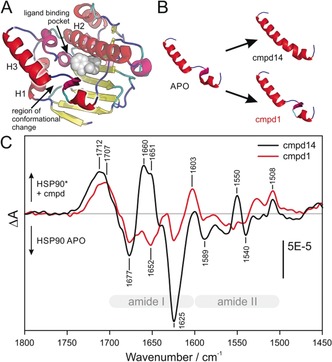
Conformational change in the ATP binding pocket of HSP90 NTD induced by different types of inhibitors. A) The NTD of HSP90 APO (1YER) is shown schematically. The secondary structure assignment was achieved with the STRIDE algorithm22 and the different structures were colored according to the following schema: β‐sheet (yellow), random coil (blue), α‐helices (red), 310‐helix (magenta), and turn (cyan). The position of the ligand binding pocket is illustrated by addition of the loop binder cmpd 1 (gray spheres). B) Only helix 3 of the HSP90 APO structure (1YER) and the cocrystal structures of HSP90 in complex with cmpd 14 (PDB ID 5J27) and cmpd 1 (PDB ID 5J64) are shown. The binding of cmpd 14 leads to a secondary structure change in helix 3, turning the helix‐loop‐helix motif into a continuous helix conformation. In contrast, the binding of cmpd 1 does not significantly change the secondary structure. C) Compound interaction spectra of cmpds 14 and 1 represent the absorbance difference spectra of the immobilized HSP90 with and without the respective compounds and are therefore the sum of the HSP conformational change spectra and the compound absorbance spectra. The frequency of the positive band at 1660–1650 cm−1 in the interaction spectrum with cmpd 14 is characteristic for helix secondary structures and can thereby be assigned to the completed helix 3.
Table 1.
The resorcinol scaffold HSP90 inhibitors used in this study have two types of scaffolds, triazolones (A) and pyrazoles (B), and vary in the substitutions R1 and R2. The compounds (cmpd) are sorted first according to their known and expected conformational effect on HSP90 and then with increasing residence time (listed in Table S3).
|
The compound interaction experiments were conducted after modification of the germanium IRE surface in several steps to yield the protein‐capturing NTA layer followed by subsequent immobilization of HSP90 on this layer (as described previously,12 see Figure S1 and experimental procedures for details). The time series of obtained difference spectra were analyzed using the multivariate curve resolution alternating least square (MCR‐ALS) method20 to extract the spectra corresponding to the ligand‐induced conformational change and their respective kinetics (see Figure S5 and experimental procedures for details). This type of difference spectrum is the sum of the spectrum of the change in the secondary structure of the protein and the intrinsic absorbance of the compound, and is further referred to as the compound interaction spectrum.
We first compared the binding effects of compounds (cmpd) 1 and 14 on HSP90 because of their common triazolone scaffold, with a single variation in the R1 group, but different binding modes. From the observation of the cocrystal structures of HSP90 in complex with compounds 1 and 14, they are classified as loop and helix binders, respectively.
Figure 1 C shows the compound interaction spectra of cmpds 1 and 14, which represent the difference in the absorbance spectra of the HSP90 APO spectrum and the spectrum of HSP90 bound to the respective compounds (HSP90 cmpd−HSP90 APO). Both compound interaction spectra show positive and negative bands in the conformationally relevant amide I (1700–1600 cm−1) and amide II regions (1600–1500 cm−1) as well as a positive band at approximately 1710 cm−1. The compound interaction spectrum of the helix binder cmpd 14 shows distinct positive bands at 1660 and 1651 cm−1, whereas the spectrum for cmpd 1 does not. The spectral region of 1665–1650 cm−1 is characteristic for the amide I absorption of helical secondary structures, such as α‐helices and 310‐helices.21 Additionally, the positive band at 1550 cm−1, which represents the amide II absorbance of α‐helices,21 is present only in the compound interaction spectrum of cmpd 14 and not in that of cmpd 1. This indicates that cmpd 14 induces the formation of an α‐helix, a finding that is in accordance with structural data (Figures 1 B, S1). Interestingly, the helix band present in the spectrum of cmpd 14 consists of two sub‐bands at 1660 and 1651 cm−1, which suggests the formation of two distinct helical structures. A reason for this might be the bend in the newly formed helical part (Figure 1 B) or the dynamic interconversion between several different helix conformations (see Figure S7 for details).
The compound interaction spectra of cmpds 1 and 14 have negative bands of similar intensity at 1677 cm−1, the characteristic absorbance frequency for turn secondary structures. As negative absorbance bands stand for a loss of the absorbing species in difference to the previous (=APO) state, this means that the number of turn structure residues is lowered by compound binding. For cmpd 14, one can deduce that the increase in the helical content is accompanied by a decrease in turn structure. This conformational change from turn to α‐helix is supported by the differences in the secondary structure assignments extracted from the X‐ray data of HSP90 APO and the cocrystal structure of HSP90 in complex with cmpd 14 (Figure S4).
The position of the band around 1710 cm−1 is slightly different for cmpd 14 (1712 cm−1) and cmpd 1 (1707 cm−1). The origin of this band is the carbonyl vibration of the triazolone group, as clearly demonstrated by comparing the interaction spectra of all the examined pyrazole and triazolone compounds (Figure S7).
The interaction spectrum of cmpd 14 shows a negative band at 1625 cm−1 which can be assigned to a loss of β‐sheet secondary structure (Figure 1 C). Although this finding is not supported by X‐ray data (see Figure S4), probably because of a lack of dynamic information, it was found in MD simulations that the binding of cmpd 14 presumably leads to a destabilization of the first strand of the central β‐sheet (residues 17–21).23 A second explanation might be a compound‐induced perturbation of the backbone of D93 located in the middle of the β‐sheet, which was seen in NMR experiments.24 This negative β‐sheet band also exists in the interaction spectrum of cmpd 1 but, with about one‐third of the respective absorbance, is much less intense.
These spectral observations fit well to the secondary structure assignments extracted from X‐ray data and clearly show that flow‐through‐based ATR‐FTIR spectroscopy can be applied for detecting conformational changes.
To further validate the predictive power of ATR‐FTIR for the detection of conformational changes, we performed compound interaction measurements on three loop‐binder (cmpds 1, 4, and 6) and five helix‐binder (cmpds 7, 10, 14, 15, and 19) compounds (Table 1), as assigned by X‐ray structural analysis (see Ref. 23 and this work). The compound interaction spectra of all eight compounds are shown in Figure S6 (black spectra).
The helix‐binder interaction spectra share a similar pattern of a positive band in the helix region of the amide I band at 1662–1652 cm−1 and a smaller but significant positive band in the α‐helix region of the amide II region at 1550 cm−1 (Figures 1 C and S6). These helix bands do not exist in any of the loop–binder interaction spectra. The negative β‐sheet band at 1624 cm−1 and the negative turn band at 1677 cm−1 which were discussed above are also present in all the helix‐binder interaction spectra, their intensities, however, vary. An additional positive band at 1637 cm−1 and a negative band at 1642 cm−1 can be assigned to further minor changes in random coil and β‐sheet secondary structures.
The intensity of the bands in the amide I region are different for the various helix binders. This is mainly caused by changes in the OH bending band of water, which leads to broad signal offsets (compare Figure S10). The shape of the α‐helix double band varies in the interaction spectra of the different helix binders, which might be due to a varying degree of helix stabilization (see Figure S7 for details).
To assign a certain compound to the helix‐ or loop‐binder group based on the compound interaction spectra, we used the integral of the spectral region from 1677 to 1642 cm−1 as a marker (Figure S6). These limits were chosen because they mark the nearest minima next to the helix bands in the 1660–1650 cm−1 region, thus ensuring complete capture of a potential amide I helix band. Figure 2 shows a bar chart of the obtained helix signal area values. For all the X‐ray‐validated helix binders (cmpds 7, 10, 14, 15, and 19) this integration leads to large helix area values between 0.04 and 0.084, whereas the X‐ray‐validated loop binders (cmpds 1, 4, and 6) show at least eight times smaller helix area values below 0.005 (Figure 2). By using a cutoff value of 0.02, which is approximately the middle of the maximum loop‐binder and minimum helix‐binder signals, we were able to correctly assign all eight X‐ray‐validated compounds to their respective groups.
Figure 2.
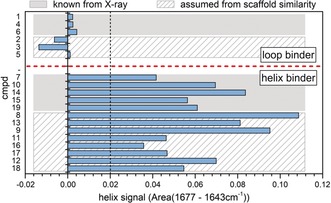
Identifying the conformational activity of inhibitors by analysis of amide I difference bands. Helix signal area values were extracted from the compound interaction spectra of helix binders by integration of the helix signal region as shown in Figure S6. The compounds are grouped according to secondary structure information known from X‐ray data of cocrystals of HSP90–inhibitor complexes (gray boxes, Figure S4). The agreement of the helix signal area values with the secondary structure information of HSP90–inhibitor complexes clearly validates the approach. By using a cutoff of 0.02, a prediction of the inhibitor type (helix or loop binder) for inhibitors with an unknown binding mode (shaded boxes) can be made without prior knowledge. The scaffold similarities among the compounds (Table 1) indicate that the predictions are correct.
In the next step, we assigned 11 further compounds based on the intensity of the helix band. For these compounds, no structural data were available. The corresponding spectra are shown in gray (Figure S6). Based on the chosen cutoff value, cmpds 2, 3, and 5 are loop binders, while cmpds 8, 9, 11, 12, 13, 16, 17, and 18 are helix binders (Figure 2). Indeed, cmpds 2, 3, and 5 have only a single atom as R1, as found for all X‐ray‐validated loop binders. On the other, all the newly assigned helix binders have a larger substituent as R1, the same as all the X‐ray‐validated helix binders. This scaffold similarity further demonstrates that our ATR‐FTIR approach can easily determine the binding mode based on small but distinct conformational differences.
Besides signals based on conformational changes, the compound interaction spectra also contain intrinsic absorption bands of the compounds. These bands report on local conditions in the binding pocket, for example, the involvement of structured water molecules,25 and can thereby help in the characterization of the compound binding mode. From a comparison of all the compound interaction spectra we found that the band near 1710 cm−1 can be clearly attributed to the triazolone carbonyl vibration (see Figure S7). This argument is supported by additional DFT calculations and normal mode analysis, which was utilized for computing the absorbance frequencies of compounds in water. The position of the triazolone band varies between 1715 and 1695 cm−1, but is independent of the helix‐ or loop‐binder grouping. The variable position together with the remarkable bandwidth of the triazolone C=O band (FWHH of ca. 30 cm−1) indicate a broad variation in the H‐bonding geometries of the carbonyl oxygen atom. The shift in the absorption of cmpd 1 from 1702 to 1710 cm−1 upon binding (compare Figure 1 C and S2B), indicates weaker hydrogen bonding with bound cmpd 1 compared to cmpd 1 in water. In fact, the triazolone carbonyl group points out of the binding pocket and is hydrogen bonded to K58 and water molecules located in a water network between the presumably dynamic α‐helix 3 and α‐helix 2 on top of the binding pocket (Figure S3). A more detailed analysis, including DFT calculations of the ligand, was performed for cmpds 9 and 10 and further signals were assigned (Figure S8). The excellent agreement of the theoretical and experimental frequency differences of the chlorophenyl versus fluorophenyl substitution in R2 demonstrates the detail of information included in the compound interaction spectra.
As we performed the measurements in a surface‐based flow‐through setup, we were able to resolve the compound‐induced conformational effects in a time‐resolved manner. MCR‐ALS analysis of the time series of infrared difference spectra resulted in the compound interaction spectra containing the conformational change information (as analyzed above) and a concentration profile containing kinetic information about the compound–protein interactions (see Figure S5). The concentration profiles of all the helix‐binder experiments were fitted with a segmented fit describing the three experimental phases: prewash, compound addition, and wash phase (see the Supporting Information for details). The observed signal decay rate k obs was obtained from a monoexponential fit of the wash phase. This observed decay rate k obs is coupled to the k off rate, but can differ when there are mass‐transfer effects. Figure 3 A shows the concentration profiles of three helix binders (cmpds 8, 14, and 18) that exhibit fast, medium, and slow signal decays (relative to the time resolution of the experiments), respectively, together with their corresponding fits. The observed rate constants of the signal decay (k obs) for these compounds were (1.7±0.4)×10−4 s−1 for cmpd 8, (8.1±1.1)×10−5 s−1 for cmpd 14, and (7.9±2.0)×10−5 s−1 for cmpd 18. To evaluate the potential of our infrared‐based flow‐through sensor to systematically deliver kinetic information we analyzed the data of all the helix binders in the same way as described above. The obtained k obs values were compared with reference k off values obtained from surface plasmon resonance (SPR) spectroscopic measurements (see the Supporting Information and Ref. 23). Figure 3 B shows a scatter plot of the reciprocal values of k obs(ATR) and the reciprocal dissociation rate constants k off(SPR) together with their respective uncertainty and a linear fit of the data. With a correlation coefficient R 2 of 0.948, the 1/k obs(ATR) values strongly correlate with the 1/k off(SPR) reference values.
Figure 3.
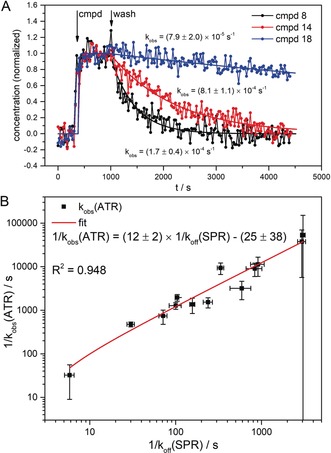
Kinetics of ensemble conformational change. A) Exemplary concentration profiles of the conformational change spectra of the interaction between HSP90 and three different helix binders (cmpds 8, 14, and 18). The concentration profiles were obtained from MCR‐ALS analysis of the respective time series of infrared difference spectra. After 5 minutes of prewash, the compounds were flushed over the surface for 10 minutes at a concentration of 5 μm followed by a washing step of 60 minutes. The smooth lines represent the three‐segmented fit of the concentration profiles (see the experimental procedures). The observed decay rates k obs(ATR) were obtained from monoexponential fits of the wash segments B) Concentration profiles of 13 helix binder compounds were analyzed as described above and the obtained average k obs(ATR) values plotted in reciprocal values against the reference k off values from SPR experiments. With a correlation coefficient R 2 of 0.948, the ATR‐derived residence times strongly correlate with the SPR reference values. The 1/k obs(ATR) values are 12 times lower than the 1/k off(SPR) values, which most likely comes from mass‐transport limitation caused by the large surface area and high protein loading in the ATR experiment.
We found that the uncertainties in the k obs(ATR) values are low for helix binders in the mid‐range of the analyzed kinetics. In the case of faster binders, the higher uncertainty values are caused by the low time resolution (20 s per spectrum) which was chosen to obtain spectra with sufficient signal to noise ratios. Higher uncertainty values for slow binders result from the wash time limit of 1 h, which leads to incomplete signal decays and hence non‐optimal exponential fits. It was found that the reciprocal observed rate constants 1/k obs(ATR) representing the dissociation kinetics are 12 times lower than the SPR‐derived reference values. This is due to mass‐transfer limitations caused by the large sensor surface26 of approximately 300 mm2 as well as the high protein surface loading, both of which are necessary to gain the required signal‐to‐noise level in the ATR‐approach. The very strong linear correlation of k obs values from ATR with the k off values from SPR experiments demonstrate that our approach is well‐suited for the systematic investigation of ligand dissociation kinetics.
In conclusion, we have applied ATR‐FTIR spectroscopy to analyze the conformational effects of 19 resorcinol scaffold inhibitors with two distinct conformational binding modes (helix and loop binder) on HSP90. A remarkable set of reference data consisting of eight X‐ray structures and a complete set of SPR kinetic data (both partly taken from Ref. 23 and partly generated for this study) was used for comparison to allow a robust validation of this novel methodological approach. The conformational effects of the analyzed inhibitors were determined correctly for all compounds with existing X‐ray data. Furthermore, the binding modes of 11 additional inhibitors were determined for the first time. The kinetic values k obs showed strong correlation with k off values from SPR experiments. Moreover, this method provides a deeper understanding of the properties of the binding pocket by enabling a detailed analysis of the characteristics of the compound absorbance bands. Our work demonstrates the first systematic application of an infrared‐spectroscopy‐based flow‐through sensor for the label‐free and time‐resolved detection of ligand‐induced conformational changes.
The dynamic, conformational, and chemical information provided by this method will help to improve the understanding of the mechanisms involved in protein–ligand interactions, especially the parameters determining the k off values. Particularly when scaled up in an automated screening platform, our method could be used to identify new drug candidates in the early drug‐discovery process.
Experimental Section
The X‐ray cocrystal structures of cmpds 4 and 7 were prepared as described previously23 for the other compounds (cmpds 1, 6, 10, 14, 15, and 19). SPR experiments on cmpds 4, 5, 7, and 8 were conducted as described previously23 for the other compounds (cmpds 1–3, 6, and 9–19). For details and further experimental information see the Supporting Information.
Conflict of interest
The authors declare no conflict of interest.
Supporting information
As a service to our authors and readers, this journal provides supporting information supplied by the authors. Such materials are peer reviewed and may be re‐organized for online delivery, but are not copy‐edited or typeset. Technical support issues arising from supporting information (other than missing files) should be addressed to the authors.
Supplementary
Acknowledgements
This work was supported by the EU/EFPIA Innovative Medicines Initiative (IMI) Joint Undertaking, K4DD (grant no. 115366). This publication reflects only the authors’ views and neither the IMI nor the European Commission is liable for any use that may be made of the information contained herein. We thank Steffen Wolf for help with the DFT calculations, Jutta Güldenhaupt for help with the manuscript, and Daria Kokh and Jörg Bomke for helpful discussions.
J. Güldenhaupt, M. Amaral, C. Kötting, J. Schartner, D. Musil, M. Frech, K. Gerwert, Angew. Chem. Int. Ed. 2018, 57, 9955.
References
- 1. Teague S. J., Nat. Rev. Drug Discovery 2003, 2, 527–541. [DOI] [PubMed] [Google Scholar]
- 2. Copeland R. A., Future Med. Chem. 2011, 3, 1491–1501. [DOI] [PubMed] [Google Scholar]
- 3. Renaud J.-P., Chung C.-W., Danielson U. H., Egner U., Hennig M., Hubbard R. E., Nar H., Nat. Rev. Drug Discovery 2016, 15, 679–698. [DOI] [PubMed] [Google Scholar]
- 4. Heym R. G., Hornberger W. B., Lakics V., Terstappen G. C., Biochim. Biophys. Acta Proteins Proteomics 2015, 1854, 979–986. [DOI] [PubMed] [Google Scholar]
- 5. Langer A., Hampel P. A., Kaiser W., Knezevic J., Welte T., Villa V., Maruyama M., Svejda M., Jähner S., Fischer F., Strasser R., rant U., Nat. Commun. 2013, 4, 2099, [DOI] [PMC free article] [PubMed] [Google Scholar]; 10.1038/ncomms3099. [DOI]
- 6. Moree B., Connell K., Mortensen R. B., Liu C. T., Benkovic S. J., Salafsky J., Biophys. J. 2015, 109, 806–815. [DOI] [PMC free article] [PubMed] [Google Scholar]
- 7. Goormaghtigh E., Cabiaux V., Ruysschaert J. M., Subcell. Biochem. 1994, 23, 405–450. [DOI] [PubMed] [Google Scholar]
- 8. Hassler N., Baurecht D., Reiter G., Fringeli U. P., J. Phys. Chem. C 2011, 115, 1064–1072. [Google Scholar]
- 9. Güldenhaupt J., Rudack T., Bachler P., Mann D., Triola G., Waldmann H., Kötting C., Gerwert K., Biophys. J. 2012, 103, 1585–1593. [DOI] [PMC free article] [PubMed] [Google Scholar]
- 10. Pinkerneil P., Güldenhaupt J., Gerwert K., Kötting C., ChemPhysChem 2012, 13, 2649–2653. [DOI] [PMC free article] [PubMed] [Google Scholar]
- 11. Schartner J., Güldenhaupt J., Mei B., Rögner M., Muhler M., Gerwert K., Kötting C., J. Am. Chem. Soc. 2013, 135, 4079–4087. [DOI] [PubMed] [Google Scholar]
- 12. Schartner J., Gavriljuk K., Nabers A., Weide P., Muhler M., Gerwert K., Kötting C., ChemBioChem 2014, 15, 2529–2534. [DOI] [PubMed] [Google Scholar]
- 13. Schartner J., Hoeck N., Güldenhaupt J., Mavarani L., Nabers A., Gerwert K., Kötting C., Anal. Chem. 2015, 87, 7467–7475. [DOI] [PubMed] [Google Scholar]
- 14. Nabers A., Ollesch J., Schartner J., Kötting C., Genius J., Hafermann H., Klafki H., Gerwert K., Wiltfang J., Anal. Chem. 2016, 88, 2755–2762. [DOI] [PubMed] [Google Scholar]
- 15. Taipale M., Jarosz D. F., Lindquist S., Nat. Rev. Mol. Cell Biol. 2010, 11, 515–528. [DOI] [PubMed] [Google Scholar]
- 16.M. Tatokoro, F. Koga, S. Yoshida, K. Kihara, 2015, 10.17179/excli2014-586. [DOI]
- 17. Wright L., Barril X., Dymock B., Sheridan L., Surgenor A., Beswick M., Drysdale M., Collier A., Massey A., Davies N., et al., Chem. Biol. 2004, 11, 775–785. [DOI] [PubMed] [Google Scholar]
- 18. Immormino R. M., Kang Y., Chiosis G., Gewirth D. T., J. Med. Chem. 2006, 49, 4953–4960. [DOI] [PubMed] [Google Scholar]
- 19. Stank A., Kokh D. B., Fuller J. C., Wade R. C., Acc. Chem. Res. 2016, 49, 809–815. [DOI] [PubMed] [Google Scholar]
- 20. Tauler R., Chemom. Intell. Lab. Syst. 1995, 30, 133–146. [Google Scholar]
- 21. Goormaghtigh E., Cabiaux V., Ruysschaert J. M., Subcell. Biochem. 1994, 23, 329–362. [DOI] [PubMed] [Google Scholar]
- 22.H. Zhu, DSSP and Stride Plugin for PyMOL, 2011, BIOTEC, TU Dresden, 2011_04_11.
- 23. Amaral M., Kokh D. B., Bomke J., Wegener A., Buchstaller H. P., Eggenweiler H. M., Matias P., Sirrenberg C., Wade R. C., Frech M., Nat. Commun. 2017, 8, 2276. [DOI] [PMC free article] [PubMed] [Google Scholar]
- 24. Dehner A., Furrer J., Richter K., Schuster I., Buchner J., Kessler H., ChemBioChem 2003, 4, 870–877. [DOI] [PubMed] [Google Scholar]
- 25. Levinson N. M., Boxer S. G., Nat. Chem. Biol. 2014, 10, 127–132. [DOI] [PMC free article] [PubMed] [Google Scholar]
- 26. Glaser R. W., Anal. Biochem. 1993, 213, 152–161. [DOI] [PubMed] [Google Scholar]
Associated Data
This section collects any data citations, data availability statements, or supplementary materials included in this article.
Supplementary Materials
As a service to our authors and readers, this journal provides supporting information supplied by the authors. Such materials are peer reviewed and may be re‐organized for online delivery, but are not copy‐edited or typeset. Technical support issues arising from supporting information (other than missing files) should be addressed to the authors.
Supplementary


