Abstract
Objectives
This study utilizes a model of long‐term spinal cord stimulation (SCS) in experimental painful diabetic polyneuropathy (PDPN) to investigate the behavioral response during and after four weeks of SCS (12 hours/day). Second, we investigated the effect of long‐term SCS on peripheral cutaneous blood perfusion in experimental PDPN.
Methods
Mechanical sensitivity was assessed in streptozotocin induced diabetic rats (n = 50) with von Frey analysis. Hypersensitive rats (n = 24) were implanted with an internal SCS battery, coupled to an SCS electrode covering spinal levels L2–L5. The effects of four weeks of daily conventional SCS for 12 hours (n = 12) or Sham SCS (n = 12) were evaluated with von Frey assessment, and laser Doppler imaging (LDI).
Results
Average paw withdrawal thresholds (PWT) increased during long‐term SCS in the SCS group, in contrast to a decrease in the Sham group (Sham vs. SCS; p = 0.029). Twenty‐four hours after long‐term SCS average PWT remained higher in the SCS group. Furthermore, the SCS group showed a higher cutaneous blood perfusion during long‐term SCS compared to the Sham group (Sham vs. SCS; p = 0.048). Forty‐eight hours after long‐term SCS, no differences in skin perfusion were observed.
Discussion
We demonstrated that long‐term SCS results in decreased baseline mechanical hypersensitivity and results in increased peripheral blood perfusion during stimulation in a rat model of PDPN. Together, these findings indicate that long‐term SCS results in modulation of the physiological circuitry related to the nociceptive system in addition to symptomatic treatment of painful symptoms.
Keywords: Experimental research, laser Doppler imaging, long‐term spinal cord stimulation, mechanical hypersensitivity, painful diabetic polyneuropathy, physiology, spinal cord stimulation, vasodilation, von Frey
Introduction
Spinal cord stimulation (SCS) is a successful last resort treatment modality for patients suffering from various chronic pain disorders. Currently, SCS is mainly prescribed as a symptomatic treatment of painful symptoms. It can result in successful pain relief in patients with chronic pain arising from various disorders, including painful diabetic polyneuropathy (PDPN) 1, 2, 3, 4, 5. Besides symptomatic treatment, there are numerous indications that continuous neuromodulation of the spinal cord results in physiological changes 6, 7, 8, 9, 10, 11. These physiological changes are key players in understanding the working mechanism behind SCS and identifying targets for improvement. This is of importance since many patients do not respond to SCS treatment or fail to respond over time, despite the technological advances that have been made in the last decades 12, 13, 14. SCS mechanisms can be investigated clinically to some extent; however important aspects need a more detailed insight at the physiological and molecular level which can only be obtained from animal experiments. However, there are several limitations in the translation of experimental studies to the clinical situation. Probably one of the most important limitations is the relatively short duration of stimulation (short‐term SCS) that is applied in experimental models. Although these short‐term SCS paradigms have proven to be useful in the assessment of pain related behavior and investigating the acute physiological changes in the nociceptive network 7, 15, 16, 17, 18, 19, the need for insight into long‐term (clinically more relevant) SCS effects and related physiological changes is urgent.
Recent developments in SCS technology have resulted in the production of smaller pulse generators, which allows continuous stimulation of the spinal cord in rats for hours, days, weeks, or even months 20, 21. For instance, long‐term SCS (6 hours/day for 3 months) in a model of spared nerve injury (SNI) resulted in decreased mechanical hypersensitivity and increased activity levels 20. Moreover, mechanical hypersensitivity remained decreased during long‐term SCS throughout the study, whereas the initially increased activity levels later returned toward values as observed in rats receiving sham stimulation. No cumulative effect or loss of effect of long‐term SCS on mechanical hypersensitivity was observed. Considering the vascular mechanisms that are involved in PDPN pathology, the effect of long‐term SCS on cutaneous blood perfusion is an important aspect to investigate. Short‐term experimental SCS has been shown to result in very local improvements in cutaneous blood perfusion in diabetic rats 6. Clinical improvements in patients with ischemic pain after long‐term SCS suggest that long‐term SCS might result in improved blood perfusion of a larger area in the affected limb 11, 22. Besides repetitive short‐term SCS in experimental PDPN 23, long‐term SCS has not yet been established for experimental PDPN.
The first aim of this study was to investigate pain behavior, based on paw withdrawal thresholds (PWT) to von Frey filaments, during and after four weeks of daily SCS (12 hours/day). Second, we investigated the effect of long‐term SCS on cutaneous blood perfusion in the hind limbs using laser Doppler imaging (LDI).
Methods
Animals
All experiments were performed using male Sprague‐Dawley rats (n = 60), which were eight weeks of age at the start of the experiment (300–350 g). Animals were housed on a reversed day night rhythm in transparent plastic cages with access to food and water ad libitum. The experiments were approved by the Animal Research Committee of the Maastricht University Medical Centre.
Induction of Diabetes Mellitus
Diabetes mellitus (DM) was induced in Week 2 with a single intraperitoneal (i.p.) injection of 65 mg/kg of streptozotocin (STZ) (Sigma‐Aldrich, Schnelldorf, Germany) (n = 50). Control rats (n = 10) were injected with saline. Before STZ injection, rats were weighed and fasted overnight. STZ was freshly dissolved in sterile 0.9% NaCl to a solution of 65 mg/mL. Four days after STZ injection, blood glucose level was determined in blood derived from the saphenous vein using a standard blood glucose meter (Accu‐Chek Aviva®, Roche Diagnostics GmbH, Mannheim, Germany). Rats with a glucose level of ≥15 mmol/L were considered diabetic 24. Throughout the study additional blood glucose measurements were regularly performed to confirm the status of DM. When glucose levels exceeded 30 mmol/L, we placed a third of a slow releasing insulin pellet (LinShin Canada, Inc.) subcutaneously in the trunk only in the first two weeks after induction of DM in order to decrease general somatic dysfunction caused by severe DM during the first phase of the study.
Implantation of Spinal Cord Stimulation Electrode
Diabetic rats with a decrease in PWT of ≥0.2 unit in log(50%PWT) as compared with baseline were selected for implantation of an internal SCS device (PDPN rats). A change of 0.2 unit in log(50%PWT) corresponds to a 50% chance of rats responding to the next higher or lower filament 25, 26. Rats that did not show a decrease of ≥0.2 unit in log(50%PWT) were excluded from the study. The implantation of the quadripolar SCS electrode was performed according to previous work 23 and adapted to the use of an Implantable Pulse Generator (IPG). In short, under general anesthesia, a small laminectomy was made at vertebrate level L1 and the electrode was inserted in the epidural space in rostral direction to cover spinal levels L2–L5. The lead was fixed with sutures to the muscle and the wound was sutured in layers. The proximal end of the lead was connected to an Interstim‐II IPG (model 3058, Medtronic) which was placed subcutaneously on the left side of the trunk (Fig. 1).
Figure 1.
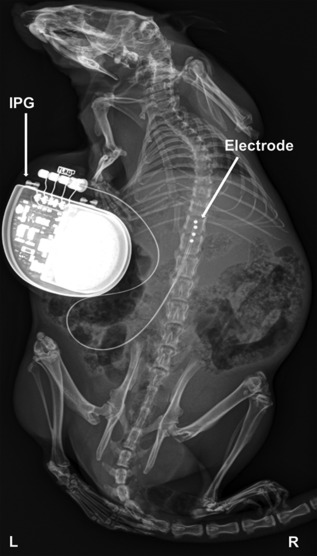
X‐ray of a streptozotocin induced experimental diabetic male Sprague‐Dawley rat with an implanted Interstim‐II Implantable Pulse Generator (IPG) coupled to an experimental epidural quadripolar lead. Electrode contacts are inserted in rostral direction through vertebrate L1 via laminectomy and placed over L2–L5 spinal levels.
Behavioral Assessment
Mechanical hypersensitivity was assessed according to the “up‐down method” 25. In short, von Frey filaments with incrementing stiffness (bending forces 1.2, 2.0, 3.6, 5.5, 8.5, 15.1, and 28.84 g) were applied to both hind paws of the rats for 5 sec through the wire mesh floor of the examination cage. If the hind paw was not withdrawn (=negative response), the next filament with higher bending force was applied, whereas the previous filament with lower bending force was applied if the hind paw was withdrawn (positive response). The average 50% PWT (50%PWT) was calculated after completion of a sequence of six consecutive responses. A cut‐off value of 28.84 g was defined. Calculated 50%PWTs were logarithmically transformed to a linear scale for statistical analysis. PWTs were assessed before the induction of PDPN, before implantation of the SCS device, and weekly after implantation. Twenty‐four hours after cessation of long‐term SCS, PWTs to von Frey filaments were assessed before, during, and after an acute stimulation paradigm of 40 min (Fig. 2). The experimenter was blinded during all behavioral analyses and rats were tested in random order.
Figure 2.

Timeline of experiment. LDI, laser Doppler imaging. [Color figure can be viewed at http://wileyonlinelibrary.com]
Spinal Cord Stimulation
The IPGs were programed wirelessly with an N'Vision clinician programmer (model 8840, Medtronic). The first and third of four contacts from rostral were set as anodes, the second and fourth were set as cathodes. The motor threshold (MT) was defined as the lowest amplitude (in Volts) that induced symmetrical contractions of the lower trunk or hind limbs and was determined at a frequency of 2 Hz and pulse width of 210 µsec during the implantation procedure (Week 6), and in Week 7, 8, 10, and 11. The amplitude was then adjusted to 67% of the MT in accordance to previous experiments 23, 27. Diabetic rats with an implanted SCS device were randomly assigned to either an SCS group (n = 12) or a Sham group (n = 12). The SCS group received continuous SCS (12 hours/day) at a frequency of 50 Hz; pulse width 210 µsec for four weeks. Twenty‐four hours after cessation of continuous SCS, a short‐term (40 min) SCS paradigm was conducted to see if there were any differences between the SCS and Sham group in their response to acute stimulation after four weeks of long‐term SCS (hence, both the SCS group and Sham group received 40 min of SCS).
Cutaneous Blood Perfusion
To study the effect of long‐term SCS on cutaneous blood perfusion, we performed infrared LDI of the plantar surface of both hind paws. Scans were carried out using a dual wavelength LDI (Moor Instruments, Axminster, UK). Under general anesthesia, rats were placed in a 30°C temperature controlled dark environment, since this temperature has been shown to fall in the range of a thermo‐neutral zone in several rodent strains 28. Rats were given 10 min of acclimatization before the start of the first scan. Three scans (resolution x: 227, : 50; speed: 4 msec/pixel, 1.35 min per scan) were performed per rat and the average flux units from both hind paws of the three scans were recorded and analyzed (Software: Moor LDI V5.3). LDI was performed at baseline, pre‐SCS and in Week 10, and 11. The LDI measurement after long‐term SCS in Week 11 was performed no more than 48 hours after cessation of stimulation (Fig. 2). Rats were scanned in random order.
Statistical Analyses
Longitudinal differences between groups in bodyweight, blood glucose levels, MTs, and withdrawal thresholds to Von Frey filaments before and during long‐term SCS were analyzed using a linear mixed effects regression model with a random intercept for the rats. The random intercept ensures that the repeated measures within each rat are correctly accounted for. In addition, the linear mixed effects model analyzes all rats, despite missing data due to removal of the SCS device or electrode malfunction over time. Because of complete data, differences in withdrawal thresholds to Von Frey filaments in Week 11 were analyzed using a Repeated Measures Analysis of Variance (RM‐ANOVA). Similar to the linear mixed effects model the RM‐ANOVA accounts for repeated measures within each rat. We defined time (five levels: 0, 15, 30, 60, and 90 min) as the within‐subjects factor and group allocation (i.e., Sham, SCS, or control) was assigned as between‐subjects factor. Differences in cutaneous blood perfusion during long‐term stimulation were analyzed by means of Analysis of Variance (ANOVA). All analyses were performed with the Statistical Package for the Social Sciences, version 23 (SPSS Inc., Chicago, IL, USA). p‐Values of ≤0.05 were considered to indicate statistical significance.
Results
Induction of Diabetes Mellitus
Intraperitoneal injection of 65 mg/kg STZ (n = 50) resulted in blood glucose levels ≥15 mmol/L in 48 rats (96%). Twenty‐four rats (48%) developed PDPN and were implanted with an internal SCS device. Blood glucose levels increased from 8.3 mmol/L (95% confidence interval [CI]: 7.9, 8.7) at baseline to 27.8 mmol/L (95% CI: 24.7, 30.9) and 26.7 mmol/L (95% CI: 24, 29.5) postinjection in the Sham (n = 12) and SCS group (n = 12), respectively. Blood glucose levels remained elevated throughout the rest of the study period (Fig. 3).
Figure 3.
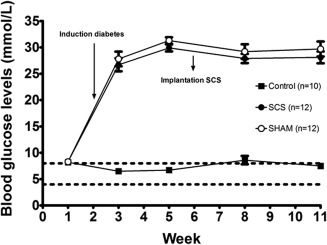
Blood glucose levels. Mean ± SEM.
Bodyweight of control animals (n = 10) increased from 322 g (95% CI: 311, 333) at the start of the study to 485 g (95% CI: 458, 511) at the end of the study (Week 11). The SCS (n = 12) and Sham group (n = 12) underwent a decrease in bodyweight after STZ injection followed by an increase to 392 g (95% CI: 365, 420) and 372 g (95% CI: 352, 391), respectively, in Week 11 (Fig. 4). Linear mixed regression analysis revealed no significant differences in blood glucose levels or bodyweight between the Sham and SCS group.
Figure 4.
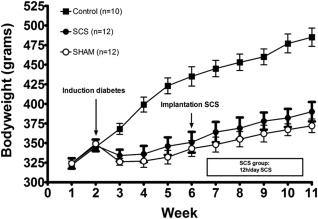
Bodyweights. Mean ± SEM.
Spinal Cord Stimulation
One rat in the Sham group was implanted with an IPG with battery failure and two more rats in the Sham group failed to show MTs in Week 10, due to removal of sutures by the rats and subsequent subcutaneous scratching of the silicon connection wire of the SCS device. Furthermore, one rat in the Sham group underwent considerable discomfort due to anterolateral migration of the IPG, which was therefore explanted in Week 11. Hence, nine and eight rats were included in the Sham group in Week 10 and 11, respectively, during all procedures requiring active electrical stimulation in the Sham group (i.e., determination of MT and the analysis of PWTs to von Frey filaments in Week 11). All rats in the SCS group (n = 12) successfully completed the study with a functional SCS system.
MT was determined in all PDPN rats with an implanted functional SCS device (SCS group (n = 12) and Sham group (n = 11) total n = 23). The amplitude (in Volts) required to induce a motor response in the hind limbs or lower trunk during anesthesia in the surgical procedure of SCS implantation was significantly higher compared with follow‐up measurements in awake rats (p < 0.001). During implantation, the average MT of all implanted rats was 1.40V (95% CI: 1.03, 1.78) during surgery, compared with 0.23V (95% CI: 0.21, 0.26) in Week 7, and 0.34V (95% CI: 0.28, 0.41) in Week 11. No statistical significant differences were observed between the Sham and SCS group (Fig. 5).
Figure 5.
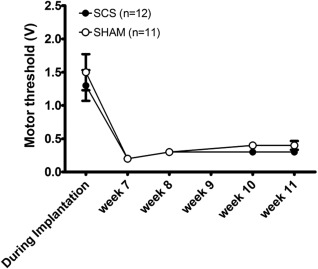
Motor threshold in Volts per group. Mean ± SEM.
Behavioral Assessment
Average 50%PWT to Von Frey filaments before the induction of DM was 14.8 g (95% CI: 12.6, 17.4). Linear mixed effects regression analysis revealed a significant interaction between time and group during long‐term SCS (p = 0.044), indicating that the effect of time differed between the group strata. The average 50%PWT in the SCS group increased from 4.8 g (95% CI: 3.1, 7.6) pre‐long‐term SCS to 9.8 g (95% CI: 5.9, 15.8) in Week 10, whereas average 50%PWT in the Sham group decreased from 7.1 g (95% CI: 5.1, 10.0) to 5.6 g (95% CI: 3.5, 8.9) (Sham vs. SCS; p = 0.029) (Fig. 6). The average 50%PWT in control rats remained stable over time throughout the study.
Figure 6.
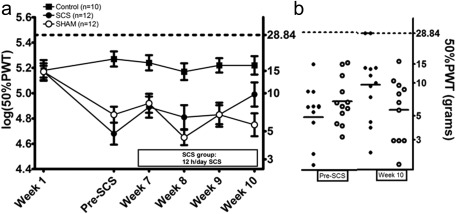
Effect of long‐term SCS (12 hours/day from Week 7 to Week 10) on paw withdrawal thresholds (50% PWT(grams) and log(50%PWT)) as assessed with von Frey filaments. Mean ± SEM (a). Scatterplot of PWTs in the SCS and Sham group before long‐term SCS and in Week 10. The horizontal lines mark the averages in each group (b). * p < 0.05 regression analysis.
Repeated Measures Analysis of Variance revealed a significant overall effect of time during 40 min of SCS in both the SCS and Sham group (p < 0.001). During stimulation, PWTs peaked at 30 min with an average increase of 0.19 unit in log(50%PWT). Although no significant differences between Sham and SCS rats were noted, an absolute difference of 0.2 unit in log(50%PWT) was present at baseline (0 min). Average 50%PWT at baseline was 7.1 g (95% CI: 4.8, 10.5) in the SCS group, whereas average 50%PWT in the Sham group was 4.5 g (95% CI: 2.7, 7.1). Average 50%PWT at 90 min was 6.1 g (95% CI: 4.9, 7.5) in the SCS group and 4.9 g (95% CI: 3.2, 7.5) (Fig. 7).
Figure 7.
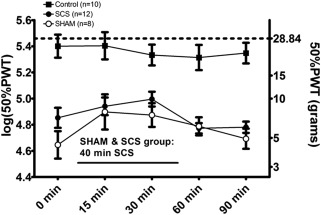
Effect of long‐term SCS and paw withdrawal thresholds (50% PWT(grams) and log(50%PWT)) as assessed with von Frey filaments in Week 11: A traditional 40 min stimulation paradigm was conducted in both the SHAM and SCS group 24 hours after cessation of long‐term SCS. Mean ± SEM. *p < 0.01 rm‐ANOVA.
Cutaneous Blood Perfusion
Both the SCS and Sham group showed lower blood perfusion of the plantar surface of the hind paws after induction of DM and before long‐term SCS (p = 0.028). The SCS group showed a significantly higher blood perfusion of the hind limbs as compared with the Sham group at the end of four weeks long‐term SCS (p = 0.048). SCS rats showed an increase from 60.6% of baseline blood perfusion (95% CI: 44.6, 76.5) before long‐term SCS (pre‐SCS) to 70.5% of baseline blood perfusion (95% CI: 58.1, 83.0) in Week 10. In contrast, Sham rats showed a minimal decrease from 53.0% of baseline blood perfusion (95% CI: 39.7, 66.4) to 52.6% of baseline blood perfusion (95% CI: 38.2, 66.9). Forty‐eight hours after long‐term SCS no differences were observed between the SCS and Sham group (SCS: 47.3% of baseline blood perfusion [95% CI: 32.7, 61.9] and Sham: 44.5% of baseline blood perfusion [95% CI: 33.2, 55.8]) (Fig. 8). Control rats did not show significant changes in blood perfusion during the study (pre‐SCS: 98.5% of baseline blood perfusion [95% CI: 69.1, 127.8] and in Week 10: 102.1% of baseline blood perfusion [95% CI: 71.0, 133.1]).
Figure 8.
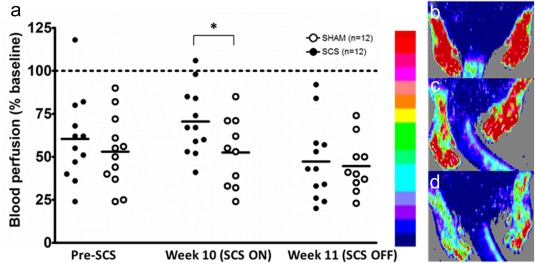
Scatterplot of cutaneous blood perfusion in the plantar surface of the hind paws measured with Laser Doppler Imaging. The horizontal lines mark the averages in each group (a). An illustrative scale bare and examples of LDI flux scans in a control rat (b), a diabetic rat in the SCS group in Week 10 (c), and the same diabetic rat in Week 11 (d). * p < 0.05 ANOVA. [Color figure can be viewed at http://wileyonlinelibrary.com]
Discussion
The first aim of the present study was to examine the effect of long‐term SCS (four weeks daily, 12 hours/day) on pain behavior in experimental PDPN. Second, we investigated the effect of long‐term SCS on cutaneous blood perfusion in the hind paws of PDPN rats.
To study the effect of long‐term SCS on pain behavior in experimental PDPN we performed von Frey assessments before, during, and after long‐term SCS. Analysis of these data revealed a statistically significant interaction between time and group during long‐term SCS. Mean absolute PWT increased 0.31 unit log(50%PWT) in the SCS group during four weeks of long‐term SCS, whereas the average PWT in the Sham group decreased 0.08 unit log(50%PWT). This is of importance, since a difference of 0.2 unit log(50%PWT) can be considered as a relevant difference in sensory perception 25, 26, and served as inclusion criterion for SCS implantation in our previous experiments 23, 27. Twenty‐four hours after cessation of long‐term SCS, the SCS group shows a 0.2 unit log(50%PWT) higher baseline PWT as compared with the Sham group, while no significant difference in PWT was observed between the groups when 40 min of SCS was applied. PWTs did decrease further after cessation of 40 min SCS in rats that received Sham long‐term SCS compared with rats that received long‐term SCS. These findings indicate that mechanical hypersensitivity is alleviated 24 hours after four weeks of 12 hours/day SCS, partially due to another reason than active SCS at that time point. Possibly, functional or even structural changes have occurred in the nociceptive system due to long‐term SCS, which contribute to the alleviation of baseline mechanical hypersensitivity. Possible central mechanisms include inhibition of windup and prolonged synaptic depression in lamina II dorsal horn neurons to nociceptive inputs 29. In contrast, clinical reports usually report less SCS treatment success over time, which can ultimately result in explantation of the SCS device 4, 5, 30. A possible explanation for the discrepancy between these clinical reports and our experimental findings is that human patients with chronic pain might experience an adaptation phenomenon 4, 31. Whereas pain relief in rats is scored by the application of a calibrated filament with an absolute force, patients are aware of the fact that they are receiving treatment and score their pain (on visual or numeric scales) based on previous conditions. Our data indicates that baseline withdrawal thresholds were higher after long‐term SCS, and that acute short‐term SCS did not significantly increase baseline PWTs further in rats treated with long‐term SCS. It could therefore be speculated that the higher baseline PWTs in PDPN rats are in line with a patients' baseline condition at a certain time point. The absence of further pain relief upon active stimulation might result in patients perceiving no treatment success, although they have an improved baseline condition.
As a second aim, we analyzed cutaneous blood perfusion data before, during, and after long‐term SCS. Previous rat studies have demonstrated very local improvements of blood perfusion upon short‐term SCS paradigms 8, 32, 33, 34, which we could demonstrate with LDI as well. However, attempts to measure increased blood perfusion of the entire plantar surface of the hind paw failed during short‐term SCS in both diabetic as well as healthy rats (unpublished results). Since after four weeks, a higher blood perfusion of the entire plantar surface of the hind paws can be demonstrated only during active stimulation, we could speculate that the total amount of stimulation explains the alleviation of baseline mechanical hypersensitivity, since the total duration of stimulation in this study is 336 hours. As long‐term SCS results in clinical improvement and pain relief in patients with ischemic pain 11, 22, 35, a prolonged improved perfusion of the entire plantar surface of the rat hind paws might result in clinical improvement and subsequent pain relief as well. The baseline PWT to Von Frey filaments is presumably still affected 24 hours after cessation of long‐term SCS, while no increased blood perfusion was present at that time. Given the fact that peripheral blood perfusion after cessation of long‐term SCS did not differ between the Sham and SCS group, we conclude that long‐term SCS had no effect on baseline blood perfusion. Instead, long‐term SCS resulted in an increased potency of SCS to induce vasodilation. The increased blood perfusion of the hind paws during SCS is indicative for increased CGRP signaling, which occurs mainly via antidromic activation of small unmyelinated CGRPergic fibers 6, 7, 34, 36, 37. These findings might indicate that long‐term SCS results in preservation or sprouting of CGRPergic small diameter fibers. Indeed, experimental studies support the hypothesis that electrical stimulation of nerve tissue results in axon sprouting, possibly via BDNF signaling 38, 39, 40. Moreover, Intra Epidermal Nerve Fiber Density and CGRP labeling has been shown to be affected in both clinical and experimental diabetes 41, 42. If long‐term SCS indeed results in improved or preserved functioning of small diameter nerve fibers, it might be worthwhile to initiate SCS therapy earlier instead of waiting until all other therapeutic efforts have failed. Indeed, clinical evidence underlines the importance of neuropathy stage for SCS treatment success in PDPN patients 3. Therefore, the effect of long‐term SCS on CGRPergic nerve fibers in dermatomes that are targeted by SCS should be the future focus in experimental SCS studies in PDPN. Postmortem analysis of nervous tissue in the hind paws could confirm whether or not long‐term SCS indeed results in the preservation of nervous tissue in dermatomes targeted by SCS. Furthermore, other vasodilatory pathways of SCS should be taken into account, such as sympathetic inhibition 43, 44, 45.
Out of 24 rats with an implanted SCS system, only one rat underwent severe discomfort related to implantation of the pulse generator. No infections occurred although STZ induced diabetes is accompanied by severe pathology, including increased susceptibility to infection 46, 47, 48. This might be explained by the fact that we provided short‐term glycemic control, which can reduce surgical site infections 49. However, insulin was only administered in the two weeks after STZ injection to preserve DM status during the experimental phase of long‐term SCS. Therefore, it is more likely that extensive surgical training prior to experimental surgeries, and critical evaluation of aseptic conditions during surgery, are responsible for the absence of infections in our PDPN rats. No further complications occurred as a result of implantation of the internal IPG. Based on these results, we conclude that implantation of an internal IPG is a suitable approach to study the effects of long‐term SCS in experimental PDPN. Average MT was significantly higher in sedated rats during surgery compared with awake rats during long‐term SCS (Fig. 5), which can be partially explained by the use of anesthesia as has been previously demonstrated 50. Furthermore, an increase of 0.11V in average MT was observed during the four weeks postsurgery. The thickness of the cerebrospinal fluid layer between the dura mater and spinal cord, which is anatomically different in rats in a prone position during surgery, is an important factor that contributes to electrical conductivity to Aβ fibers in the dorsal column and therefore determines the required SCS amplitude 51. Postsurgery, MT was determined in awake rats, which might have led to an underestimation of MT during experimental procedures requiring anesthesia, i.e., determination of peripheral blood perfusion and nerve conductance velocity. The amplitude of SCS, which is a percentage of MT, has been shown to be positively correlated to local peripheral vasodilation 8, suggesting that the effect size of our blood perfusion data might be underestimated. Furthermore, small sample sizes in experimental studies limit the extrapolation of results to clinical trials including larger heterogeneous patient populations. To provide more insight of experimental long‐term SCS on nociception in PDPN rats, a larger battery of pain assessment techniques could have been included in this study. However, the health status of PDPN rats is relatively poor and should be taken into account when designing long‐term experiments including multiple assessment techniques, especially when sedation is involved.
In conclusion, our results indicate that long‐term SCS, with conventional stimulation parameters, results in decreased mechanical hypersensitivity even after cessation of SCS in experimental PDPN. Furthermore, blood perfusion of the hind limbs is significantly increased during long‐term SCS, although this effect diminishes after cessation of SCS. Therefore we suggest that structural changes have occurred in the nociceptive network during long‐term SCS in experimental PDPN and the effect of SCS on vascular reactivity might be causally involved.
Authorship Statements
Maarten van Beek was responsible for the execution of experiments, collection, analysis, interpretation, and documentation of the data. Denise Hermes and Wiel M. Honig assisted in executing experiments. Sander M. J. van Kuijk contributed to the analysis of the data and reviewed the manuscript. Bengt Linderoth, Maarten van Beek, and Elbert A. Joosten contributed to interpretation of the data and reviewed the manuscript.
COMMENTS
van Beek, et. al, have performed an interesting study of the long‐term effect of conventional SCS in a rat model of diabetic neuropathy. Such studies are important to investigate mechanisms of pain alleviation and will help to guide advances in SCS technology. The persistence of decreased mechanical hypersensitivity even after cessation of SCS brings up an important topic of neuroplasticity engendered by SCS. The authors have included both sham and control arms and should be commended on the quality of their investigation. As technology for SCS continues to evolve, greater research on the mechanisms behind pain reduction by SCS will help to expand indications and perhaps elucidate reasons for why different waveforms have different clinical efficacy.
Nestor Tomycz, MD
Pittsburgh, PA, USA
***
Applying long‐term SCS which better mimics that used in the clinic is quite challenging in rodent models. The study is well designed and nicely executed, and hence the potential translational value of this study is high.
Yun Guan, MD
Baltimore, MD, USA
***
This is the first publication of long‐term stimulation applied to animal models. The study clearly demonstrates that long‐term SCS results in decreased baseline mechanical hypersensitivity and results in increased peripheral blood perfusion during stimulation in a rat model of PDPN. The study advances further our ability to mimic the clinical therapy in animal model.
Sam Eldabe, MD
Middlesbrough, UK
Comments not included in the Early View version of this paper.
For more information on author guidelines, an explanation of our peer review process, and conflict of interest informed consent policies, please go to http://www.wiley.com/WileyCDA/Section/id-301854.html
Source(s) of financial support: This study was supported by Medtronic, which provided a research grant (contract number NM2782) to Prof. Dr. E.A. Joosten. No other potential conflicts of interest relevant to this article were reported. Medtronic was not involved in the analysis and interpretation of the data or in writing the manuscript.
Conflict of Interest: The authors reported no conflict of interest.
References
- 1. Kumar K, Taylor RS, Jacques L. Spinal cord stimulation versus conventional medical management for neuropathic pain: a multicentre randomised controlled trial in patients with failed back surgery syndrome. Pain 2007;132:179–188. [DOI] [PubMed] [Google Scholar]
- 2. Kemler MA, de Vet HC, Barendse GA, van den Wildenberg FA, van Kleef M. Effect of spinal cord stimulation for chronic complex regional pain syndrome type I: five‐year final follow‐up of patients in a randomized controlled trial. J Neurosurg 2008;108:292–298. [DOI] [PubMed] [Google Scholar]
- 3. Tesfaye S, Watt J, Benbow SJ, Pang KA, Miles J, MacFarlane IA. Electrical spinal‐cord stimulation for painful diabetic peripheral neuropathy. Lancet 1996;348:1698–1701. [DOI] [PubMed] [Google Scholar]
- 4. Slangen R, Schaper NC, Faber CG et al. Spinal cord stimulation and pain relief in painful diabetic peripheral neuropathy: a prospective two‐center randomized controlled trial. Diabetes Care 2014;37:3016–3024. [DOI] [PubMed] [Google Scholar]
- 5. Geurts JW, Smits H, Kemler MA, Brunner F, Kessels AG, van Kleef M. Spinal cord stimulation for complex regional pain syndrome type I: a prospective cohort study with long‐term follow‐up. Neuromodulation 2013;16:523–529; discussion 529. [DOI] [PubMed] [Google Scholar]
- 6. Wu M, Thorkilsen MM, Qin C, Farber JP, Linderoth B, Foreman RD. Effects of spinal cord stimulation on peripheral blood circulation in rats with streptozotocin‐induced diabetes. Neuromodulation 2007;10:216–223. [DOI] [PubMed] [Google Scholar]
- 7. Linderoth B, Foreman RD, Meyerson BA. Mechanisms of action of spinal cord stimulation In: Lozano AM, Gildenberg PL, Tasker RR, eds. Textbook of stereotactic and functional neurosurgery. Berlin, Heidelberg: Springer, 2009:2331–2347. [Google Scholar]
- 8. Gao J, Wu M, Li L et al. Effects of spinal cord stimulation with “standard clinical” and higher frequencies on peripheral blood flow in rats. Brain Res 2010;1313:53–61. [DOI] [PubMed] [Google Scholar]
- 9. McCarthy KF, McCrory C. Cerebrospinal fluid levels of glial cell‐derived neurotrophic factor correlate with spinal cord stimulation frequency in patients with neuropathic pain: a preliminary report. Spinal Cord 2014;52:S8–S10. [DOI] [PubMed] [Google Scholar]
- 10. Vallejo R, Tilley DM, Cedeno DL, Kelley CA, DeMaegd M, Benyamin R. Genomics of the effect of spinal cord stimulation on an animal model of neuropathic pain. Neuromodulation 2016;19:576–586. [DOI] [PubMed] [Google Scholar]
- 11. Ubbink DT, Vermeulen H. Spinal cord stimulation for non‐reconstructable chronic critical leg ischaemia. Cochrane Database Syst Rev 2013;2:CD004001. [DOI] [PMC free article] [PubMed] [Google Scholar]
- 12. Verrills P, Sinclair C, Barnard A. A review of spinal cord stimulation systems for chronic pain. J Pain Res 2016;9:481–492. [DOI] [PMC free article] [PubMed] [Google Scholar]
- 13. Cameron T. Safety and efficacy of spinal cord stimulation for the treatment of chronic pain: a 20‐year literature review. J Neurosurg 2004;100:254–267. [DOI] [PubMed] [Google Scholar]
- 14. Levy RM. Progress in the technology of neuromodulation: the emperor's new clothes? Neuromodulation 2013;16:285–291. [DOI] [PubMed] [Google Scholar]
- 15. Janssen SP, Gerard S, Raijmakers ME, Truin M, Van Kleef M, Joosten EA. Decreased intracellular GABA levels contribute to spinal cord stimulation‐induced analgesia in rats suffering from painful peripheral neuropathy: the role of KCC2 and GABA(A) receptor‐mediated inhibition. Neurochem Int 2012;60:21–30. [DOI] [PubMed] [Google Scholar]
- 16. Ultenius C, Song Z, Lin P, Meyerson BA, Linderoth B. Spinal GABAergic mechanisms in the effects of spinal cord stimulation in a rodent model of neuropathic pain: is GABA synthesis involved? Neuromodulation 2013;16:114–120. [DOI] [PubMed] [Google Scholar]
- 17. Tazawa T, Kamiya Y, Kobayashi A et al. Spinal cord stimulation modulates supraspinal centers of the descending antinociceptive system in rats with unilateral spinal nerve injury. Mol Pain 2015;11:36. [DOI] [PMC free article] [PubMed] [Google Scholar]
- 18. Truin M, Janssen SPM, Kleef M, Joosten EAJ. Successful pain relief in non‐responders to spinal cord stimulation: the combined use of ketamine and spinal cord stimulation. Eur J Pain 2011;15:1049.e1–9. [DOI] [PubMed] [Google Scholar]
- 19. Jongen JLM, Smits H, Pederzani T et al. Spinal autofluorescent flavoprotein imaging in a rat model of nerve injury‐induced pain and the effect of spinal cord stimulation. PLoS One 2014;9:e109029. [DOI] [PMC free article] [PubMed] [Google Scholar]
- 20. Sato KL, Johanek LM, Sanada LS, Sluka KA. Spinal cord stimulation (SCS) improves decreased physical activity induced by nerve injury. Behav Neurosci 2014;128:625–632. [DOI] [PubMed] [Google Scholar]
- 21. Gong W, Johanek LM, Sluka KA. Spinal cord stimulation reduces mechanical hyperalgesia and restores physical activity levels in animals with noninflammatory muscle pain in a frequency‐dependent manner. Anesth Analg 2014;119:186–195. [DOI] [PubMed] [Google Scholar]
- 22. Ubbink DT, Vermeulen H. Spinal cord stimulation for critical leg ischemia: a review of effectiveness and optimal patient selection. J Pain Symptom Manage 2006;31:S30–S35. [DOI] [PubMed] [Google Scholar]
- 23. van Beek M, van Kleef M, Linderoth B, van Kuijk SM, Honig WM, Joosten EA. Spinal cord stimulation in experimental chronic painful diabetic polyneuropathy: delayed effect of high‐frequency stimulation. Eur J Pain 2017;21:795–803. [DOI] [PMC free article] [PubMed] [Google Scholar]
- 24. Calcutt NA. Modeling diabetic sensory neuropathy in rats. Methods Mol Med 2004;99:55–65. [DOI] [PubMed] [Google Scholar]
- 25. Chaplan SR, Bach FW, Pogrel JW, Chung JM, Yaksh TL. Quantitative assessment of tactile allodynia in the rat paw. J Neurosci Methods 1994;53:55–63. [DOI] [PubMed] [Google Scholar]
- 26. Mills C, Leblond D, Joshi S et al. Estimating efficacy and drug ED50's using von Frey thresholds: impact of weber's law and log transformation. J Pain 2012;13:519–523. [DOI] [PubMed] [Google Scholar]
- 27. Pluijms WA, van Kleef M, Honig WM, Janssen SP, Joosten EA. The effect of spinal cord stimulation frequency in experimental painful diabetic polyneuropathy. Eur J Pain 2013;17:1338–1346. [DOI] [PubMed] [Google Scholar]
- 28. Romanovsky AA, Ivanov AI, Shimansky YP. Selected contribution: ambient temperature for experiments in rats: a new method for determining the zone of thermal neutrality. J Appl Physiol 2002;92:2667–2679. [DOI] [PubMed] [Google Scholar]
- 29. Sdrulla AD, Xu Q, He SQ et al. Electrical stimulation of low‐threshold afferent fibers induces a prolonged synaptic depression in lamina II dorsal horn neurons to high‐threshold afferent inputs in mice. Pain 2015;156:1008–1017. [DOI] [PMC free article] [PubMed] [Google Scholar]
- 30. van Beek M, Slangen R, Schaper NC et al. Sustained treatment effect of spinal cord stimulation in painful diabetic peripheral neuropathy: 24‐month follow‐up of a prospective two‐center randomized controlled trial. Diabetes Care 2015;38:e132–e134. [DOI] [PubMed] [Google Scholar]
- 31. Menzel P, Dolan P, Richardson J, Olsen JA. The role of adaptation to disability and disease in health state valuation: a preliminary normative analysis. Soc Sci Med 2002;55:2149–2158. [DOI] [PubMed] [Google Scholar]
- 32. Wu M, Komori N, Qin C, Farber JP, Linderoth B, Foreman RD. Extracellular signal‐regulated kinase (ERK) and protein kinase B (AKT) pathways involved in spinal cord stimulation (SCS)‐induced vasodilation. Brain Res 2008;1207:73–83. [DOI] [PMC free article] [PubMed] [Google Scholar]
- 33. Wu M, Komori N, Qin C, Farber JP, Linderoth B, Foreman RD. Roles of peripheral terminals of transient receptor potential vanilloid‐1 containing sensory fibers in spinal cord stimulation‐induced peripheral vasodilation. Brain Res 2007;1156:80–92. [DOI] [PMC free article] [PubMed] [Google Scholar]
- 34. Wu M, Komori N, Qin C, Farber JP, Linderoth B, Foreman RD. Sensory fibers containing vanilloid receptor‐1 (VR‐1) mediate spinal cord stimulation‐induced vasodilation. Brain Res 2006;1107:177–184. [DOI] [PubMed] [Google Scholar]
- 35. Ubbink DT, Vermeulen H, Spincemaille GH, Gersbach PA, Berg P, Amann W. Systematic review and meta‐analysis of controlled trials assessing spinal cord stimulation for inoperable critical leg ischaemia. Br J Surg 2004;91:948–955. [DOI] [PubMed] [Google Scholar]
- 36. Wu M, Linderoth B, Foreman RD. Putative mechanisms behind effects of spinal cord stimulation on vascular diseases: a review of experimental studies. Auton Neurosci 2008;138:9–23. [DOI] [PMC free article] [PubMed] [Google Scholar]
- 37. Tanaka S, Barron KW, Chandler MJ, Linderoth B, Foreman RD. Low intensity spinal cord stimulation may induce cutaneous vasodilation via CGRP release. Brain Res 2001;896:183–187. [DOI] [PubMed] [Google Scholar]
- 38. Xu C, Kou Y, Zhang P et al. Electrical stimulation promotes regeneration of defective peripheral nerves after delayed repair intervals lasting under one month. PLoS One 2014;9:e105045. [DOI] [PMC free article] [PubMed] [Google Scholar]
- 39. Geremia NM, Gordon T, Brushart TM, Al‐Majed AA, Verge VMK. Electrical stimulation promotes sensory neuron regeneration and growth‐associated gene expression. Exp Neurol 2007;205:347–359. [DOI] [PubMed] [Google Scholar]
- 40. Kao C‐H, Chen J‐JJ, Hsu Y‐M, Bau D‐T, Yao C‐H, Chen Y‐S. High‐frequency electrical stimulation can be a complementary therapy to promote nerve regeneration in diabetic rats. PLoS One 2013;8:e79078. [DOI] [PMC free article] [PubMed] [Google Scholar]
- 41. Evans L, Andrew D, Robinson P, Boissonade F, Loescher A. Increased cutaneous NGF and CGRP‐labelled trkA‐positive intra‐epidermal nerve fibres in rat diabetic skin. Neurosci Lett 2012;506:59–63. [DOI] [PubMed] [Google Scholar]
- 42. Beiswenger KK, Calcutt NA, Mizisin AP. Epidermal nerve fiber quantification in the assessment of diabetic neuropathy. Acta Histochem 2008;110:351–362. [DOI] [PMC free article] [PubMed] [Google Scholar]
- 43. Linderoth B, Herregodts P, Meyerson BA. Sympathetic mediation of peripheral vasodilation induced by spinal cord stimulation: animal studies of the role of cholinergic and adrenergic receptor subtypes. Neurosurgery 1994;35:711–719. [DOI] [PubMed] [Google Scholar]
- 44. Tanaka S, Barron KW, Chandler MJ, Linderoth B, Foreman RD. Local cooling alters neural mechanisms producing changes in blood flow by spinal cord stimulation. Auton Neurosci 2003;104:117–127. [DOI] [PubMed] [Google Scholar]
- 45. Tanaka S, Komori N, Barron KW, Chandler MJ, Linderoth B, Foreman RD. Mechanisms of sustained cutaneous vasodilation induced by spinal cord stimulation. Auton Neurosci 2004;114:55–60. [DOI] [PubMed] [Google Scholar]
- 46. Furudoi S, Yoshii T, Komori T. Balance of tumor necrosis factor alpha and interleukin‐10 in a buccal infection in a streptozotocin‐induced diabetic rat model. Cytokine 2003;24:143–149. [DOI] [PubMed] [Google Scholar]
- 47. Wei M, Ong L, Smith MT et al. The streptozotocin‐diabetic rat as a model of the chronic complications of human diabetes. Heart Lung Circ 2003;12:44–50. [DOI] [PubMed] [Google Scholar]
- 48. Howarth FC, Jacobson M, Shafiullah M, Adeghate E. Long‐term effects of streptozotocin‐induced diabetes on the electrocardiogram, physical activity and body temperature in rats. Exp Physiol 2005;90:827–835. [DOI] [PubMed] [Google Scholar]
- 49. Kroin JS, Buvanendran A, Li J et al. Short‐term glycemic control is effective in reducing surgical site infection in diabetic rats. Anesth Analg 2015;120:1289–1296. [DOI] [PubMed] [Google Scholar]
- 50. Yang F, Carteret AF, Wacnik PW et al. Bipolar spinal cord stimulation attenuates mechanical hypersensitivity at an intensity that activates a small portion of A‐fiber afferents in spinal nerve‐injured rats. Neuroscience 2011;199:470–480. [DOI] [PubMed] [Google Scholar]
- 51. Holsheimer J, Barolat G, Struijk JJ, He J. Significance of the spinal cord position in spinal cord stimulation. Acta Neurochir Suppl 1995;64:119–124. [DOI] [PubMed] [Google Scholar]


