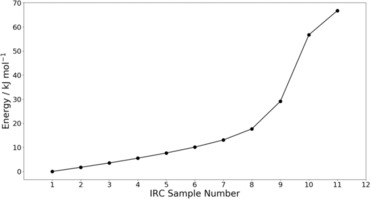
Figure 5.

The energy profile of the reaction shown in Figure 4, which includes all 133 atoms shown in Figure 3. The energy at IRC sample number 1 corresponds to that of the reactants shown on the left in Figure 4 while the energy at IRC sample number 11 corresponds to the transition state shown on the right of Figure 4.
