Abstract
Bent N,N′‐diphenyl‐dihydrodibenzo[a,c]phenazine amphiphiles are introduced as mechanosensitive membrane probes that operate by an unprecedented mechanism, namely, unbending in the excited state as opposed to the previously reported untwisting in the ground and twisting in the excited state. Their dual emission from bent or “closed” and planarized or “open” excited states is shown to discriminate between micelles in water and monomers in solid‐ordered (So), liquid‐disordered (Ld) and bulk membranes. The dual‐emission spectra cover enough of the visible range to produce vesicles that emit white light with ratiometrically encoded information. Strategies to improve the bent mechanophores with expanded π systems and auxochromes are reported, and compatibility with imaging of membrane domains in giant unilamellar vesicles by two‐photon excitation fluorescence (TPEF) microscopy is demonstrated.
Keywords: bent aromatics, fluorescent probes, lipid bilayer membranes, mechanochemistry, white fluorescence
The bending of polycyclic aromatic planes has attracted much scientific attention owing to the emergence of unique spectroscopic, electrochemical, chiroptical, and functional supramolecular properties.1, 2 Many inspiring examples exist for spheres, tubes, helices, bowls, saddles, rings, and other curved motifs.1 However, unlike twisting and untwisting, the spectroscopic consequences of bending and unbending of polycyclic aromatic planes in the ground state (GS) and the first excited state (ES) have been met so far with surprisingly little success in sensing applications and have been completely ignored with regard to fluorescent membrane probes.3, 4, 5, 6, 7, 8, 9, 10, 11, 12, 13 In 2015, Tian, Chou, and co‐workers reported that the molecular distortion of N,N′‐diphenyl‐dihydrodibenzo[a,c]phenazines in the GS provides access to coupled conformational changes toward planarity in the ES, a process reminiscent of a butterfly or “papillon” opening its wings (Figure 1).2
Figure 1.
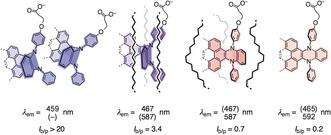
General structure, emission maxima, and intensity ratios I b/p of papillon probe 1 during increasing ES planarization in, from left to right, micelles in water and monomers in So, in Ld and in bulk membranes. See Scheme 1 and Figure 3; I b/p=I(λ e1)/I(λ e2), b/p=bent/planar; dashed bonds indicate expansion sites explored in this study.
This brilliant breakthrough was inspiring for the design of fluorescent membrane probes. Today, three main classes of mechanosensitive probes can be distinguished. Molecular rotors are best developed.3, 4, 5, 6, 7 These push–pull fluorophores operate by off‐equilibrium ES vibrational deactivation in response to decreasing viscosity. A unique inverted molecular rotor has been created recently that reports by untwisting rather than twisting in the ES.8 We have introduced a family of mechanosensitive flipper probes that operate by untwisting of push–pull fluorophores in the GS.13 Their mechanical planarization under equilibrium conditions reports increasing membrane order as a large red shift in excitation rather than emission. Herein, we introduce mechanosensitive membrane probes that operate by bending and unbending rather than twisting and untwisting, that is, with a fundamentally different mode of action (Figure 1).
Amphiphiles 1–3 were readily accessible by adapting the reported procedures (Scheme 1 and Supporting Information, Schemes S1–S4).2 The new pyrene papillon 2, for instance, was prepared in only five steps from pyrene 4 (Scheme 1). Reaction of the resulting diketone 5 with aniline in the presence of pyridine and TiCl4 gave dianil 6 in 56 % yield. Reduction to diamine 7 was achieved in 74 % yield. Papillon 8 was obtained by a copper‐catalyzed domino reaction proceeding through intramolecular C−H amination with 9 and subsequent Ullmann coupling. Basic ester hydrolysis afforded the target amphiphile 2.
Scheme 1.
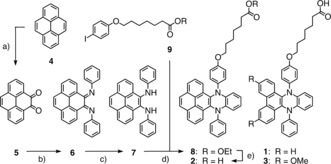
a) NaIO4, RuCl3⋅3 H2O, NMI, THF, CH2Cl2, H2O, RT, 3 h, 32 %; b) aniline, pyridine, TiCl4, CH2Cl2, RT, overnight, 56 %; c) hydrazine hydrate, Pd/C, THF, RT, 2 h, 74 %; d) K2CO3, Cu(OTf)2, 1,2,4‐trichlorobenzene, 210 °C, overnight, 22 %; e) NaOH, H2O, THF, reflux, 3 h, 76 %.
In EtOAc, papillon 1 absorbed at λ abs=354 nm and emitted red light at λ e2=592 nm (without correction, Table 1, Figures 2 a, 3 a,g; spectra with correction: Supporting Information, Figure S15a). Insensitivity to solvent polarity was as reported2 and confirmed that the large red shift in emission originates from ES planarization and not from solvatochromism (Figure 3 a; Supporting Information, Figures S14, S15). A weaker emission at λ e1=465 nm from bent ES was detected with an intensity ratio I(λ e1)/I(λ e2)=I b/p=0.2 (b/p=bent/planar; Table 1, Figures 2 a, 3 a).
Table 1.
Characteristics of papillon probes.
| Cpd[a] | EtOAc 25 °C λ OP (ϵ)[b] λ TP [c] |
Φ
fl
[%][d] |
σ
(2)
[GM][e] |
EtOAc 25 °C λ e1/λ e2 [f] I b/p [g] |
H2O 25 °C λ e1/λ e2 [f] I b/p [g] |
DPPC 25 °C λ e1/λ e2 [f] |
I b/p [g] (K x)[h] |
DPPC 55 °C I b/p [g] (K x)[h] |
DOPC 25 °C I b/p [g] (K x)[h] |
DOPC 55 °C I b/p [g] (K x)[h] |
|---|---|---|---|---|---|---|---|---|---|---|
| 1 | 354 (6.7) 700 | 14.4 | 4.0 | 465/592 0.2 | 459/– >20 | 467/587 | 3.4 (0.5) | 0.7 (6.4) | 1.7 (10.1) | 0.7 (12.8) |
| 2 | 378 (4.9) 750 | 5.0 | 1.7 | 510/614 0.1 | 502/– >20 | 517/595 | 2.2 (0.3) | 0.6 (3.3) | 1.0 (10.6) | 0.5 (15.4) |
| 3 | 334 (11.7) 692 | 4.2 | 2.5 | 435/580 0.3 | 449/– >20 | 495/570 | 3.1 (3.5) | 0.4 (21.2) | 0.7 (4.9) | 0.3 (7.6) |
[a] For compounds see Scheme 1. [b] Wavelength of one‐photon absorption maxima [nm] (extinction coefficient [mm −1 cm−1]). [c] Wavelength of two‐photon absorption maxima [nm]. [d] Fluorescence quantum yield, determined using Coumarin 1 as a reference. [e] Two‐photon cross‐section, in Goeppert–Mayer (10−50 cm4 s photon−1); Supporting Information, Equation (S3). [f] Wavelength of the first (e1) and second emission maxima (e2), λ ex at the maximum of the lowest energy band (from uncorrected spectra). [g] Fluorescence intensity ratio I b/p=I e1/I e2. [h] Partition coefficient ×106. DPPC=dipalmitoylphosphatidylcholine, DOPC=dioleoylphosphatidylcholine.
Figure 2.
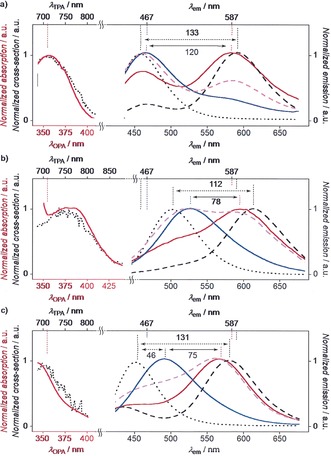
Left: Normalized one‐photon (red, solid) and reconstituted two‐photon absorption spectra (black, dotted) of 1 (a), 2 (b), and 3 (c) in EtOAc. Right: Normalized uncorrected fluorescence emission spectra of 1 (a), 2 (b), and 3 (c) in neutral water (black, dotted), EtOAc (black, dashed), So DPPC membranes at 25 °C (blue), Ld DOPC membranes at 25 °C (magenta), and Ld DPPC membranes at 55 °C (red).
Figure 3.
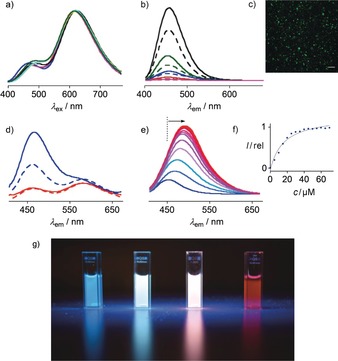
a) Normalized emission spectra of 1 in toluene, EtOAc, THF, CH2Cl2, CH3CN, DMF, and MeOH, λ ex=388 nm. b) Not‐normalized emission of 0.3 (magenta), 0.6 (red), 1.3 (blue), 2.5 (olive), and 5.0 μm (black) 1 in buffer at 25 °C (solid) and 55 °C (dashed). c) Confocal laser scanning microscopy image of 200 μm 1 in PBS buffer with 3 % paraformaldehyde; scale bar: 10 μm; λ ex=405 nm, λ em=430–500 nm (PMT detector). d) Not‐normalized emission of 1 in DPPC LUVs (solid) and DOPC LUVs (dashed), at 55 °C (red) and 25 °C (blue). e) Not‐normalized emission of 0.75 μm 3 at 25 °C with increasing concentration of DPPC LUVs. f) Emission intensity I of 3 at 495 nm as a function of DPPC LUV concentration. g) Photographs of 1 in water, So DPPC, Ld DOPC, and EtOAc (left to right) excited from the top at 366 nm in the dark with a UV hand lamp.
Core expansion in the pyrene papillon 2 shifted the absorption in EtOAc to λ abs=378 nm, with a broad plateau extending toward λ abs=400 nm (Figure 2 b). The red fluorescence from planar ES was at λ e2=614 nm also slightly red shifted. A weaker ratio I b/p=0.1 without a distinct peak for emission from bent ES intermediates around λ e1=510 nm indicated that core expansion in papillon 2 facilitates planarization in the ES. Fluorescence quantum yields dropped from Φ fl=14.4 % for 1 to Φ fl=5.0 % for 2 (Table 1), the photostability under continuous illumination was comparable to Nile Red (Supporting Information, Figure S16). The introduction of methoxy donors in papillon 3 shifted absorption and emission maxima in EtOAc to the blue and reduced photostability and fluorescence quantum yield (Table 1, Figure 2 c; Supporting Information, Figure S16).
In Tris buffer, probe 1 emitted blue light at λ e1=459 nm (Figures 2 a, 3 g). The superlinear concentration dependence, increasing with decreasing temperature, revealed the occurrence of aggregation‐induced emission (AIE)14 (Figure 3 b; Supporting Information, Figures S17, S18). This strongly blue‐shifted AIE at λ e1 suggested that amphiphile 1 forms micelles in water that pack the bent mechanophores in a manner that prevents planarization in either GS or ES but enhances fluorescence emission intensity (cmc<300 nm, Figure 1). Following a previously optimized procedure,15 small spherical particles could be observed by confocal fluorescence microscopy (Figure 3 c; Supporting Information, Figure S19). The red‐ and blue‐shifted absorption of core‐expanded papillons 2 and 3 was reflected in the AIE from their micelles in water (Figures 2 b,c, dotted, black).
The excitation maxima of papillon probes in aqueous micelles, solid‐ordered (So) DPPC membrane at 25 °C,13 liquid‐disordered (Ld) DPPC membranes at 55 °C13 and EtOAc were indistinguishable, thus confirming that GS unbending does not occur. Compared to AIE from micellar probes in water, the emission of monomers in So DPPC large unilamellar vesicles (LUVs) was much stronger (Figure 3 e; Supporting Information, Figure S8). For 1 in So DPPC compared to water, the λ e1 from bent ES red‐shifted only slightly (Δλ e1=+8 nm), and the λ e2 from planarized ES became detectable at λ e2=587 nm (Figure 2 a; Supporting Information, Figure S8). Their I b/p=3.4 confirmed that ES planarization is hindered in these highly viscous membranes (Table 1).
For 1 in DPPC LUVs at 55 °C, intensity ratios inverted to I b/p=0.7 (Table 1, Figures 2 a, 3 d, red, solid). Contributions from thermochromism,2 thermal fluctuations in viscosity16 and the transition from So into Ld membranes to this inversion were dissected using DOPC LUVs, which are in Ld phase at both temperatures (T m (DPPC)=41 °C, T m (DOPC)=−18 °C).17 At 55 °C, the emission spectra of 1 in Ld DPPC and DOPC membranes were superimposable (Figure 3 d, red). At 25 °C, however, the I b/p=1.7 in DOPC was half the I b/p=3.4 in DPPC (Table 1, Figures 3 d, blue, 2a, magenta, dashed). This remaining difference at 25 °C originated from differences between So and Ld membranes and thus demonstrated the compatibility of papillon 1 with ratiometric imaging in biomembranes.
The emission peaks from bent and planar ES in So and Ld membranes were separated by λ em=+120 nm (4380 cm−1, Figure 2 a). With probes that operate by GS untwisting, the maximal red shift in excitation achieved so far is around λ ex≈70 nm.13 The resulting dual‐emission spectra of 1 cover enough of the visible range that fluorescence photographs taken of the vesicles show the emission of white light, with the encoded ratiometric information beautifully visible in the reflections, blue for So, pink for Ld membranes (Figure 3 g).
With core‐expanded probes 2 and 3, the red‐shift in emission from bent and planar ES in So and Ld membranes decreased to Δλ em=+78 nm and +75 nm, respectively (2540 cm−1 and 2660 cm−1, Figure 2). This loss was accompanied by an increased red shift from AIE in micelles to monomer emission in So DPPC membranes of up to Δλ e1=+46 nm (Figures 2 b,c, black dotted vs. blue solid). Importantly, the residual bent ES in Ld DOPC at 25 °C decreased from I b/p=1.7 for 1 to I b/p=1.0 for 2 and I b/p=0.7 for 3 (Figure 2, magenta). More distinct spectral signatures were the consequence, culminating in a full inversion from I b/p=3.1 in So to I b/p=0.7 in Ld membranes for papillon 3 (Figure 2 c). These trends supported implications from bulk solvent that ES planarization in core‐expanded papillons 2 and 3 is facilitated compared to original 1.
The partitioning of amphiphiles 1–3 into lipid bilayers was almost instantaneous (Supporting Information, Figure S1). Partition coefficients K x, revealed an up to 10‐fold preference for Ld over So membranes (Table 1, Figure 3 e,f; Supporting Information, Figures S6–S13). For ratiometric sensing, this preference was desirable because emission from So is more intense than from Ld membranes (Figure 3 d). Independence of I b/p on probe concentration confirmed that they emit as monomers from So and Ld membranes and excluded probe aggregation as origin of the change in ratios (Supporting Information, Figures S3, S4).
Ratiometric sensing is interesting for imaging because the response is concentration‐independent. This has been achieved previously by coupling responsive and unresponsive fluorophores,4, 6 dissecting shifts of single‐emission maxima,9 and creating probes with two maxima with different response.7, 8, 9, 10, 11, 12 3‐Hydroxyflavones stand out among the rare examples for single ground states with dual emission realized so far.10 Operating by a completely different mechanism (membrane hydration sensitive),11 these ratiometric probes, like papillon 1, produce overall white fluorescence and can discriminate membranes of different order.12
Because their excitation maximum occurs at rather short wavelength for confocal laser scanning microscopy, two‐photon excitation fluorescence microscopy (TPEFM)18, 19, 20 was considered for imaging. Two‐photon absorption spectra were measured for all probes in EtOAc (Figure 2; Supporting Information, Figure S20) and cross‐sections σ (2) were determined (Table 1). Giant unilamellar vesicles (GUVs)18 composed of sphingomyelin (SM), DOPC and cholesterol (CL) are the gold standard to probe for the imaging of co‐existing liquid‐ordered (Lo) SM/CL and Ld DOPC domains, also for ratiometric detection with two‐photon excitation fluorescence microscopy (TPEFM).3, 4, 5, 6, 7, 8, 9, 10, 11, 12, 18, 19, 20 In LUVs, the DPPC membranes were preferable to characterize papillon probes because Ld‐So phase transition can be studied in the presence of the probes (T m=41 °C, Figure 3 d). To assess the comparability of these two standard conditions, emission spectra of 2 in TPEFM‐imaged Lo SM/CL 7:3 GUVs were recorded at 10 nm resolution, using 25 independent detection channels to cover the range from 400 nm to 650 nm. The obtained spectra were concentration independent up to 2 μm 2 (Figure 4 b,e) and roughly identical with those from So DPPC (Figure 2 b, blue) and Lo SM/CL LUVs (Supporting Information, Figure S5). Similarity and concentration independence were also confirmed for emission spectra of 2 in Ld DOPC GUVs (Figure 4 a,d) and LUVs (Figure 2 b, magenta).
Figure 4.
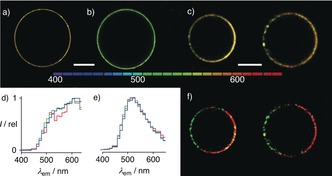
Representative hyperspectral TPEFM images (λ ex=720 nm) of GUVs composed of a) Ld DOPC, b) Lo SM/CL 7:3, and c) SM/DOPC/CL 58:25:17 (two different GUVs) in the presence of papillon 2 (color bar: emission wavelengths in the 400–650 nm range), with normalized emission spectra of entire GUVs composed of d) DOPC and e) SM/CL 7:3 with 0.5 μm (red), 1.0 μm (green), and 2.0 μm (blue) 2, and f) spectrally unmixed images of GUVs in (c) using reference spectra in (d) and (e) showing Ld (red) and Lo domains (green). Scale bar: 20 μm.
The emission spectra recorded for TPEFM‐imaged Lo (SM/CL 7:3) and Ld (DOPC) GUVs (Figure 4 d,e) were used to deconvolute the TPEFM images of SM/DOPC/CL 58:25:17 GUVs. Comparable to the white fluorescence of LUVs (Figure 3 g), non‐deconvoluted global TPEFM images of papillon 2 produced almost uniform white emission without clearly visible domains (Figure 4 c). After spectral deconvolution,20 Ld and Lo domains became visible (Figure 4 f). The emission spectra in these domains were identical with emission spectra of pure Lo and Ld GUVs.
In summary, papillon probes 1–3 allow to distinguish micelle and membrane environments with fluorescence spectroscopy, ratiometric TPEF microscopy (Figure 4), and with the naked eye (Figure 3 g). With increasingly ordered membranes, the decreasing planarization found for papillon probes is contrary to increasing planarization for flipper probes.13 This difference is interesting: Whereas flippers operate in the GS under equilibrium conditions and respond exclusively to mechanical confinement in space, papillons operate off‐equilibrium. Our results reveal that their ES unbending reports on kinetics exclusively, that is viscosity, also against expectations from sterics.
In biomembranes, fluorescent probes report on complex lipid mixtures that are exposed to chemical and physical stimulation such as tension or voltage. Their response depends on many parameters such as partitioning between different domains, positioning and repositioning in the membrane, disturbance of the local environment, and so on. In this context, the introduction of mechanosensitive membranes probes with different shape that operate with fundamentally different modes of action is of general importance because acting differently, they can be expected to respond differently and, at best, reveal characteristics of biological relevance that pass unnoticed by other probes.
Conflict of interest
The authors declare no conflict of interest.
Supporting information
As a service to our authors and readers, this journal provides supporting information supplied by the authors. Such materials are peer reviewed and may be re‐organized for online delivery, but are not copy‐edited or typeset. Technical support issues arising from supporting information (other than missing files) should be addressed to the authors.
Supplementary
Acknowledgements
We thank N. Chuard, K. Straková, J. López‐Andarias, A. Goujon, and A. Colom for assistance, the NMR, the MS, and the bioimaging platforms for services, and the University of Geneva, the Swiss National Centre of Competence in Research (NCCR) Chemical Biology, the NCCR Molecular Systems Engineering and the Swiss NSF for financial support. H.V.H. is a fellow of the Alfred Werner Foundation.
H. V. Humeniuk, A. Rosspeintner, G. Licari, V. Kilin, L. Bonacina, E. Vauthey, N. Sakai, S. Matile, Angew. Chem. Int. Ed. 2018, 57, 10559.
Contributor Information
Heorhii V. Humeniuk, http://www.unige.ch/sciences/chiorg/matile/
Prof. Stefan Matile, Email: stefan.matile@unige.ch.
References
- 1.
- 1a. Rickhaus M., Mayor M., Juricek M., Chem. Soc. Rev. 2017, 46, 1643–1660; [DOI] [PubMed] [Google Scholar]
- 1b. Kotani R., Sotome H., Okajima H., Yokoyama S., Nakaike Y., Kashiwagi A., Mori C., Nakada Y., Yamaguchi S., Osuka A., Sakamoto A., Miyasaka H., Saito S., J. Mater. Chem. C 2017, 5, 5248–5256; [Google Scholar]
- 1c. Wong W.-S., Ng C.-F., Kuck D., Chow H.-F., Angew. Chem. Int. Ed. 2017, 56, 12356–12360; [DOI] [PubMed] [Google Scholar]; Angew. Chem. 2017, 129, 12528–12532; [Google Scholar]
- 1d. Fujikawa T., Segawa Y., Itami K., J. Am. Chem. Soc. 2016, 138, 3587–3596. [DOI] [PubMed] [Google Scholar]
- 2.
- 2a. Zhang Z., Wu Y., Tang K.-C., Chen C.-L., Ho J.-W., Su J., Tian H., Chou P.-T., J. Am. Chem. Soc. 2015, 137, 8509–8520; [DOI] [PubMed] [Google Scholar]
- 2b. Wang H., Zhang Z., Zhou H., Wang T., Su J., Tong X., Tian H., Chem. Commun. 2016, 52, 5459–5462; [DOI] [PubMed] [Google Scholar]
- 2c. Li Y., Liu Y., Zhou H., Chen W., Mei J., Su J., Chem. Eur. J. 2017, 23, 9280–9287; [DOI] [PubMed] [Google Scholar]
- 2d. Chen W., Chen C.-L., Zhang Z., Chen Y.-A., Chao W.-C., Su J., Tian H., Chou P.-T., J. Am. Chem. Soc. 2017, 139, 1636–1644. [DOI] [PubMed] [Google Scholar]
- 3.
- 3a. Klymchenko A. S., Acc. Chem. Res. 2017, 50, 366–375; [DOI] [PubMed] [Google Scholar]
- 3b. Kulkarni R. U., Miller E. W., Biochemistry 2017, 56, 5171–5177. [DOI] [PMC free article] [PubMed] [Google Scholar]
- 4. Haidekker M. A., Theodorakis E. A., J. Mater. Chem. C 2016, 4, 2707–2718. [DOI] [PMC free article] [PubMed] [Google Scholar]
- 5. Sherin P. S., López-Duarte I., Dent M. R., Kubánková M., Vyšniauskas A., Bull J. A., Reshetnikova E. S., Klymchenko A. S., Tsentalovich Y. P., Kuimova M. K., Chem. Sci. 2017, 8, 3523–3528. [DOI] [PMC free article] [PubMed] [Google Scholar]
- 6. Yang Z., He Y., Lee J.-H., Park N., Suh M., Chae W.-S., Cao J., Peng X., Jung H., Kang C., Kim J. S., J. Am. Chem. Soc. 2013, 135, 9181–9185. [DOI] [PubMed] [Google Scholar]
- 7. Liu F., Wu T., Cao J., Cui S., Yang Z., Qiang X., Sun S., Song F., Fan J., Wang J., Peng X., Chem. Eur. J. 2013, 19, 1548–1553. [DOI] [PubMed] [Google Scholar]
- 8. Vyšniauskas A., Balaz M., Anderson H. L., Kuimova M. K., Phys. Chem. Chem. Phys. 2015, 17, 7548–7554. [DOI] [PubMed] [Google Scholar]
- 9. Niko Y., Didier P., Mély Y., Konishi G., Klymchenko A., Sci. Rep. 2016, 6, 18870. [DOI] [PMC free article] [PubMed] [Google Scholar]
- 10. Klymchenko A. S., Demchenko A. P., J. Am. Chem. Soc. 2002, 124, 12372–12379. [DOI] [PubMed] [Google Scholar]
- 11. M'Baye G., Mély Y., Duportail G., Klymchenko A. S., Biophys. J. 2008, 95, 1217–1225. [DOI] [PMC free article] [PubMed] [Google Scholar]
- 12. Klymchenko A., Oncul S., Didier P., Schaub E., Bagatolli L., Duportail G., Mély Y., Biochim. Biophys. Acta 2009, 1788, 495–499. [DOI] [PubMed] [Google Scholar]
- 13.
- 13a. Macchione M., Tsemperouli M., Goujon A., Mallia A. R., Sakai N., Sugihara K., Matile S., Helv. Chim. Acta 2018, 101, e1800014; [Google Scholar]
- 13b. Strakova K., Soleimanpour S., Diez-Castellnou M., Sakai N., Matile S., Helv. Chim. Acta 2018, 101, e1800019. [Google Scholar]
- 14. Mei J., Leung N. L. C., Kwok R. T. K., Lam J. W. Y., Tang B. Z., Chem. Rev. 2015, 115, 11718–11940. [DOI] [PubMed] [Google Scholar]
- 15. Macchione M., Chuard N., Sakai N., Matile S., ChemPlusChem 2017, 82, 1062–1066. [DOI] [PubMed] [Google Scholar]
- 16. Dent M. R., López-Duarte I., Dickson C. J., Geoghegan N. D., Cooper J. M., Gould I. R., Krams R., Bull J. A., Brook N. J., Kuimova M. K., Phys. Chem. Chem. Phys. 2015, 17, 18393–18402. [DOI] [PubMed] [Google Scholar]
- 17. Koynova R., Caffrey M., Biochim. Biophys. Acta 1998, 1376, 91–145. [DOI] [PubMed] [Google Scholar]
- 18.
- 18a. Bagatolli L. A., Gratton E., J. Fluoresc. 2001, 11, 141–160; [Google Scholar]
- 18b. Kaiser H.-J., Lingwood D., Levental I., Sampaio J. L., Kalvodova L., Rajendran L., Simons K., Proc. Natl. Acad. Sci. USA 2009, 106, 16645–16650. [DOI] [PMC free article] [PubMed] [Google Scholar]
- 19.
- 19a. Kilin V., Glushonkov O., Herdly L., Klymchenko A. S., Richert L., Mély Y., Biophys. J. 2015, 108, 2521–2531; [DOI] [PMC free article] [PubMed] [Google Scholar]
- 19b. Roux A., Koster G., Lenz M., Sorre B., Manneville J. B., Nassoy P., Bassereau P., Proc. Natl. Acad. Sci. USA 2010, 107, 4141–4146. [DOI] [PMC free article] [PubMed] [Google Scholar]
- 20.V. Kilin, Z. Darwich, L. Richert, P. Didier, A. Klymchenko, Y. Mély, Multiphoton Microscopy in the Biomedical Sciences XIII 2013, 85880S.
Associated Data
This section collects any data citations, data availability statements, or supplementary materials included in this article.
Supplementary Materials
As a service to our authors and readers, this journal provides supporting information supplied by the authors. Such materials are peer reviewed and may be re‐organized for online delivery, but are not copy‐edited or typeset. Technical support issues arising from supporting information (other than missing files) should be addressed to the authors.
Supplementary


