

Abstract

The oxygen evolution reaction (OER) and chlorine evolution reaction (CER) are electrochemical processes with high relevance to water splitting for (solar) energy conversion and industrial production of commodity chemicals, respectively. Carrying out the two reactions separately is challenging, since the catalytic intermediates are linked by scaling relations. Optimizing the efficiency of OER over CER in acidic media has proven especially difficult. In this regard, we have investigated the OER versus CER selectivity of manganese oxide (MnOx), a known OER catalyst. Thin films (∼5–20 nm) of MnOx were electrodeposited on glassy carbon-supported hydrous iridium oxide (IrOx/GC) in aqueous chloride solutions of pH ∼0.9. Using rotating ring–disk electrode voltammetry and online electrochemical mass spectrometry, it was found that deposition of MnOx onto IrOx decreases the CER selectivity of the system in the presence of 30 mM Cl– from 86% to less than 7%, making it a highly OER-selective catalyst. Detailed studies of the CER mechanism and ex-situ structure studies using SEM, TEM, and XPS suggest that the MnOx film is in fact not a catalytically active phase, but functions as a permeable overlayer that disfavors the transport of chloride ions.
1. Introduction
A “hydrogen economy” could allow pollution-free capture and utilization of solar power as an alternative to inherently limited fossil fuels.1 Bockris first envisioned the hydrogen economy in the 1970s as the direct electrochemical splitting of seawater into H2 and O2, driven by nuclear or solar power in desert areas near sea coasts, where the influx of solar energy is high and reliable.2,3 Use of seawater would offer the benefit of having no competition with fresh water resources and could also serve as a source of very pure fresh water originating from the eventual reverse reaction in a fuel cell.4 Despite enormous research efforts, large-scale energy storage by means of water electrolysis has not been realized yet. In large part, this is because the oxygen evolution reaction (OER), the desired anodic reaction, is inherently slow and causes major energy efficiency losses.5−7 Bockris’ original proposal raises another major challenge in saline water electrolysis, since there is the possibility of competition between OER and the oxidation of chloride ions at the anode.8,9 The latter process manifests itself as the chlorine evolution reaction (CER) in an acidic environment, leading to the formation of Cl2 gas. Contrary to O2, toxic Cl2 cannot be easily disposed of.
The competition between OER and CER is not only relevant to saline water splitting for solar energy conversion: in the energy intensive chlor-alkali process,10,11 CER is in fact the desired reaction and OER is a detrimental side reaction.12,13 Metal plating and electrochemical water treatment are other examples where control over the oxidation of water or chloride plays an important role.14,15
On the reversible hydrogen electrode (RHE) potential scale, OER and CER proceed by
| 1 |
| 2 |
The difficulty of catalyzing the OER lies in its four-electron nature, which implicates a reaction pathway involving a minimum of two or three intermediates.7,16,17 It is thus inherently more complex than CER, which involves the transfer of only two electrons and presumably only a single catalytic intermediate and is therefore a much faster reaction kinetically. Although OER has a lower equilibrium potential at low pH, the kinetic advantage of CER means that Cl2 can be the only observable product. Controlling the competition between OER and CER is not trivial, especially since it is well-established that catalyst materials that show a proficiency toward oxidation of water also tend to catalyze the oxidation of chloride, implying that the two reactions have a similar active site or partially shared reaction pathways.18−20 In recent computational work studying the presumed mechanisms of OER and CER, indeed a scaling relation has been observed between the binding energetics of the OER and CER intermediates, implying that catalysts that bind oxygen-bound intermediates strongly also bind chloride-bound intermediates strongly.21−23 In a related fashion, OER is usually accompanied by catalyst degradation, a major problem for the durability of practical electrolyzers.24−26 For pure metal oxides, the OER activity and extent of catalyst degradation during OER have been directly correlated,25,27 implying an additional “scaling relation” between activity and degradation. However, it is also known that OER activity and catalyst degradation can be decoupled, such as by mixing with appropriate heterometal oxides.28,29 On the other hand, CER does not seem to correlate strongly with catalyst degradation.30−32 Unraveling the intricacies of CER versus OER selectivity is expected to lead to “cross-linked” insights in both reactions and to aid the development of better catalytic materials for both.
The majority of research concerning competition between OER and CER has been performed in light of the chlor-alkali industry, focusing on selective CER in acidic solutions on mixed metal oxides based on RuO2 and IrO2, stabilized by TiO2 (so-called dimensionally stable anodes, DSAs).33,34 Anodes that are highly OER selective in acid are very rare, due to the favorable kinetics of the CER and the OER versus CER scaling relation described above. A notable exception is manganese oxide (MnOx), an OER-active material that has received significant interest in recent years.35−38 Initially reported by Bennet,39 anodes based on MnOx show a strong tendency to selectively evolve oxygen from acidic saline water. Hashimoto et al. studied a series of Mn-based mixed metal oxides (MMO) deposited on an IrOx/Ti substrate and showed that such anodes often exhibit nearly 100% selectivity toward OER, under a variety of experimental conditions, for many hours of sustained operation.40−43 Besides its high reported OER selectivity, MnOx is also one of the few nonprecious metal-based catalysts that has been reported to be moderately stable in acid under OER conditions.44 This stability is in strong contrast with other 3d metal oxides such as CoOx and Ni/Fe-based oxyhydroxides, materials that show very high OER activity in alkaline pH, but are unstable and inactive in acid.6,45−50
Inspired by Bockris’ vision of a hydrogen economy based on saline water splitting plants near desert coasts, we became interested in the origin of the exceptional OER selectivity of the MnO2-based materials studied by Hashimoto and co-workers. To our knowledge, the mechanism by which MnOx “breaks the scaling” between OER and CER was never thoroughly investigated. In part, we believe this was due to the difficulty of reliably measuring OER versus CER activity in situ, for which no fast, practical method existed. We have recently developed a rotating ring–disk electrode (RRDE) method with a platinum ring electrode for chlorine detection, which allows rapid and precise CER activity measurement in acidic media.51 Using this method, we reported CER behavior on amorphous IrOx, a material that is considered one of the most active and stable acidic OER catalysts.6 In the present study, we use the RRDE method to study thin films of MnOx on IrOx with respect to their OER and CER selectivity during cycling voltammetry and amperometry. Product species are also studied using online electrochemical mass spectrometry (OLEMS) measurements in combination with isotopic labeling. To gain more insight in the nature of the MnOx film, ex-situ studies of the catalyst were performed using bulk X-ray diffraction (XRD), scanning electron microscopy (SEM), transmission electron microscopy (TEM), and X-ray photoelectron microscopy (XPS). In this way, we aim to shed more light on the mechanism by which MnOx-based anodes selectively evolve oxygen and how selectivity between OER and CER may be better controlled.
2. Experimental Section
All experimental protocols and details can be found in the Supporting Information.
3. Results and Discussion
3.1. Deconvolution of Chlorine Evolution Rates during Parallel OER and CER by Means of an RRDE
For the quantification of CER rates during electrocatalyst operation, we make use of an RRDE setup with a Pt ring electrode, with the potential of the ring fixed at ERing = 0.95 V.51 This enables the quantitative measurement of Cl2 at the ring via the reduction of Cl2 back to Cl–, provided that the solution pH is below 1, to prevent hydrolysis of Cl2 into hypochlorous acid, and the concentration of chloride is above 15 mM, to prevent interference of oxide formation on the ring.51 Under these conditions, the collection factor for Cl2 (Nl) was reproducible within 2% and virtually identical to that of the Fe[CN]63–/Fe[CN]64– redox couple (Nl = 0.244; see also the Supporting Information). CER currents on the disk (iCER) can then be determined by
| 3 |
The main advantage of this method is its speed and flexibility in measuring CER activity during catalyst operation, which takes place on the disk electrode. Since the IrOx/GC catalyst under study can be considered stable under the present conditions,6 OER is the sole remaining reaction, and direct quantification of the OER current (iOER) is possible via
| 4 |
where iDisk equals the disk current, corrected for (pseudo)capacitance by taking the average of forward and backward scans. Following the determination of iOER and iCER, the selectivities toward CER (εCER) and OER (εOER) are calculated from
| 5 |
Figure 1 illustrates how the RRDE method is implemented, comparing disk and ring currents for chloride concentrations of [Cl–] = 0 mM and [Cl–] = 30 mM. By observing the ring current, the onset of CER can be located at around 1.42 V, meaning it proceeds with negligible overpotential at pH = 0.88. We can then compare iDisk in the absence of Cl–, which is equal to “pure” OER current, and iOER in the presence of 30 mM KCl, as calculated from eq 4. As was reported previously,51 OER is not strongly affected by either the presence of Cl– or parallel CER under the used conditions. Furthermore, selectivity toward CER is approximately 86% near 1.55 V.
Figure 1.
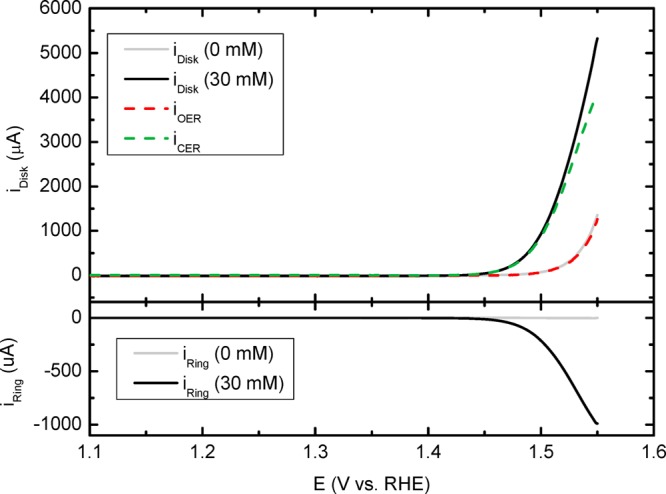
Representative potential scans of mixed OER and CER in 0.5 M KHSO4 (pH = 0.88), to illustrate the RRDE method for aqueous Cl2 detection. Top panel displays currents measured on the IrOx/GC disk (iDisk) in a Cl–-free solution (gray curve) and in the presence of 30 mM KCl (black curve). Rotation rate: 1500 rpm. Lower panel shows corresponding currents on the Pt ring (iRing) fixed at ERing = 0.95 V. Calculation of iOER and iCER curves was performed using eq 3 and eq 4.
Although a chloride concentration of 30 mM is far removed from realistic seawater concentrations, which typically exceed 0.5 M, the use of such concentrations would compromise the ability to carry out fundamental CER studies, due to increasing experimental noise levels and interference of gas bubbles in the RRDE setup. In consideration of our previous study, where we observed no obvious changes in CER behavior for Cl– concentrations up to 100 mM,51 we believe a concentration of 30 mM chloride constitutes an optimal system for study.
3.2. Effect of MnOx Deposition on Chlorine Evolution
In acidic media, deposition of MnOx can proceed via the overall reaction
| 6 |
To form MnOx films on IrOx and study their effect on CER selectivity, we resorted to growing MnOx thin films in situ by “spiking” the working solution with 0.6 mM MnSO4. This small but significant concentration of Mn2+ ions prevents the net dissolution of the acid-unstable MnOx films during experiments.44,52 Despite obvious disadvantages, such as lack of precise control over film thickness during scanning, this method allows the growth and study of thin MnOx films of variable thickness in an identical system, without the severe uncertainty of the film’s integrity (and problems concerning buildup of dissolved Mn2+ in the solution, in the case of repeated externally grown MnOx films). It is thus possible to measure how CER kinetics depend on MnOx film growth.
Figure 2 shows CVs from 1.1–1.55 V of an IrOx/GC electrode, in the presence of 30 mM KCl and 0.6 mM MnSO4, under a 1500 rpm rotation rate. Compared to a Mn2+-free solution, MnOx deposition manifests itself as a superimposed current with a slow onset near 1.37 V (see Figure S4 for a close-up). To grow MnOx films of variable thickness and to test their effect on CER activity, we first conditioned the disk electrode at EDisk = 1.48 V, while rotating at 1500 rpm. The conditioning potential was chosen such that it was more positive than EMnOx/Mn2+eq (approximately 1.13 V at pH = 0.88), but not too far into the mixed OER/CER region as to prevent excessive gas formation during deposition. Immediately after conditioning, the electrode was scanned up to a positive potential limit of E = 1.55 V. At the same time, the ring was kept at ERing = 0.95 V; analogous to results described in Section 3.1, the ring is assumed to act as a selective probe for chlorine. Formation of Cl2 can be seen in both the forward and reverse sweep. During the reverse scan, complete cathodic dissolution of the MnOx films appears as a reduction wave from approximately 1.450 to 1.15 V. Dissolution of the film effectively “resets” the working electrode, and the charge under the reduction peak (described as QMnOx) allows to approximate the thickness of the film that was originally present in the forward scan. Repeated scanning without preconditioning led to overlapping CVs, with reproducible peak currents, ring currents, and cathodic MnOx dissolution peaks, showing that the original system is restored every time after traversing the negative potential limit of 1.10 V (see Figure S5). A Mn2+ concentration of 0.6 mM was purposefully tested as optimum: lower concentrations led to impractically long deposition times, and higher [Mn2+] (>1 mM) often resulted in films that were too thick to completely dissolve after returning to 1.10 V. This was evident from a remaining brown-red glow on the electrode surface and significant but slowly subsiding negative current when the potential was kept at 1.10 V. Thicker films also occasionally led to mechanical instability in the form of brown MnOx flakes peeling off the electrode during rotation. Keeping [Mn2+] as low as possible also reduced the extent of continuous (uncontrolled) MnOx deposition current during scanning and allowed a more accurate comparison of iOER and iCER, as will be discussed below.
Figure 2.
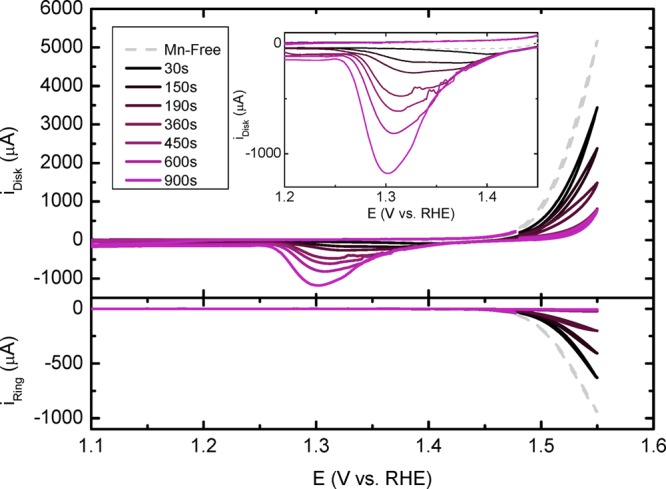
Top panel shows CVs of an IrOx/GC rotating disk electrode (top) in 0.5 M KHSO4, 30 mM KCl (pH = 0.88), and 0.6 mM MnSO4 (except for the Mn2+-free experiment). Rotation rate: 1500 rpm. MnOx films were preconditioned at various times at 1.48 V before initiating the forward scan at 1.48 V. The lower panel shows the corresponding iRing (ERing = 0.95 V).
Figure 3 displays the measured disk and ring currents for EDisk = 1.55 V as a function of QMnOx, the charge determined from the MnOx dissolution wave in the corresponding reverse sweeps. We chose the potential of 1.55 V for quantitative analysis, since this is the point of potential reversal and as such contains minimal current contributions from (pseudo)capacitive processes. To be able to compare directly, ring currents iRing are corrected for Nl to obtain iRing′. The distinction between iRing′ and iCER will be discussed shortly. The deposition of MnOx has a profound effect on both iDisk and iRing′, but the most interesting aspect is the selectivity: iRing′ is impacted very differently than iDisk. As QMnOx varies within 0–2 mC, a proportional decrease in both iDisk and iRing′ can be seen, leading to an approximately constant ratio iRing′/iDisk (Figure 3, inset). For QMnOx > 2 mC, the ratio iRing′/iDisk shows a sudden drop. We also observe a change in shape of the MnOx reduction wave as QMnOx increases above 2 mC: below 2 mC, a single, broad reduction peak is observed, which transforms into two peaks for QMnOx > 2 mC, with peak potentials shifting continuously more negative as the reduction charge increases (see also Figure S6 and Figure S7). The appearance of separate peaks may be due to proton diffusion becoming the limiting factor during film reductive dissolution.53,54
Figure 3.

Disk (blue) and ring currents (green) measured at EDisk = 1.55 V as a function of QMnOx, the reductive charge measured for the corresponding MnOx film during the backward scan, which is an approximate measure of its thickness. Inset shows the ratio between iDisk and iRing corrected for Nl (iRing′). Values were determined from CVs such as those in Figure 2.
Unfortunately, the quantification of iOER and iCER in the presence of Mn2+ is obfuscated by Mn-related redox processes, in contrast to the measurements on MnOx-free IrOx in Section 3.1, where it was assumed that OER and CER were the sole reactions. There are two reasons for this: first, iDisk after subtraction of iRing′ is no longer “pure” OER current, but the sum of OER and MnOx deposition current. Second, close inspection of the ring currents (Figure S4) suggests reduction of a species that appears at a potential slightly more negative than the onset potential of CER. We ascribe this additional current to the reduction of solution-phase Mn3+.55 This species originates from the disk and is a generally accepted intermediate during acidic MnOx deposition.53,54,56 Ring currents can thus no longer be ascribed solely to CER (iRing′ ≠ iCER). To take these two sources of error into account, we use the following correction. The diffusion-limited current density of MnOx deposition (iMnOxL) is estimated at 140 μA using the Levich equation (see the Supporting Information). This value serves as an “upper limit” of the MnOx deposition current during OER and CER. Likewise, the maximum ring current originating from Mn3+ reduction can be estimated at 70 μA, representing an upper limit of ring current falsely attributed to CER. For QMnOx < 2 mC, where iRing′ > 1800 μA, we assume this error to be negligible, but at QMnOx > 4 mC, the remaining ring current approaches 30 μA. In this regime, the ring current may not be unambiguously assigned to CER, and the real CER current could be significantly lower.
To still make an estimation of OER versus CER selectivity, we assume the worst-case scenario in terms of OER selectivity: this translates to (i) assuming that MnOx deposits with diffusion-limited current densities at all potentials, allowing the calculation of the minimum OER current after ring current subtraction, and (ii) assuming that the Nl-corrected ring current iRing′ originates only from CER, irrespective of QMnOx, leading to the maximum possible CER current. In other words, eq 3 applies, like the case for the “blank” IrOx catalyst: iRing′ = iCER. We thus use the following expression for iOER:
| 7 |
Figure 4 displays the calculated currents and selectivities toward OER and CER as a function of QMnOx. As already suggested by the ratio iRing′/iDisk in Figure 3, εOER rises sharply at the expense of εCER beyond a MnOx reduction charge of 2 mC. We will refer to the reduction charge of the MnOx film at which there is a strong shift of selectivity from CER toward OER as the “critical MnOx charge”. Figure 4 shows that modification of IrOx by growth of a thick MnOx film makes it >90% OER selective with a moderate (45%) drop in activity.
Figure 4.

Top panel: currents for OER (red) and CER (green) at E = 1.55 V, calculated from eq 3 and eq 7. Lower panel: corresponding selectivities toward OER (red) and CER (green). Data are plotted as a function of QMnOx, the charge ascribed to the corresponding MnOx layer, which is an approximate indication of its thickness. Values were determined from CVs such as those in Figure 2.
The dependence of CER kinetics on MnOx deposition can be studied by making Tafel plots based on measured ring currents (Figure 5), especially at high ring currents where the error from Mn3+ reduction is negligible. On “bare” IrOx, as well as during the initial stages of MnOx film growth (QMnOx < 2 mC), CER Tafel slopes range within 40–45 mV/dec, suggesting a rate-limiting second electron transfer step controlling the CER mechanism, in correspondence with previous literature.19,57 The Tafel curves in this regime show good linearity, as determined from R2-values in the inset of Figure 5. As QMnOx increases beyond the critical charge, Tafel slopes increase to ca. 120 mV/dec. This value agrees remarkably well with a mechanism where the first electron transfer step becomes rate-determining, suggesting that the apparent kinetics of the reaction change. However, a pronounced departure from linearity is also apparent (Figure 5 inset), suggesting that the measured Tafel slopes become clouded by additional effects. Above all, we expect the error from Mn3+ reduction to be high here, and the measured Tafel slope may well be related to the solution phase oxidation of Mnaq2+ to Mnaq on the disk (assuming a symmetry factor α of nearly 1/2).
Figure 5.

Tafel slopes for CER on the disk electrode, constructed from ring currents, as a function of QMnOx. Values taken from CVs similar to Figure 2. Inset shows corresponding R2 values (correlation coefficients), to illustrate the degree of linearity as a function of QMnOx.
To gain more insight in the sudden change in CER activity, we recorded ring–disk amperometry curves to study the potential-dependent deposition behavior of MnOx on IrOx (Figure 6). The ring currents in the lower panel were normalized versus their initial value (iRing,t=0), to compare the relative decrease in CER for different potentials. An increase in EDisk has a 2-fold effect: (i) iDisk initially increases strongly, which is due to a rise in CER current (top panel), and (ii) CER rates start declining earlier (lower panel). It was previously postulated that MnOx deposition proceeds through a progressive electrochemical nucleation and growth mechanism, in which the current contribution from the growth of existing nuclei is larger than current from the formation of new nuclei.58−60 Our own findings suggest that MnOx deposition at 1.45 V on amorphous IrOx near pH = 1 is kinetically controlled and proceeds via a similar mechanism, since the deposition current shows an induction time followed by a peak (Figure S9). The observed drop in CER activity would then coincide with the moment where the exclusion zones of the individual MnOx nuclei intertwine and the full coverage of the IrOx surface by MnOx rapidly increases.
Figure 6.

Top panel: amperometry measurements at increasing potentials of an IrOx/GC rotating disk electrode (top) in 0.5 M KHSO4, 20 mM KCl, and 0.6 mM MnSO4 (pH = 0.87), rotation rate 1500 rpm. The lower panel shows the corresponding iRing normalized to their initial value iRing,t=0 (ERing = 0.95 V).
To corroborate the RRDE findings, we measured the competition of CER versus OER on IrOx and the effect of MnOx deposition using OLEMS. Since the use of a stationary electrode is required in the OLEMS setup, we used a stirrer bar at ∼600 rpm to enhance mass transport of chloride and Mn2+ and reduce the effects of transient broadening of the diffusion layer. Despite this, mass transport to the surface was significantly lower than in the RRDE setup. To ensure a strong enough Cl2 mass signal in the OLEMS and to reach MnOx film growth comparable to the RRDE experiments, a relatively high concentration of chloride (80 mM) and MnSO4 (1.2 mM) was used. In Figure 7A, cyclic voltammetry was performed on an IrOx/GC electrode with a significant amount of MnOx predeposited at 1.460 V, after which three cycles were carried out in the potential region of mixed CER, OER, and MnOx deposition. The initial forward sweep starting from 1.460 V shows a relatively low maximum current, and the backward sweep shows a wave where the preformed MnOx layer is reductively removed. In scans 2 and 3, the IrOx electrode was scanned into the CER/OER region again, such that the electrode was free of preformed MnOx. Mass signals m/z 32 and m/z 70 (corresponding to O2+ and Cl2+, ionized molecular oxygen and chlorine, respectively) were collected in the mass spectrometer during the scans. Both species have peaks in the mixed OER/CER region as expected, but there are major differences between the three cycles. The rate of Cl2 formation is clearly suppressed during the first cycle, then strongly increases in cycles 2 and 3. The O2 mass signal in the first scan shows significant trailing and is also higher than in scans 2 and 3. Comparison of results from scan 1 and scan 2 suggests that the emergence of CER activity is coupled to a decrease in OER activity. This appears to contradict the previous results from the RRDE method that OER and CER are independent. However, we want to note that the amount of chlorine produced in cycles 2 and 3 was rather high, which was necessary to obtain a sizable m/z 70 signal, as the majority of produced Cl2 dissociates and recombines in the ionization chamber to form HCl+, mass signal m/z 36.61 It is thus highly likely that the collection efficiency of O2 was affected by the vigorous chlorine evolution near the electrode surface. Nonetheless, we believe the most important result of the OLEMS measurements is the strong suppression of chlorine evolution in the first cycle, meaning that on an IrOx/MnOx electrode, O2 is formed highly selectively.
Figure 7.

OLEMS measurements of an IrOx/GC disk electrode in 0.5 M KHSO4, 80 mM KCl, and 1.2 mM MnSO4 (pH = 0.89). (A) CVs of the electrode after preconditioning for 450 s at 1.46 V, followed by three scans. Scan rate: 5 mV s–1. (C) Amperometry at 1.500 V for 600 s. (B and D) Corresponding OLEMS mass signals over time. Solution is saturated with Ar. A stirrer bar at ∼600 rpm was employed to increase mass transport.
In Figure 7C, current versus time curves were recorded at 1.50 V to investigate the effect of transient MnOx deposition, along with changes in O2 and Cl2 mass signals (Figure 7D). In the current profile, the semisteady current declines abruptly after ∼100 s, converging to a current of around 200 μA. The abrupt decline is reminiscent of results in Figure 6 and correlates with a selective decrease in the Cl2 signal.
3.3. Structure of the MnOx/IrOx Film
The results in the previous sections show that during mixed OER and CER on an IrOx electrode covered by a MnOx film, there is a decrease in oxidation current coupled to strongly enhanced selectivity of OER over CER with an increase of the coverage by the MnOx film, as well as a change in the apparent CER Tafel slope. Besides the origin of this selectivity shift, a relevant question concerns the degree to which MnOx is catalytically active under these conditions. OLEMS measurements on a MnOx/GC sample in an acidic solution, without IrOx present, showed no detectable activity for OER or CER (Figure S11), in accordance with previous literature. However, it has been reported that the crystal phase and oxide stoichiometry of MnOx as well as the existence of metal–support interactions can greatly affect the OER performance.62−65 We thus wanted to study the structure of the deposited materials.
For structural studies, films were grown hydrodynamically in ClO4– solutions in the presence of 20 mM Cl–, allowing use of the ring electrode to monitor the rate of chlorine evolution during deposition. An amount of MnOx was deposited such that the CER rate was approximately 50% of the initial value (Figure S12). The nature of the MnOx films in the following studies should thus be close to films corresponding to the critical MnOx charge of 2 mC discussed earlier. MnOx films grown in ClO4– and HSO4– electrolytes showed identical morphologies in SEM and likewise behavior of εCER versus QMnOx, suggesting that adsorption of HSO4– inhibits MnOx deposition but does not alter its mechanism (Figure S10).
Figure 8A shows a SEM micrograph of a representative IrOx/GC film, with a morphology corresponding well to previous reports.66−69 The GC surface is covered by a thin layer of nanoparticulate IrOx, as was revealed by drying-induced cracks of the film (see Figure S14B). We also occasionally observed mesoporous clusters of IrOx particles with diameters of 50–150 nm (Figure 8B). The clusters generally occupied less than 4% of the GC electrode surface area, as estimated from SEM images of a large section of the electrode. Figure 8C and D show SEM micrographs of MnOx/IrOx/GC samples, the films grown in the presence of 20 mM Cl– and representing “50% CER activity”: compared to MnOx-free conditions. A porous structure of thin intertwined sheets is visible on top of the IrOx particles and layer, which is composed of MnOx, as verified via energy-dispersive X-ray spectroscopy (EDS) analysis. From the SEM micrographs, the MnOx sheet thickness is within 8–10 nm (Figure S14A). MnOx deposited on GC in the absence of IrOx forms a similar structure (Figure S14C). The MnOx morphologies resemble earlier SEM results of δ-MnO2 (Birnessite), a poorly crystalline polymorph of MnO6 octahedra arranged as sheets (see also Figure S14D for micrographs of MnOx formed during extended deposition times).70−73 However, we cannot draw conclusions about the MnOx structure on the basis of SEM morphology alone.
Figure 8.

SEM micrographs of representative electrodes used in this study. (A and B) IrOx/GC electrode, deposited according to the procedure described by Nakagawa et al. (C and D) MnOx/IrOx/GC electrode; MnOx was deposited onto IrOx/GC as described in the text.
We attempted to take XRD spectra of IrOx and the combined Mn/Ir oxide, using samples as-deposited on GC (see Figure S13). Besides the GC background, no diffraction peaks were observed, suggesting that the IrOx and MnOx are amorphous. Previous studies of hydrated IrOx colloids, as well as MnOx deposited at constant potential, also reported amorphous structures.62,69,74,75 We must note that the films may be too thin to lead to sufficient signal in the diffractometer, although an attempt was made to compare the diffraction patterns to a small quantity of highly crystalline RuO2. Alternatively, IrOx nanoparticles were precipitated and isolated from acidified colloid solutions. Even when scanning such bulk samples, we could not observe XRD peaks.
To obtain more structural information on the MnOx/IrOx samples, we performed TEM measurements along with EDS and selected-area electron diffraction (SAED). Figure 9 shows bright-field TEM micrographs of a MnOx/IrOx film that was carefully scraped off the GC electrode. IrOx nanoparticles with a diameter of 2–4 nm as well as occasionally larger particles were visible (Figure 9A and B), similar to results from Zhao et al.66 Like the SEM results, a veiny MnOx deposit could be seen (verified by EDS); the ∼8 nm thick sheets were visible in the microscope (Figure 9D). Despite the much higher diffraction cross-section in comparison with XRD, most SAED experiments led to diffuse patterns. We could sporadically obtain better defined radial profiles, roughly corresponding to rutile-IrO2 (Figure 9C).76,77 In the microscope, a rare instance of a crystallite that was also properly oriented showed a d-spacing of 3.18 Å, corresponding to the rutile IrO2 (110) plane.78 We also generated SAED patterns at higher beam accelerating voltages of 200 keV (Figure S17), the result of which showed sporadic rutile-related diffractions from IrO2 and β-MnO2. Unfortunately, significant contributions from metallic Ir (and possibly Mn) were also present, likely due to beam radiation damage.79
Figure 9.

TEM micrographs of a MnOx/IrOx film that was grown identically to the films used for SEM in Figure 8, then carefully scraped off the GC support for imaging. (A) Sheets of amorphous IrOx particles, having diameters in the range of 2–4 nm. (B) Larger IrOx particles (diameter ∼60 nm) within the film. (C) SAED pattern of the area shown in B. Diffuse diffraction rings corresponding to rutile IrO2 are visible. The also present MnOx does not generate a clear contribution to the pattern. (D) Intertwined MnOx sheets perpendicular to the beam direction, as also seen in SEM micrographs.
To probe the electronic structure and the extent of interaction between the two oxides, we performed ex-situ XPS on a representative MnOx/IrOx/GC film, as well as on single oxide reference samples termed MnOx/GC and IrOx/GC. Core-level Ir 4f scans were performed, as this peak is considered a reliable probe for determining the average Ir oxidation state.78,80,81 The magnitude of the Mn 3s peak multiplet splitting serves a similar function in Mn.82,83 Additional narrow spectra of the O 1s and Cl 2p peaks are shown in the Supporting Information (Figure S19 and Figure S20). In Figure 10, the IrOx/GC sample has a 4f7/2 core-level binding energy of 62.4 eV, with a pronounced asymmetry indicating contributions of multiple oxidation states. The obtained binding energy is close to values reported for hydrous iridium oxides lacking long-range order.78,84 IrOx/GC has mainly Ir4+ centers, but a significant contribution of Ir3+ is apparent, with an estimated Ir3+:Ir4+ ratio of 0.27. The MnOx/GC sample shows a Mn 3s peak splitting of 5.1 eV, corresponding to an average oxidation state between 3+ and 4+. The nonintegral average oxidation states of IrOx and MnOx suggest nonstoichiometric oxides and disordered structures, consistent with the diffraction experiments. In the MnOx/IrOx/GC sample, Mn peaks dominate the spectral features (Figure S18). Most of the signal originates from the MnOx overlayer, as was also verified from the appearance of a large O 1s contribution at 529.9 eV, and by comparing Mn:Ir ratios determined from XPS and amperometry deposition data (Table S1). We could nonetheless still observe the Ir 4f peak, with a peak fitting-derived binding energy of approximately 62.5 eV (see Figure 10), a shift of +0.1 eV relative to IrOx/GC. The signal intensity was too weak for a more elaborate peak deconvolution. A relevant question is whether the Ir sites contributing to the weak Ir 4f peak are covered by MnOx, which was suggested by the SEM measurements. The reductive charge QMnOx of grown MnOx films corresponds to a layer roughly 10 nm thick, approaching the limit for the detection depth of XPS. The weak Ir 4f peak in the sample shows a strong prevalence of inelastic scattering in the form of tailing at higher binding energies and a rise in background scattering that is disproportionately higher than the IrOx/GC reference (Figure S21). We thus assume that the weak XPS Ir 4f peaks originate from subsurface Ir and that this Ir must be in intimate contact with the MnOx layer. The Mn 3s peak splitting in MnOx/IrOx/GC is 5.2 eV, a difference of +0.1 eV with respect to the MnOx/GC reference sample. This shift may indicate a lowering of the average oxidation state,82 but the shift is small and negligible within the margins of experimental error (±0.1 eV).
Figure 10.

Core-level XPS scans of the Ir 4f (left) and Mn 3s (right) spectral peaks, on an absolute intensity scale. Both elements were scanned in samples of their MOx/GC single oxides (top panels) and the mixed MnOx/IrOx/GC sample (lower panels). Note the difference in scale in the lower left-hand panel, illustrating the relatively low intensity of the Ir 4f signal.
Summarizing our structural studies, we find that the formed MnOx and IrOx are amorphous and probably form nonstoichiometric oxides. The MnOx catalyst without IrOx showed no activity in OLEMS, and we could also see no evidence of a strong interaction between Mn and Ir from the almost identical Ir 4f binding energies and Mn 3s multiplet splitting in XPS. This makes it doubtful whether the close proximity of and interaction with IrOx could somehow activate MnOx for OER.
3.4. Isotopically Labeled OLEMS Measurements and OER Studies on an RDE
Given the lack of electronic interaction between MnOx and IrOx suggested by the detailed characterization described in the previous section, we undertook isotopically labeled OLEMS measurements to further probe the origin of the OER/CER selectivity of the MnOx/IrOx/GC electrode. We also looked more closely into the OER behavior of the selective catalyst using RDE experiments.
In Figure 11A and B, we performed isotopic labeling experiments on MnOx/IrOx/GC in an attempt to determine the origin of the oxygen produced by the catalyst. This is made possible by the tendency of oxygen of the IrOx lattice to participate in the OER mechanism.85 First, the IrOx lattice oxygen was partially exchanged with the 18O isotope by performing OER in a 0.1 M KHSO4 solution of “marked water” (H218O).85,86 MnOx was then grown in “regular water” at 1.45 V (a potential just before the OER onset), and OLEMS measurements were performed on this Mn16Ox/Ir18Ox/GC electrode. By observing changes in the ratio of mass/charge signals 34 and 32,87 we were able to determine whether the oxygen formed originated from MnOx (leading to 16O2 and no enrichment in the m/z 34 signal) or Ir18Ox (partially producing 18O–16O and changing the 34/32 ratio). At this point, 18O2 can also be formed; unfortunately, the mass charge ratio of this species (m/z 36) coincides with that of HCl+, a species formed in the ionization chamber, and as such this signal is ambiguous. As can be seen in Figure 11B, the catalyst shows an enrichment of 18O during OER in the first scan. The produced oxygen thus at least partially originates from the subsurface IrOx layer. The OLEMS experiments were conducted in the presence of chloride, which allowed the monitoring and comparison of MnOx film growth, as well as ensuring that the experimental conditions were as close as possible to previous OLEMS experiments. In scans 2 and 3, we can see a current increase attributable to increased CER after MnOx reductive dissolution, in agreement with results from Figure 7. Figure 11C shows OER measurements in a Cl–-free solution of an IrOx/GC catalyst with a pregrown MnOx film, compared to the same catalyst in a Mn2+-free solution. A nonadsorbing ClO4– solution was chosen over HSO4– in this experiment since it led to higher OER rates and faster MnOx growth. The two curves arguably have almost identical onset potentials and very similar Tafel slopes (40 versus 43 mV/dec for IrOx and MnOx/IrOx, respectively). Both experiments shown in Figure 11 give strong evidence for the conclusion that the MnOx film itself is inactive for OER, and the OER activity stems from the IrOx underneath the MnOx film.
Figure 11.
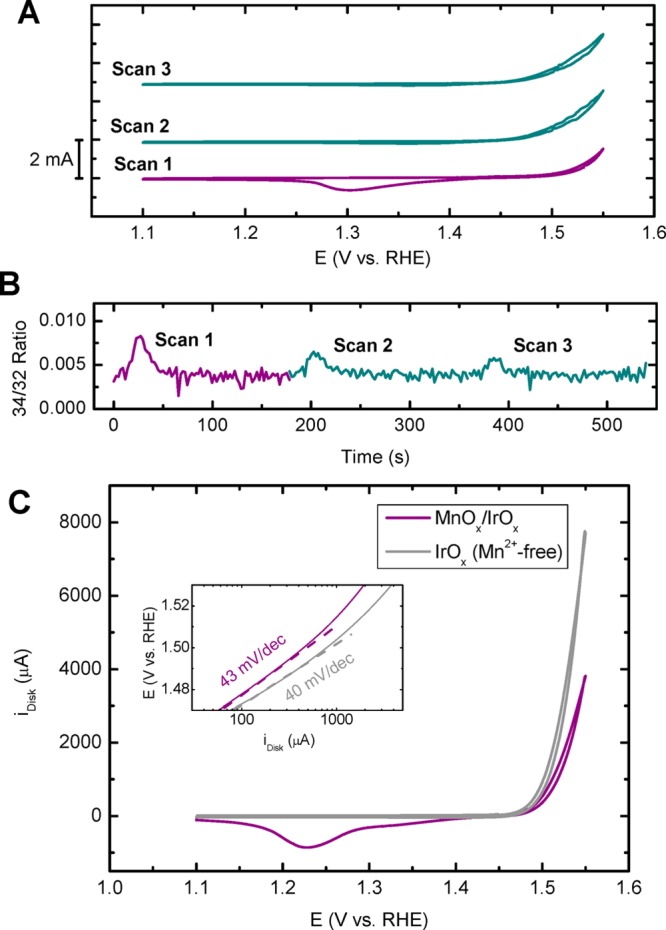
(A and B) OLEMS measurements of an “MnOx/Ir18Ox/GC” electrode in 0.5 M KHSO4, 30 mM KCl, and 1.2 mM MnSO4 (pH = 0.87). The isotopic labeling procedure is described in the text. The electrode was scanned three times (A), while monitoring the mass/charge ratio 34/32 (B). Scan rate: 5 mV s–1. (C) CVs of an IrOx/GC rotating disk electrode in 0.5 M Na/HClO4 (pH = 0.85), in a Mn2+-free solution (gray) and in the presence of 0.6 mM Mn(ClO4)2 with a preconditioned MnOx film before initiating the forward scan at 1.45 V (purple). Inset shows calculated Tafel slopes determined from forward–backward averaged disk currents. Scan rate: 10 mV s–1; rotation rate: 1500 rpm. All solutions are saturated with Ar.
3.5. General Discussion on the Origin of the OER/CER Selectivity
From the above results, we conclude that a MnOx film facilitates the selective formation of O2 over Cl2, in agreement with previous literature.39,40 However, contrary to what was previously assumed (at least implicitly), our results show that MnOx is not actually a catalytically active phase. This conclusion is in fact in agreement with previous literature: MnOx is generally not very active for OER in strongly acidic media (pH < 1) and certainly cannot be expected to show significant activity within the potential window employed in this work.37,44,50,88,89 From the OLEMS results, it is clear that MnOx/GC in the absence of IrOx is not active for either CER or OER at pH ∼0.9, even at high potentials of 1.8 V (Figure S11). Combined with the XPS measurements that indicate very little electronic interaction between MnOx and IrOx, it is therefore highly unlikely that MnOx “takes over” OER and CER catalysis from IrOx when it is deposited. Another feature that strongly disfavors MnOx being the active catalyst is the OER ability seen in Figure 11C. The MnOx/IrOx/GC electrode displayed an OER current of nearly 5 mA·cm–2 (electrode area 0.196 cm2) at an overpotential of 300 mV, which is at least 3 orders of magnitude higher than even the most optimal performing MnOx catalysts in alkaline media.62 The OER current also has a Tafel slope of ∼43 mV/dec, which is very close to 40 mV/dec, the OER Tafel slope of the unmodified IrOx catalyst. We note that a Tafel slope of less than 60 mV/dec has never been reported for OER on MnOx at any pH. Finally, OLEMS experiments with isotopically labeled IrOx (Figure 11A and B, first scan) show that the IrOx partakes in OER, despite the existence of a MnOx layer.
Instead of MnOx being an exceptional catalyst that breaks the apparent scaling between CER and OER, we suggest that the catalytically inert MnOx functions as a porous overlayer that disfavors the transport of chloride ions, as was also proposed by Bennet.39 Previous literature suggests that MnOx deposited at a constant anodic potential usually forms γ-MnO2 (Nsutite) or δ-MnO2 (Birnessite) motifs, where formation of δ-MnO2 seems preferred over γ-MnO2 in the case where the Mn2+ concentration is in the mM range.71−73,90−92 The δ and γ polymorphs are both nanoporous and readily intercalate water and cations. From Cl 2p XPS measurements (Figure S20), we detected the presence of an alkali-metal chloride in the IrOx/GC electrode, which can be ascribed to NaCl trapped within the mesoporous IrOx clusters. By contrast, MnOx/GC displayed no Cl 2p features (despite being grown in a Cl–-containing solution) and neither did MnOx/IrOx/GC, which we interpret as chloride being unable to penetrate the MnOx film. Furthermore, in the OLEMS results in Figure 7, the O2 signal of scan 1 shows strong tailing, persisting for nearly 100 s after starting the experiment, which translates to O2 detected down to 1.15 V in the backward scan. We ascribe this effect to O2 trapped in the MnOx porous structure, which is liberated upon MnOx dissolution.
Scheme 1 sketches the origin of the observed selectivity behavior with MnOx deposition (Scheme 1). Starting from the “bare” IrOx film, initial MnOx deposition (0 < QMnOx < 2 mC) is accompanied by a mild and approximately proportional decrease in OER and CER activity (Figure 3 and Figure 4), implying that at these low coverages both reactions are hindered. The corresponding Tafel plots extracted from the ring currents (Figure 5 and Figure S8) show that the CER slopes retain a value of ∼40 mV/dec, but are shifted gradually upward to higher potentials. A similar effect during the study of CER was reported before by Mozota and Conway93 and would imply a decrease in the number of active sites with an unchanging reaction mechanism. From electron microscopy micrographs, the MnOx forms a porous network of amorphous sheets. The dramatic selectivity shift at QMnOx > 2 mC then presumably arises when the growing MnOx sheets start to intertwine and fully cover the IrOx electrode. MnOx deposition at this stage seems to solely inhibit CER, whereas OER remains relatively unaffected, suggesting that at this point the film growth is intrinsically different from its initial deposition stage.
Scheme 1. Sketch of the IrOx/GC Catalyst (A), Deposition Structure of MnOx Deposition on MnOx/IrOx/GC (B), and a Side-View (C) Showing the Isotopic Labeling Experiment in Figure 11A and B.

The MnOx forms a porous, amorphous network on top of the IrOx layer, blocking CER by preventing Cl– from reaching the IrOx underneath.
Participation of sub-surface IrOx in OER is apparent from detection of the enriched m/z 34 signal.
When “fully grown”, the amorphous MnOx film still seems to allow transport of H2O, H+, and O2 between IrOx and the electrolyte. The decreased selectivity versus CER can thus be explained on the basis of concentration overpotentials, in line with recent reports on electrocatalysis at “buried interfaces” by Takanabe et al.94 and Esposito et al.95,96 The slow transport of chloride through the MnOx phase means that near the buried IrOx interface both the chloride diffusion coefficient and concentration gradient are lowered. This leads to a significant increase of the diffusion layer thickness and an effective increase in the CER overpotential. We further verified the anion-deflecting behavior of MnOx by performing OER using a MnOx/IrOx/GC catalyst in the presence of bromide ions (Figure S22). In a fashion analogous to Section 3.1, we used the Pt ring as a probe for bromine reduction. We found that the blocking of the bromine evolution reaction is strongly coupled to the presence of the MnOx film. Lastly, the effect of MnOx deposition on CER selectivity was verified using a Pt disk electrode as CER catalyst (Figure S23). A MnOx/Pt electrode evolved insignificant amounts of Cl2, whereas the OER onset could be seen near 1.7 V, which is reminiscent of the previously reported OER onset on bare Pt.97
IrOx was also present in the MnOx-based seawater anodes by Hashimoto et al., for which thick heterometal-doped MnOx coatings were grown on Ti-supported IrOx (IrOx/Ti). The IrOx was added with the intention of preventing the formation of insulating TiO2 during electrode operation. We believe the OER-selective MnyM(1–y)Ox/IrOx/Ti anodes operate in a similar fashion to our MnOx/IrOx/GC catalyst under study and that the IrOx layer may have been crucial for the relatively low polarization resistance during the galvanostatic experiments. The OER selectivity effect of different dopants may have been due to modified MnOx film stability or morphology under the strongly oxidizing operating conditions.
Application of selective blockage of chloride in seawater electrolysis was recently demonstrated by Ravichandran et al.98 An analogous case of selectivity induced by a catalytically inert film is likely at hand in the industrial chlorate process, where Cr(OH)3-coated cathodes are used for selective hydrogen evolution.13,99,100 The H2-selectivity of the chromium film has been suggested to stem from the selective blocking of dissolved ClO– anions and oxygen. Interestingly, MnOx has been recently suggested as a promising alternative to the use of Cr(VI) for the selective hydrogen evolution.101
4. Conclusion
In this work, we have investigated the unusual OER over CER selectivity of MnOx-based anodes in the context of hydrogen production from acidic saline water electrolysis. Deposition of a thin MnOx film onto glassy carbon-supported IrOx moderately decreases the catalytic activity and strongly shifts the product selectivity from Cl2 toward O2, once a critical MnOx film charge QMnOx of approximately 2 mC (10 mC cm–2) is reached. The MnOx deposit is catalytically inactive and instead seems to function as a diffusion barrier that prevents Cl– from reacting on the IrOx catalyst underneath, while still facilitating the transport of water, protons, and O2 between IrOx and the electrolyte, necessary for OER activity. The results of this work fit in an emerging trend of using diffusion barriers to affect selectivity. This may be a promising approach in practical brine electrolysis, in contrast to finding an OER catalyst that breaks the intrinsic scaling between selectivity and activity.
Acknowledgments
This research received funding from The Netherlands Organization for Scientific Research (NWO) in the framework of the fund New Chemical Innovations, project 731.015.204 ELECTROGAS, with financial support of Akzo Nobel Chemicals, Shell Global Solutions, Magneto Special Anodes (an Evoqua Brand), and Elson Technologies.
Supporting Information Available
The Supporting Information is available free of charge on the ACS Publications website at DOI: 10.1021/jacs.8b05382.
Detailed information regarding used chemicals and experimental procedures; supplementary electrochemical and structural data (PDF)
The authors declare no competing financial interest.
Supplementary Material
References
- Lewis N. S. Science 2007, 315, 798–801. 10.1126/science.1137014. [DOI] [PubMed] [Google Scholar]
- Bockris J.; Veziroğlu T. N. Int. J. Hydrogen Energy 1983, 8, 323–340. 10.1016/0360-3199(83)90048-4. [DOI] [Google Scholar]
- Bockris J. Science 1972, 176, 1323–1323. 10.1126/science.176.4041.1323. [DOI] [PubMed] [Google Scholar]
- Webber M. E. Environ. Res. Lett. 2007, 2, 034007. 10.1088/1748-9326/2/3/034007. [DOI] [Google Scholar]
- Suen N.-T.; Hung S.-F.; Quan Q.; Zhang N.; Xu Y.-J.; Chen H. M. Chem. Soc. Rev. 2017, 46, 337–365. 10.1039/C6CS00328A. [DOI] [PubMed] [Google Scholar]
- McCrory C. C. L.; Jung S.; Peters J. C.; Jaramillo T. F. J. Am. Chem. Soc. 2013, 135, 16977–16987. 10.1021/ja407115p. [DOI] [PubMed] [Google Scholar]
- Man I. C.; Su H. Y.; Calle-Vallejo F.; Hansen H. A.; Martínez J. I.; Inoglu N. G.; Kitchin J.; Jaramillo T. F.; Nørskov J. K.; Rossmeisl J. ChemCatChem 2011, 3, 1159–1165. 10.1002/cctc.201000397. [DOI] [Google Scholar]
- Dionigi F.; Reier T.; Pawolek Z.; Gliech M.; Strasser P. ChemSusChem 2016, 9, 962–972. 10.1002/cssc.201501581. [DOI] [PubMed] [Google Scholar]
- Fukuzumi S.; Lee Y.-M.; Nam W. ChemSusChem 2017, 10, 4264–4276. 10.1002/cssc.201701381. [DOI] [PubMed] [Google Scholar]
- World Chlorine Counsil. “Sustainable Progress”, downloaded from https://worldchlorine.org/wp-content/uploads/2017/10/WCC_Sustainable-Progress_Version-3-2017_web.pdf on 28–06–2018; 2017.
- Euro Chlor. Chlorine Industry Review 2016–2017, downloaded from http://fr.zone-secure.net/13451/398525 on 09–04–2018; 2017.
- Trasatti S. Electrochim. Acta 1987, 32, 369–382. 10.1016/0013-4686(87)85001-6. [DOI] [Google Scholar]
- Karlsson R. K. B.; Cornell A. Chem. Rev. 2016, 116, 2982–3028. 10.1021/acs.chemrev.5b00389. [DOI] [PubMed] [Google Scholar]
- Schmachtel S.; Toiminen M.; Kontturi K.; Forsén O.; Barker M. H. J. Appl. Electrochem. 2009, 39, 1835–1848. 10.1007/s10800-009-9887-1. [DOI] [Google Scholar]
- Oliveira F. H.; Osugi M. E.; Paschoal F. M. M.; Profeti D.; Olivi P.; Zanoni M. V. B. J. Appl. Electrochem. 2007, 37, 583–592. 10.1007/s10800-006-9289-6. [DOI] [Google Scholar]
- Hu J. M.; Zhang J. Q.; Cao C. N. Int. J. Hydrogen Energy 2004, 29, 791–797. 10.1016/j.ijhydene.2003.09.007. [DOI] [Google Scholar]
- Koper M. T. M. J. Electroanal. Chem. 2011, 660, 254–260. 10.1016/j.jelechem.2010.10.004. [DOI] [Google Scholar]
- Burke L. D.; O’Neill J. F. J. Electroanal. Chem. Interfacial Electrochem. 1979, 101, 341–349. 10.1016/S0022-0728(79)80045-5. [DOI] [Google Scholar]
- Consonni V.; Trasatti S.; Pollak F.; O’Grady W. E. J. Electroanal. Chem. Interfacial Electrochem. 1987, 228, 393–406. 10.1016/0022-0728(87)80119-5. [DOI] [Google Scholar]
- Trasatti S. Electrochim. Acta 1984, 29, 1503–1512. 10.1016/0013-4686(84)85004-5. [DOI] [Google Scholar]
- Hansen H. A.; Man I. C.; Studt F.; Abild-Pedersen F.; Bligaard T.; Rossmeisl J. Phys. Chem. Chem. Phys. 2010, 12, 283–290. 10.1039/B917459A. [DOI] [PubMed] [Google Scholar]
- Exner K. S.; Anton J.; Jacob T.; Over H. Electrochim. Acta 2014, 120, 460–466. 10.1016/j.electacta.2013.11.027. [DOI] [Google Scholar]
- Exner K. S.; Anton J.; Jacob T.; Over H. Angew. Chem., Int. Ed. 2016, 55, 7501–7504. 10.1002/anie.201511804. [DOI] [PubMed] [Google Scholar]
- Martelli G. N.; Ornelas R.; Faita G. Electrochim. Acta 1994, 39, 1551–1558. 10.1016/0013-4686(94)85134-4. [DOI] [Google Scholar]
- Cherevko S.; Zeradjanin A. R.; Topalov A. A.; Kulyk N.; Katsounaros I.; Mayrhofer K. J. J. ChemCatChem 2014, 6, 2219–2223. 10.1002/cctc.201402194. [DOI] [Google Scholar]
- Topalov A. A.; Katsounaros I.; Auinger M.; Cherevko S.; Meier J. C.; Klemm S. O.; Mayrhofer K. J. J. Angew. Chem., Int. Ed. 2012, 51, 12613–12615. 10.1002/anie.201207256. [DOI] [PMC free article] [PubMed] [Google Scholar]
- Danilovic N.; Subbaraman R.; Chang K.-C.; Chang S. H.; Kang Y. J.; Snyder J.; Paulikas A. P.; Strmcnik D.; Kim Y.-T.; Myers D.; Stamenkovic V. R.; Markovic N. M. J. Phys. Chem. Lett. 2014, 5, 2474–2478. 10.1021/jz501061n. [DOI] [PubMed] [Google Scholar]
- Reier T.; Pawolek Z.; Cherevko S.; Bruns M.; Jones T.; Teschner D.; Selve S.; Bergmann A.; Nong H. N.; Schlögl R.; Mayrhofer K. J. J.; Strasser P. J. Am. Chem. Soc. 2015, 137, 13031–13040. 10.1021/jacs.5b07788. [DOI] [PubMed] [Google Scholar]
- Frydendal R.; Paoli E. A.; Chorkendorff I.; Rossmeisl J.; Stephens I. E. L. Adv. Energy Mater. 2015, 5, 1500991. 10.1002/aenm.201500991. [DOI] [Google Scholar]
- Comninellis C.; Vercesi G. P. J. Appl. Electrochem. 1991, 21, 335–345. 10.1007/BF01020219. [DOI] [Google Scholar]
- Panić V. V.; Dekanski A. B.; Mišković-Stanković V. B.; Milonjić S. K.; Nikolić B. Ž. J. Electroanal. Chem. 2005, 579, 67–76. 10.1016/j.jelechem.2005.01.026. [DOI] [Google Scholar]
- Chen S.; Zheng Y.; Wang S.; Chen X. Chem. Eng. J. 2011, 172, 47–51. 10.1016/j.cej.2011.05.059. [DOI] [Google Scholar]
- Beer H. B. J. Electrochem. Soc. 1980, 127, C303–C307. 10.1149/1.2130021. [DOI] [Google Scholar]
- Trasatti S. Electrochim. Acta 2000, 45, 2377–2385. 10.1016/S0013-4686(00)00338-8. [DOI] [Google Scholar]
- Najafpour M. M.; Renger G.; Hołyńska M.; Moghaddam A. N.; Aro E.-M.; Carpentier R.; Nishihara H.; Eaton-Rye J. J.; Shen J.-R.; Allakhverdiev S. I. Chem. Rev. 2016, 116, 2886–2936. 10.1021/acs.chemrev.5b00340. [DOI] [PubMed] [Google Scholar]
- Hunter B. M.; Gray H. B.; Müller A. M. Chem. Rev. 2016, 116, 14120–14136. 10.1021/acs.chemrev.6b00398. [DOI] [PubMed] [Google Scholar]
- Takashima T.; Hashimoto K.; Nakamura R. J. Am. Chem. Soc. 2012, 134, 1519–1527. 10.1021/ja206511w. [DOI] [PubMed] [Google Scholar]
- Gorlin Y.; Jaramillo T. F. J. Am. Chem. Soc. 2010, 132, 13612–13614. 10.1021/ja104587v. [DOI] [PubMed] [Google Scholar]
- Bennett J. Int. J. Hydrogen Energy 1980, 5, 401–408. 10.1016/0360-3199(80)90021-X. [DOI] [Google Scholar]
- Fujimura K.; Izumiya K.; Kawashima A.; Akiyama E.; Habazaki H.; Kumagai N.; Hashimoto K. J. Appl. Electrochem. 1999, 29, 765–771. 10.1023/A:1003492009263. [DOI] [Google Scholar]
- Habazaki H.; Matsui T.; Kawashima A.; Asami K.; Kumagai N.; Hashimoto K. Scr. Mater. 2001, 44, 1659–1662. 10.1016/S1359-6462(01)00876-4. [DOI] [Google Scholar]
- Abdel Ghany N. A.; Kumagai N.; Meguro S.; Asami K.; Hashimoto K. Electrochim. Acta 2002, 48, 21–28. 10.1016/S0013-4686(02)00539-X. [DOI] [Google Scholar]
- Kato Z.; Bhattarai J.; Kumagai N.; Izumiya K.; Hashimoto K. Appl. Surf. Sci. 2011, 257, 8230–8236. 10.1016/j.apsusc.2010.12.042. [DOI] [Google Scholar]
- Huynh M.; Bediako D. K.; Nocera D. G. J. Am. Chem. Soc. 2014, 136, 6002–6010. 10.1021/ja413147e. [DOI] [PubMed] [Google Scholar]
- Takeno N. Natl. Inst. Adv. Ind. Sci. Technol. Tokyo 2005, (419), 1–285. [Google Scholar]
- Fan K.; Chen H.; Ji Y.; Huang H.; Claesson P. M.; Daniel Q.; Philippe B.; Rensmo H.; Li F.; Luo Y.; Sun L. Nat. Commun. 2016, 7, 11981. 10.1038/ncomms11981. [DOI] [PMC free article] [PubMed] [Google Scholar]
- Trześniewski B. J.; Diaz-Morales O.; Vermaas D. A.; Longo A.; Bras W.; Koper M. T. M.; Smith W. A. J. Am. Chem. Soc. 2015, 137, 15112–15121. 10.1021/jacs.5b06814. [DOI] [PubMed] [Google Scholar]
- Yang X.; Wang C.-J.; Hou C.-C.; Fu W.-F.; Chen Y. ACS Sustainable Chem. Eng. 2018, 6, 2893–2897. 10.1021/acssuschemeng.7b04199. [DOI] [Google Scholar]
- Burke M. S.; Kast M. G.; Trotochaud L.; Smith A. M.; Boettcher S. W. J. Am. Chem. Soc. 2015, 137, 3638–3648. 10.1021/jacs.5b00281. [DOI] [PubMed] [Google Scholar]
- Pokhrel R.; Goetz M. K.; Shaner S. E.; Wu X.; Stahl S. S. J. Am. Chem. Soc. 2015, 137, 8384–8387. 10.1021/jacs.5b05093. [DOI] [PubMed] [Google Scholar]
- Vos J. G.; Koper M. T. M. J. Electroanal. Chem. 2018, 819, 260–268. 10.1016/j.jelechem.2017.10.058. [DOI] [Google Scholar]
- Najafpour M. M.; Khoshkam M.; Jafarian Sedigh D.; Zahraei A.; Kompany-Zareh M. New J. Chem. 2015, 39, 2547–2550. 10.1039/C4NJ02092H. [DOI] [Google Scholar]
- Nijjer S.; Thonstad J.; Haarberg G. M. Electrochim. Acta 2000, 46, 395–399. 10.1016/S0013-4686(00)00597-1. [DOI] [Google Scholar]
- Filipe O.; Brett C. M. A. Talanta 2003, 61, 643–650. 10.1016/S0039-9140(03)00327-8. [DOI] [PubMed] [Google Scholar]
- Paul R. L.; Cartwright A. J. Electroanal. Chem. Interfacial Electrochem. 1986, 201, 123–131. 10.1016/0022-0728(86)90092-6. [DOI] [Google Scholar]
- Rogulski Z.; Siwek H.; Paleska I.; Czerwiński A. J. Electroanal. Chem. 2003, 543, 175–185. 10.1016/S0022-0728(03)00045-7. [DOI] [Google Scholar]
- Guerrini E.; Consonni V.; Trasatti S. J. Solid State Electrochem. 2005, 9, 320–329. 10.1007/s10008-004-0602-1. [DOI] [Google Scholar]
- Scharifker B.; Hills G. Electrochim. Acta 1983, 28, 879–889. 10.1016/0013-4686(83)85163-9. [DOI] [Google Scholar]
- Mostany J.; Scharifker B. In Encyclopedia of Electrochemistry; Bard A. J.; Stratmann M.; Calvo E. J., Eds.; Wiley-VCH Verlag GmbH & Co. KGaA: Weinheim, Germany, 2007; Vol. 2, pp 512–540. [Google Scholar]
- Huynh M.; Bediako D. K.; Liu Y.; Nocera D. G. J. Phys. Chem. C 2014, 118, 17142–17152. 10.1021/jp501768n. [DOI] [Google Scholar]
- Sohrabnejad-Eskan I.; Goryachev A.; Exner K. S.; Kibler L. A.; Hensen E. J. M.; Hofmann J. P.; Over H. ACS Catal. 2017, 7, 2403–2411. 10.1021/acscatal.6b03415. [DOI] [Google Scholar]
- Huynh M.; Shi C.; Billinge S. J. L.; Nocera D. G. J. Am. Chem. Soc. 2015, 137, 14887–14904. 10.1021/jacs.5b06382. [DOI] [PubMed] [Google Scholar]
- Gorlin Y.; Chung C.-J.; Benck J. D.; Nordlund D.; Seitz L. C.; Weng T.-C.; Sokaras D.; Clemens B. M.; Jaramillo T. F. J. Am. Chem. Soc. 2014, 136, 4920–4926. 10.1021/ja407581w. [DOI] [PMC free article] [PubMed] [Google Scholar]
- Seitz L. C.; Hersbach T. J. P.; Nordlund D.; Jaramillo T. F. J. Phys. Chem. Lett. 2015, 6, 4178–4183. 10.1021/acs.jpclett.5b01928. [DOI] [PubMed] [Google Scholar]
- Ramírez A.; Hillebrand P.; Stellmach D.; May M. M.; Bogdanoff P.; Fiechter S. J. Phys. Chem. C 2014, 118, 14073–14081. 10.1021/jp500939d. [DOI] [Google Scholar]
- Zhao Y.; Hernandez-Pagan E. A.; Vargas-Barbosa N. M.; Dysart J. L.; Mallouk T. E. J. Phys. Chem. Lett. 2011, 2, 402–406. 10.1021/jz200051c. [DOI] [Google Scholar]
- Zhao Y.; Vargas-Barbosa N. M.; Hernandez-Pagan E. A.; Mallouk T. E. Small 2011, 7, 2087–2093. 10.1002/smll.201100485. [DOI] [PubMed] [Google Scholar]
- Nakagawa T.; Beasley C. A.; Murray R. W. J. Phys. Chem. C 2009, 113, 12958–12961. 10.1021/jp9060076. [DOI] [Google Scholar]
- Yagi M.; Tomita E.; Kuwabara T. J. Electroanal. Chem. 2005, 579, 83–88. 10.1016/j.jelechem.2005.01.030. [DOI] [Google Scholar]
- Cheney M. A.; Bhowmik P. K.; Moriuchi S.; Villalobos M.; Qian S.; Joo S. W. J. Nanomater. 2008, 2008, 1–9. 10.1155/2008/168716. [DOI] [Google Scholar]
- Nakayama M.; Kanaya T.; Lee J.-W.; Popov B. N. J. Power Sources 2008, 179, 361–366. 10.1016/j.jpowsour.2007.12.075. [DOI] [Google Scholar]
- Post J. E. Proc. Natl. Acad. Sci. U. S. A. 1999, 96, 3447–3454. 10.1073/pnas.96.7.3447. [DOI] [PMC free article] [PubMed] [Google Scholar]
- Zaharieva I.; Chernev P.; Risch M.; Klingan K.; Kohlhoff M.; Fischer A.; Dau H. Energy Environ. Sci. 2012, 5, 7081–7089. 10.1039/c2ee21191b. [DOI] [Google Scholar]
- Gorlin Y.; Lassalle-Kaiser B.; Benck J. D.; Gul S.; Webb S. M.; Yachandra V. K.; Yano J.; Jaramillo T. F. J. Am. Chem. Soc. 2013, 135, 8525–8534. 10.1021/ja3104632. [DOI] [PMC free article] [PubMed] [Google Scholar]
- Huynh M.; Bediako D. K.; Liu Y.; Nocera D. G. J. Phys. Chem. C 2014, 118, 17142–17152. 10.1021/jp501768n. [DOI] [Google Scholar]
- Michell D.; Rand D. A. J.; Woods R. J. Electroanal. Chem. Interfacial Electrochem. 1977, 84, 117–126. 10.1016/S0022-0728(77)80234-9. [DOI] [Google Scholar]
- Ortel E.; Reier T.; Strasser P.; Kraehnert R. Chem. Mater. 2011, 23, 3201–3209. 10.1021/cm200761f. [DOI] [Google Scholar]
- Abbott D. F.; Lebedev D.; Waltar K.; Povia M.; Nachtegaal M.; Fabbri E.; Copéret C.; Schmidt T. J. Chem. Mater. 2016, 28, 6591–6604. 10.1021/acs.chemmater.6b02625. [DOI] [Google Scholar]
- Massué C.; Pfeifer V.; van Gastel M.; Noack J.; Algara-Siller G.; Cap S.; Schlögl R. ChemSusChem 2017, 10, 4786–4798. 10.1002/cssc.201701291. [DOI] [PMC free article] [PubMed] [Google Scholar]
- Kötz R.; Neff H.; Stucki S. J. Electrochem. Soc. 1984, 131, 72. 10.1149/1.2115548. [DOI] [Google Scholar]
- Pfeifer V.; Jones T. E.; Velasco Vélez J. J.; Massué C.; Greiner M. T.; Arrigo R.; Teschner D.; Girgsdies F.; Scherzer M.; Allan J.; Hashagen M.; Weinberg G.; Piccinin S.; Hävecker M.; Knop-Gericke A.; Schlögl R. Phys. Chem. Chem. Phys. 2016, 18, 2292–2296. 10.1039/C5CP06997A. [DOI] [PubMed] [Google Scholar]
- Junta J. L.; Hochella M. F. Geochim. Cosmochim. Acta 1994, 58, 4985–4999. 10.1016/0016-7037(94)90226-7. [DOI] [Google Scholar]
- Cerrato J. M.; Hochella M. F.; Knocke W. R.; Dietrich A. M.; Cromer T. F. Environ. Sci. Technol. 2010, 44, 5881–5886. 10.1021/es100547q. [DOI] [PubMed] [Google Scholar]
- Smith R. D. L.; Sporinova B.; Fagan R. D.; Trudel S.; Berlinguette C. P. Chem. Mater. 2014, 26, 1654–1659. 10.1021/cm4041715. [DOI] [Google Scholar]
- Fierro S.; Nagel T.; Baltruschat H.; Comninellis C. Electrochem. Commun. 2007, 9, 1969–1974. 10.1016/j.elecom.2007.05.008. [DOI] [Google Scholar]
- Grimaud A.; Diaz-Morales O.; Han B.; Hong W. T.; Lee Y.; Giordano L.; Stoerzinger K. A.; Koper M. T. M.; Shao-Horn Y. Nat. Chem. 2017, 9, 457–465. 10.1038/nchem.2695. [DOI] [PubMed] [Google Scholar]
- Stoerzinger K. A.; Diaz-Morales O.; Kolb M.; Rao R. R.; Frydendal R.; Qiao L.; Wang X. R.; Halck N. B.; Rossmeisl J.; Hansen H. A.; Vegge T.; Stephens I. E. L.; Koper M. T. M.; Shao-Horn Y. ACS Energy Lett. 2017, 2, 876–881. 10.1021/acsenergylett.7b00135. [DOI] [Google Scholar]
- Morita M.; Iwakura C.; Tamura H. Electrochim. Acta 1979, 24, 357–362. 10.1016/0013-4686(79)87019-X. [DOI] [Google Scholar]
- Morita M.; Iwakura C.; Tamura H. Electrochim. Acta 1977, 22, 325–328. 10.1016/0013-4686(77)85081-0. [DOI] [Google Scholar]
- Nakayama M.; Fukuda M.; Konishi S.; Tonosaki T. J. Mater. Res. 2006, 21, 3152–3160. 10.1557/jmr.2006.0385. [DOI] [Google Scholar]
- Rodrigues S.; Shukla a K.; Munichandraiah N. J. Appl. Electrochem. 1998, 28, 1235–1241. 10.1023/A:1003472901760. [DOI] [Google Scholar]
- Biswal A.; Chandra Tripathy B.; Sanjay K.; Subbaiah T.; Minakshi M. RSC Adv. 2015, 5, 58255–58283. 10.1039/C5RA05892A. [DOI] [Google Scholar]
- Mozota J.; Conway B. E. J. Electrochem. Soc. 1981, 128, 2142–2149. 10.1149/1.2127205. [DOI] [Google Scholar]
- Garcia-Esparza A. T.; Shinagawa T.; Ould-Chikh S.; Qureshi M.; Peng X.; Wei N.; Anjum D. H.; Clo A.; Weng T.-C.; Nordlund D.; Sokaras D.; Kubota J.; Domen K.; Takanabe K. Angew. Chem., Int. Ed. 2017, 56, 5780–5784. 10.1002/anie.201701861. [DOI] [PubMed] [Google Scholar]
- Labrador N. Y.; Songcuan E. L.; De Silva C.; Chen H.; Kurdziel S. J.; Ramachandran R. K.; Detavernier C.; Esposito D. V. ACS Catal. 2018, 8, 1767–1778. 10.1021/acscatal.7b02668. [DOI] [Google Scholar]
- Esposito D. V. ACS Catal. 2018, 8, 457–465. 10.1021/acscatal.7b03374. [DOI] [Google Scholar]
- Damjanovic A.; Dey A.; Bockris J. Electrochim. Acta 1966, 11, 791–814. 10.1016/0013-4686(66)87056-1. [DOI] [Google Scholar]
- Balaji R.; Kannan B. S.; Lakshmi J.; Senthil N.; Vasudevan S.; Sozhan G.; Shukla A. K.; Ravichandran S. Electrochem. Commun. 2009, 11, 1700–1702. 10.1016/j.elecom.2009.06.022. [DOI] [Google Scholar]
- Lindbergh G.; Simonsson D. J. Electrochem. Soc. 1990, 137, 3094. 10.1149/1.2086165. [DOI] [Google Scholar]
- Endrődi B.; Simic N.; Wildlock M.; Cornell A. Electrochim. Acta 2017, 234, 108–122. 10.1016/j.electacta.2017.02.150. [DOI] [Google Scholar]
- Endrődi B.; Sandin S.; Smulders V.; Simic N.; Wildlock M.; Mul G.; Mei B. T.; Cornell A. J. Cleaner Prod. 2018, 182, 529–537. 10.1016/j.jclepro.2018.02.071. [DOI] [Google Scholar]
Associated Data
This section collects any data citations, data availability statements, or supplementary materials included in this article.