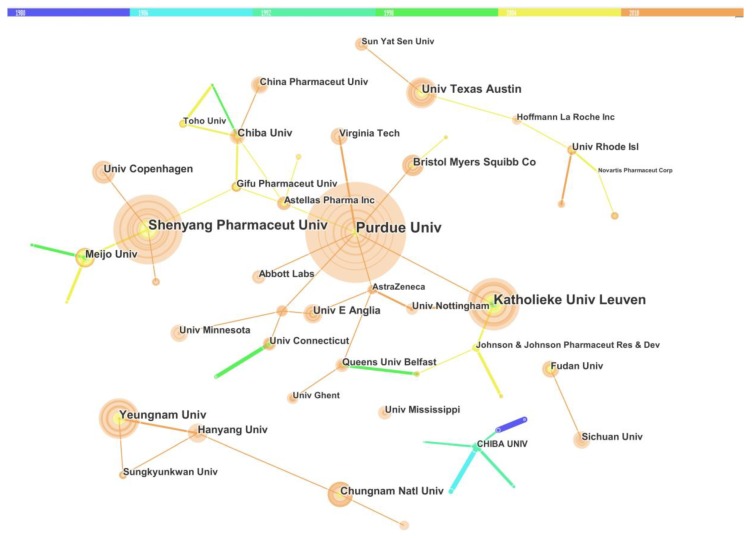
Figure 6.
Mapping of Institution cooperation network. Different colors represent different time slices, deep blue: 1980 to1985, sky blue: 1986 to 1991, pink green: 1992 to 1997, green: 1998 to 2003, yellow: 2004 to 2009 and orange: 2010 to 2015 from 1980 to 2015. The diameter of each circle represents the publication number of the institution. The thickness of the connect line represents the intensity of institution cooperation.

