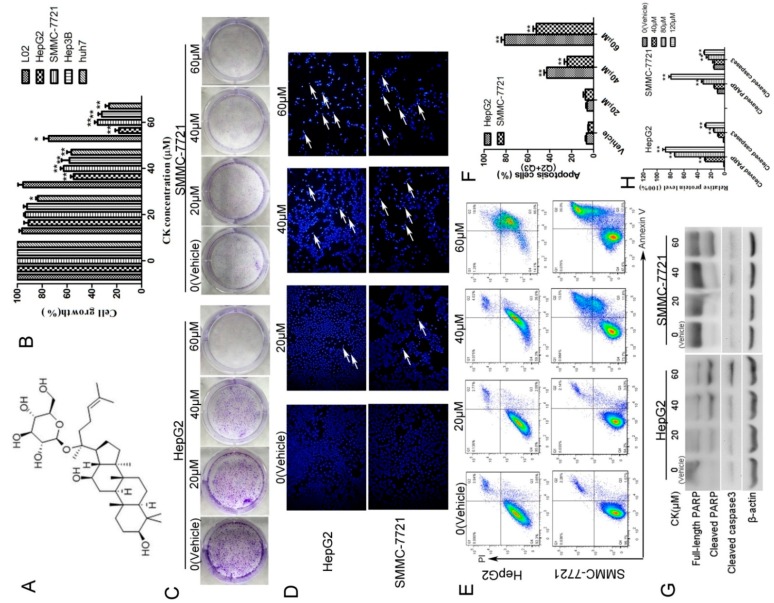
Figure 1.
CK inhibited the growth of HepG2 and SMMC-7721 cells by inducing apoptosis. (A) Chemical structure of CK. (B) HepG2, SMMC-7721, Hep3B, Huh7 and L02 cells were treated with 0, 20, 40, and 60 μM CK for 48 h, and cell viability was measured by the MTT assay; Statistics were done by one-way ANOVA and Dunnett text. * p < 0.05, ** p < 0.01 vs. Vehicle. (C) HepG2 and SMMC-7721 cells were treated with 0, 20, 40, and 60 μM CK for 48 h, and then the cells were cultured in fresh medium for another 7 d. Colonies were stained with crystal violet and imaged. (D) HepG2 and SMMC-7721 cells were stained with Hoechst and observed by fluorescence microscopy (200× magnification). (E) Apoptotic cells were assessed by flow cytometry following Annexin V/PI staining. (F) Quantitative analysis of the data from (E) to give the percent of apoptosis cells by flow cytometry. Results are shown as mean ± SD; Statistics were done by one-way ANOVA and Dunnett text. * p < 0.05, ** p < 0.01 vs. Vehicle. (G) HepG2 and SMMC-7721 cells were treated with CK (0, 20, 40, and 60 μΜ) for 48 h, and cleaved caspase 3 and PARP were detected by western blotting. (H) Quantification of the data in (G). Cleaved caspase 3 and cleaved PARP levels were determined relative to β-actin. Data are presented as mean ± SD; Statistics were done by one-way ANOVA and Dunnett text. * p < 0.05, ** p < 0.01 vs. Vehicle.

