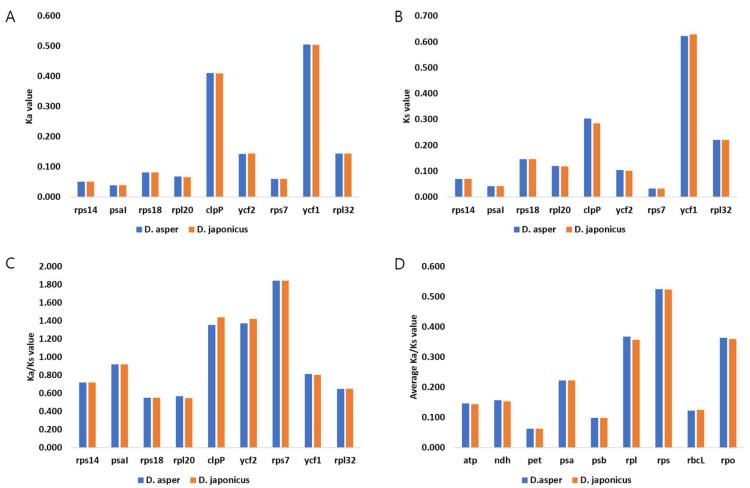
Figure 3.
The analysis of Ka, Ks, and Ka/Ks values of the chloroplast genomes of D. asper, D. japonicus, and L. japonica. The ratio of non-synonymous substitution rate (Ka) to synonymous substitution rate (Ks) was calculated for 78 conserved protein-coding genes. (A) Ka values of genes with Ka/Ks > 0.5. (B) Ks value of genes with Ka/Ks > 0.5. (C) Ka/Ks values of specific genes. (D) Average Ka/Ks values of gene groups.

