MEDICAL SCIENCES Correction for “Atrial natriuretic peptide prevents cancer metastasis through vascular endothelial cells,” by Takashi Nojiri, Hiroshi Hosoda, Takeshi Tokudome, Koichi Miura, Shin Ishikane, Kentaro Otani, Ichiro Kishimoto, Yasushi Shintani, Masayoshi Inoue, Toru Kimura, Noriyoshi Sawabata, Masato Minami, Tomoyuki Nakagiri, Soichiro Funaki, Yukiyasu Takeuchi, Hajime Maeda, Hiroyasu Kidoya, Hiroshi Kiyonari, Go Shioi, Yuji Arai, Takeshi Hasegawa, Nobuyuki Takakura, Megumi Hori, Yuko Ohno, Mikiya Miyazato, Naoki Mochizuki, Meinoshin Okumura, and Kenji Kangawa, which was first published March 16, 2015; 10.1073/pnas.1417273112 (Proc Natl Acad Sci USA 112:4086–4091).
The authors wish to note the following: “During the process of data checking, we detected mistakes in the expression of sample numbers, error bar expressions, and figure preparation. Three members of our team were involved in these errors and despite checking the data ahead of publication, we did not notice the calculation and expression errors in the figure preparation. The senior author apologizes for the inconvenience for these honest errors, which, importantly, do not affect the clinical outcomes or main results of the study.
“The error bars in Figs. 2F, 3B, and 4E, and Fig. S5B were presented incorrectly. The legends for Figs. 2 and 3 and Fig. S5 noted incorrect sample sizes. There was an error in the preparation of Table S1.
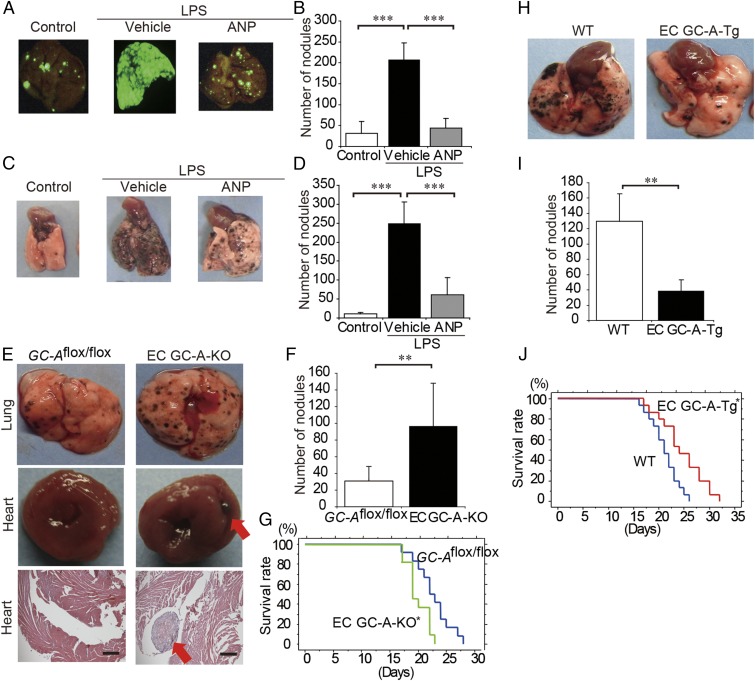
Fig. 2.
ANP inhibits the LPS-augmented metastasis of A549-EGFP lung cancer cells and B16/F10 mice melanoma cells to the lung. (A) Representative EGFP images of the lungs of mice that were pretreated with or without LPS and then injected with A549-EGFP cells (1 × 10⁶ cells per mouse) and continuously treated with or without ANP for 4 wk. The mice were killed 6 wk after the injection of tumor cells. (B) Bar graph showing the number of nodules representing pulmonary metastasis of A549-EGFP cells in mice grouped as in A. Data are means ± SD (n = 6, each group). ***P < 0.001, unpaired two-tailed t test. (C) Representative images of the lungs of mice that were pretreated with or without LPS and then injected with B16/F10 cells (2 × 10⁵ cells per mouse) and continuously treated with or without ANP for 2 wk. The mice were killed 2 wk after the injection of the tumor cells. (D) Bar graph showing the number of nodules representing pulmonary metastasis of B16/F10 cells in mice grouped as in C. Data are means ± SD (n = 6, each group). ***P < 0.001, unpaired two-tailed t test. (E) Representative images of the lungs and hearts (Top and Middle, respectively) and histological cross-sections of the hearts (H&E staining, Bottom) of the GC-Aflox/flox mice and EC GC-A-KO mice after injection of B16/F10 cells (2 × 10⁵ cells per mouse). The mice were killed 2 wk after the injection of the tumor cells. (Scale bars, 500 μm.) Red arrows indicate metastasis in the heart. (F) Bar graph showing the number of nodules representing pulmonary metastasis of B16/F10 cells in mice grouped as in E. Data are means ± SD (n = 9, 7, each group). **P < 0.01, unpaired two-tailed t test. (G) Kaplan–Meier curves comparing survival times between GC-Aflox/flox and EC GC-A-KO mice after injection of B16/F10 cells (2 × 10⁵ cells per mouse). n = 12, 11 (each group), *P < 0.05, log-rank test. (H) Representative images of the lungs of WT and EC GC-A-Tg mice after injection of B16/F10 cells (5 × 10⁵ cells per mouse). The mice were killed 2 wk after the injection of tumor cells. (I) Bar graph showing the number of nodules representing pulmonary metastasis of B16/F10 cells in mice grouped as in H. Data are means ± SD (n = 10, 8, each group). **P < 0.01, unpaired two-tailed t test. (J) Kaplan–Meier curves comparing survival times between WT and EC GC-A-Tg mice after injection of B16/F10 (5 × 10⁵ cells per mouse). n = 15 (each group), *P < 0.05, log-rank test. Whole images of lungs were shown in SI Appendix, Fig. S1.
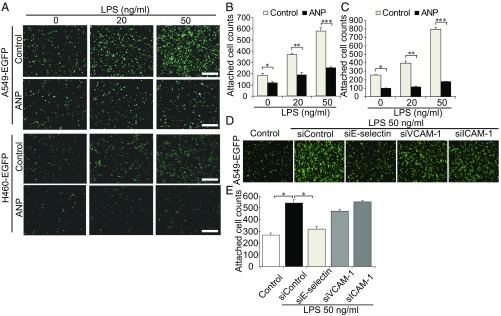
Fig. 3.
ANP inhibits LPS-regulated E-selectin–dependent adhesion of cancer cells to vascular endothelial cells. (A) Representative images of the adhesion of tumor cells (A549-EGFP, Upper; H460-EGFP, Lower) to monolayer-cultured HPAECs pretreated with or without ANP. (B and C) Bar graphs showing the number of A549-EGFP cells (B) or H460-EGFP cells (C) attached to monolayer-cultured HPAECs pretreated with or without ANP. Data are means ± SEM (n = 3, each group). *P < 0.05, **P < 0.01, ***P < 0.001, unpaired two-tailed t test. (D) Representative images of A549-EGFP cells attached to HPAECs depleted of the indicated molecules by siRNA treatment and treated with LPS. (E) Bar graph showing the number of A549-EGFP cells attached to HPAECs treated as in (D). Data are means ± SEM (n = 4–5, each group). *P < 0.05, one-way ANOVA. (Scale bars, 500 μm.)
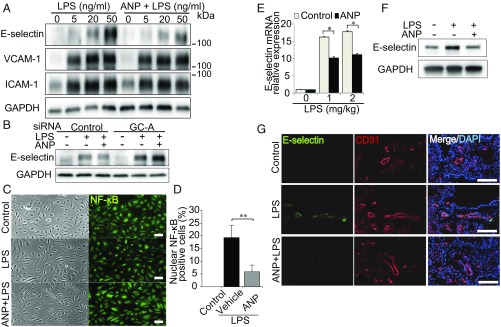
Fig. 4.
ANP–GC-A signaling attenuates LPS-induced E-selectin expression. (A) Immunoblot analysis of the lysates of HPAECs pretreated with or without ANP followed by LPS stimulation; antibodies used are indicated on the left. Each blot is representative of six independent experiments. (B) E-selectin expression assessed by immunoblot analysis of the lysates of HPAECs transfected with the indicated siRNAs and stimulated with LPS. The result shown is representative of six independent experiments. (C) Bright field images (Left) and NF-κB immunofluorescence images (Right) of HPAECs that were unstimulated (control, Top), stimulated with LPS alone (Middle), or pretreated with ANP followed by LPS stimulation (Bottom). Each image is representative of five independent experiments. (Scale bars, 100 μm.) (D) Quantitative analyses of C. Each column shows the percentage of HPAECs with nuclear NF-κB expression in the indicated group. Data are means ± SEM (n = 5, each group); **P < 0.01, unpaired two-tailed t test. (E) Quantitative reverse transcriptase PCR analysis of E-selectin mRNA levels in the lungs of mice pretreated with ANP or vehicle (control) and treated with LPS. Data are normalized relative to 36B4 mRNA levels. Data are means ± SEM (n = 6, each group); *P < 0.05, unpaired two-tailed t test. (F) Immunoblot analysis of E-selectin levels in lung lysates of mice pretreated with or without ANP followed by LPS stimulation (1.0 mg/kg) for 5 h. Each blot is representative of six independent experiments. (G) E-selectin images (Left), CD31 images (Center), and merged images with DAPI staining (Right) of the lungs of mice pretreated with or without ANP followed by LPS stimulation (1.0 mg/kg) for 5 h. Each image is representative of six independent experiments. Nuclei are stained with DAPI (blue). (Scale bars, 100 μm.)
“For Fig. 3, we showed representative images in Fig. 3 A and D and apologize for use of the same image in the two panels and for the confusion it might have caused. We have updated the figure to include an image taken from the same experiment.
“We showed the representative organ in Fig. 2 A and C, and showed all image data in Fig. S1 A and C. Considering that the data show the number of metastases, the size ratio change is acceptable because the number of metastases has not changed. We apologize for not making this clear in our figure legend.
“Due to an error in data compilation, Fig. S8 data are different and the statistical outcome is correspondingly changed and amended in the main text (italics), on page 4090, right column, first paragraph, lines 13–16:
‘To ascertain the efficiency of ANP administration, we measured the blood levels of cGMP. However, the data did not reach statistical significance when ANP (0.5 μg·kg·min) was infused subcutaneously in the mice (SI Appendix, Fig. S8), although the blood cGMP levels showed a tendency of increase after ANP administration.’”
The editor has read and approved these changes. The corrected Figs. 2–4 appear below with their respective corrected legends. The online version of the article has been corrected. The SI Appendix has also been corrected online, with corrections made to Fig. S5 and its legend, Fig. S8 and its legend, and Table S1.


