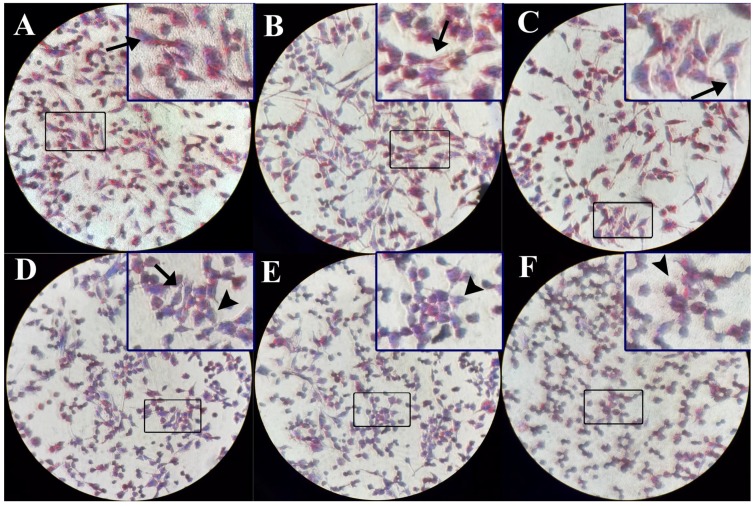
Figure 2.
Intracellular triglyceride (TG) stained by oil-red o (ORO) after treatment with different concentrations of DBTD. The ORO kits stain the lipid red and nucleus blue, respectively, to facilitate our observation of lipid droplets. (A) 0 μmol/L, (B) 0.13 μmol/L, and (C) 0.25 μmol/L DBTD-treated cells have large red stained sections and have normal morphology stretching in fibrous shapes (arrow). (D) 0.50 μmol/L, (E) 1.00 μmol/L, and (F) 2.00 μmol/L DBTD-treated cells have diminished red areas and turn to a global appearance, which indicates low viability (arrow head). Original magnification ×100.

