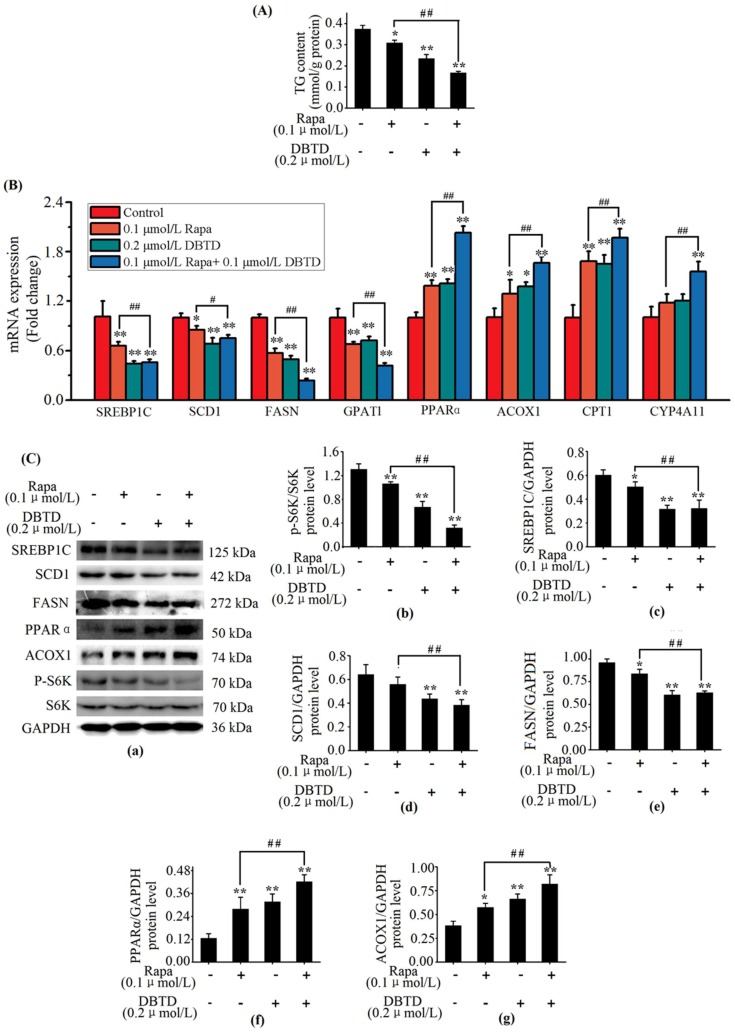
Figure 6.
Effects of DBTD on the mTOR pathway and triglyceride (TG) metabolism. Cells were treated with 0.1 μmol/L rapamycin (Rapa) for 6 h, 0.2 μmol/L DBTD for 24 h, and pretreated with 0.1 μmol/L Rapa for 6 h followed by a 24 h treatment of 0.2 μmol/L DBTD, respectively. The control group (Con) was incubated with culture media only. (A) measurement of intracellular TG content. (B) Expressions analysis of SREBP1C, SCD1, FASN, GPAT1, PPARα, ACOX1, CPT1, and CYP4A11 by RT-PCR. (C) Protein analysis by immunoblot, (a) representative bands of relevant proteins. Protein levels of (b) p-S6K1 (Thr421), (c) SREBP1C, (d) SCD1, (e) FASN, (f) PPARα, and (g) ACOX1. Quantities are expressed as relative intensities against GAPDH except for p-S6K1 (Thr421), which was against S6K1. Data are presented as the mean ± SD of three experiments. * p < 0.05 and ** p < 0.01 versus control. # p < 0.05 and ## p < 0.01 versus Rapa group.

