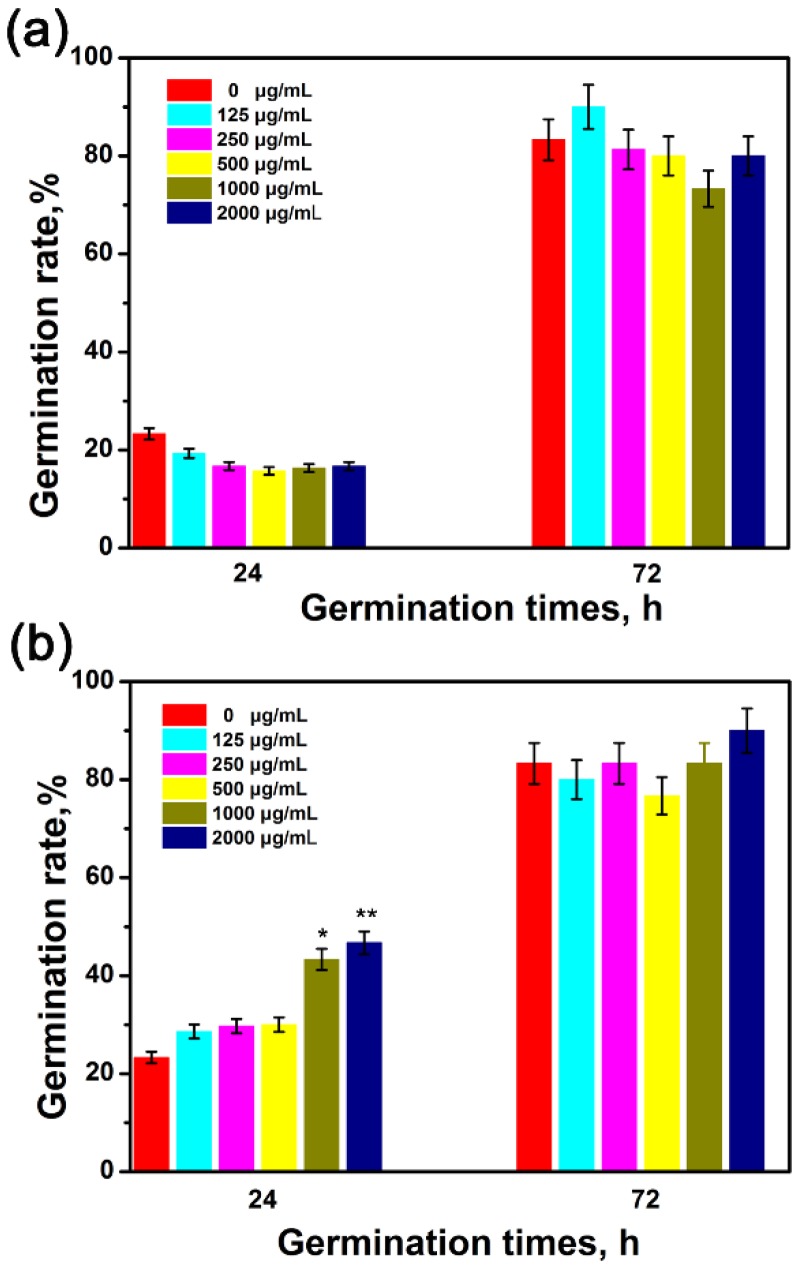
Figure 3.
Germination rate of seeds after incubation with different concentrations (0, 125, 250, 500, 1000, 2000 μg/mL) of GO (a) and G-NH2 (b). Results are shown as mean ± SD of measurements of 10 plants per each condition. Where appropriate, statistical significance is indicated by * p < 0.05 and ** p < 0.01 versus the control.

