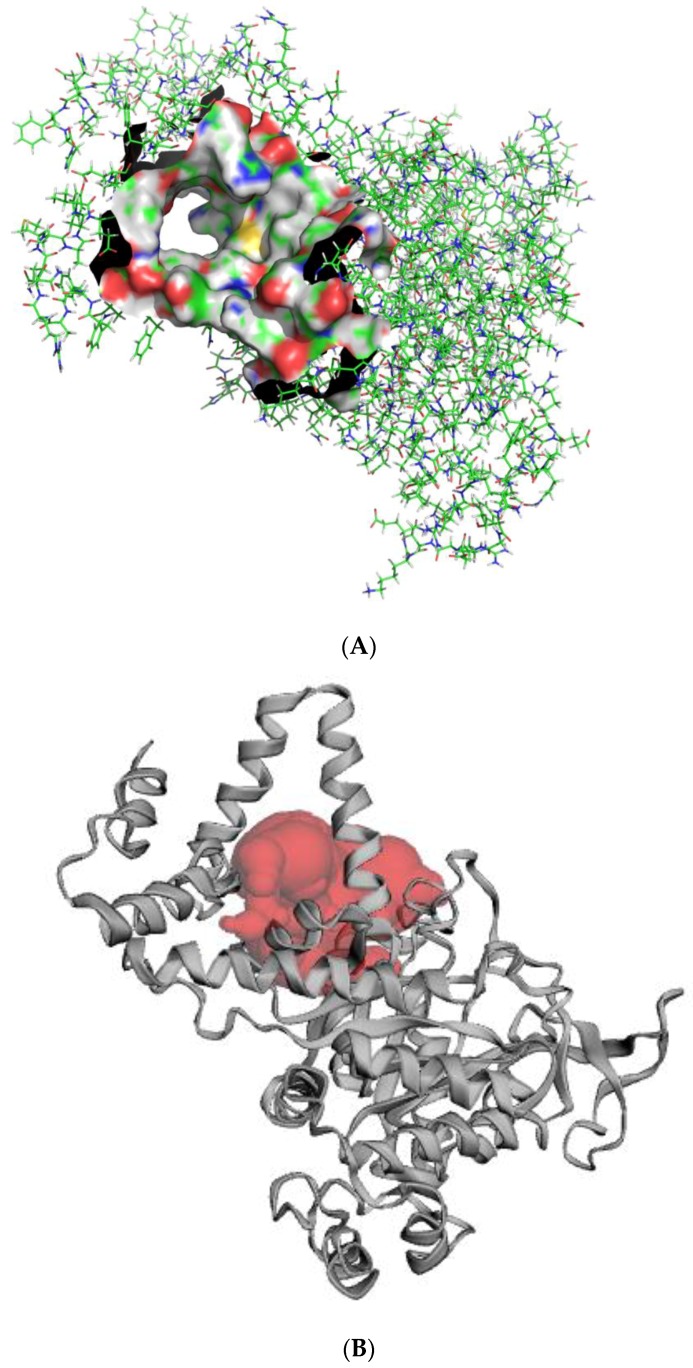
Figure 5.
Representation of the predicted active site of the protein model. (A) The entire protein model is represented in lines with the surface representation constituting the active site. (B) Cartoon representation of the protein model and the active site. The red shows the substrate binding region.

