Abstract
Silkworm excrement (SE), is used as a traditional antirheumatic medicine in China. The present study was designed to investigate the therapeutic efficacy of water fraction of SE (ST) and ethanol fraction of SE (CT) at two different doses on adjuvant induced arthritis (AA) rats. Arthritis severity was evaluated by body weight, paw thickness, histological changes and index of paws oedema and spleen. Serum samples were collected for estimation of biochemical indicators and cytokines. In addition, a metabonomic method based on the ultra-performance liquid chromatography coupled with quadrupole time-of-flight mass spectrometry (UPLC-Q-TOF-MS) had been established to investigate the holistic efficacy of SE by serum and urine. Multivariate statistical approaches, such as partial least-squares discriminant analysis (PLS-DA) and orthogonal projection to latent structures squares-discriminant analysis (OPLS-DA) were built to evaluate the therapeutic effects of SE and find potential biomarkers and metabolic pathways. Administration with SE significantly ameliorated the AA severity, including body weight loss, paw swelling, histological changes and the levels of biochemical index. 33 endogenous metabolites had been identified (10 in serum and 23 in urine) in the AA rats. Urinary and serum metabolic profiling revealed that the metabolites underpin the metabolic pathway including nicotinate and nicotinamide metabolism; pentose and glucuronate interconversions; TCA cycle; beta-Alanine metabolism; purine metabolism and glycolysis or gluconeogenesis. The altered metabolites could be regulated closer to normal level after SE intervention. The results suggested SE possesses substantial anti-arthritic activity and demonstrated that metabonomics is a powerful tool to gain insight in the mechanism of SE formula in therapy.
Keywords: silkworm excrement, rheumatoid arthritis, biomarker, metabolomics
1. Introduction
Rheumatoid arthritis (RA) is a chronic systemic inflammatory autoimmune disease that affects different parts of the body, inevitably causing pain, swelling and loss of function in joints [1]. RA significantly impacts quality of life, leading to severe disability in the patient. Current conventional therapies for RA patients, including disease-modifying antirheumatic drugs (DMARDs) and biologics, are not satisfactory. To the best of our knowledge, there is no unified theory about the pathogenesis of RA. Therefore, it is necessary to find an early diagnostic marker with high sensitivity and specificity.
Metabolomics is one of the newest methods focused on the association between disease and metabolic profile. Several analytical techniques have been widely used to determine the metabolites, including mass spectroscopy, 1H-NMR spectroscopy and liquid chromatography-mass spectroscopy [2]. Notably, emerging evidence indicates that RA susceptibility may be involved in the perturbation of metabolism [3,4]. The metabolomics approach can provide insight into the entire metabolism process and identify disparities in the metabolites and related metabolic pathways [5]. Recent evidence has also demonstrated that metabolomics approach is an effective tool in characterizing the metabolic changes of RA [6,7].
Traditional Chinese Medicines (TCMs) have been used in China for centuries and have shown efficacy in RA treatment [8]. Silkworm excrement, a classical traditional Chinese medicine, is commonly used in Chinese medicine as an anti-rheumatic drug. It was described to have the ability of “expelling wind and eliminating dampness” by Li Shizhen (during the Chinese Tang Dynasty) in his treatise “Compendium of Materia Medica” [9]. The previous study also exhibited that silkworm excrement has significant anti-inflammatory effect and analgesic effect [10]. In this study, we designed to investigate the therapeutic effect on adjuvant induced arthritis (AA) in rats and explain the metabolic mechanism of the anti-arthritic of SE by setting up an integrated platform of LC–Q-TOF-MS.
2. Results
2.1. Basic Physical Parameters Test
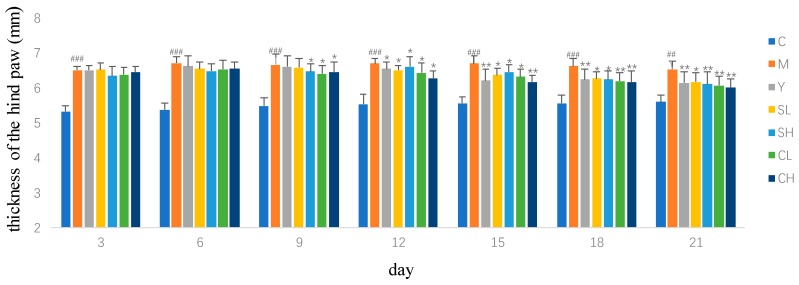
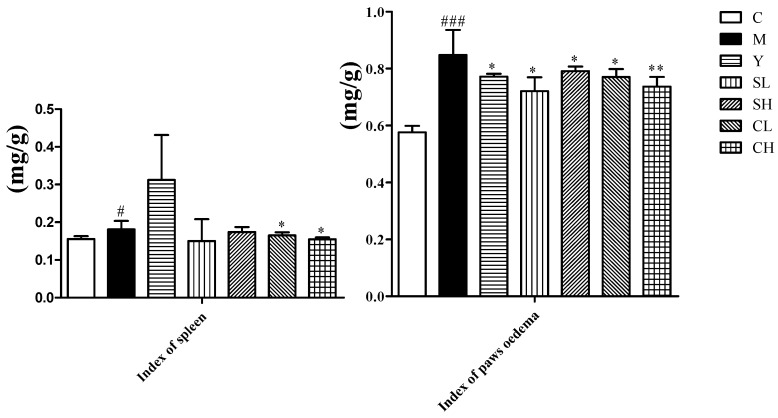
During the experiment, body weights of control group significantly increased, while the model group increased slightly. Treatment with ST and CT could restore the body weights compared with the AA models, especially the CT groups (Table 1). In the model group, the paw swelling degrees were remarkable more serious compared with the control group. The paw swelling degrees of rats in the groups treated with ST and CT were significantly decreased compared with the AA models (Figure 1). On Day 12, the effect of CH on paw swelling degrees began to surpass the positive control group. The index of hind paw oedema and the index of spleen also exhibited an obvious recovery from model group under the treatment with CT (Figure 2). The spleen is an important immune organ. The improved effect of silkworm excrement on the spleen index indicates that it has a certain degree of immunosuppressive effect and can improve the rheumatoid arthritis symptoms by inhibiting the body’s immune response.
Table 1.
The results of ST and CT on body weight gain in AA rats.
| Day | 0 | 5 | 10 | 15 | 20 |
|---|---|---|---|---|---|
| C | 304.43 ± 13.83 | 343.33 ± 13.25 | 363.17 ± 15.08 | 378.50 ± 15.96 | 398.67 ± 24.14 |
| M | 290.57 ± 15.09 ## | 320.29 ± 13.28 ## | 341.29 ± 16.39 # | 353.14 ± 16.20 # | 368.00 ± 11.66 # |
| Y | 294.14 ± 15.26 | 330.14 ± 15.32 | 348.71 ± 15.63 | 364.29 ± 15.13 | 384.86 ± 16.60 |
| SL | 295.00 ± 18.85 | 332.00 ± 19.45 | 353.00 ± 20.22 | 367.11 ± 19.22 | 393.71 ± 20.47 * |
| SH | 295.20 ± 13.11 | 328.30 ± 10.12 | 348.00 ± 8.46 | 369.00 ± 9.10 | 388.13 ± 13.60 * |
| CL | 298.22 ± 15.20 | 334.14 ± 17.35 * | 360.17 ± 13.98 * | 369.67 ± 14.06 * | 390.44 ± 14.99 * |
| CH | 296.70 ± 11.75 | 335.00 ± 12.38 * | 358.22 ± 10.28 * | 370.00 ± 13.37 * | 389.20 ± 12.81 ** |
Values are presented as mean ± SD, n = 8. ** p < 0.01 compared with the AA model group. * p < 0.05 compared with the AA model group. ## p < 0.01 compared with the control group. # p < 0.05 compared with the control group.
Figure 1.
Effects of ST and CT on thickness of hind paw in AA rats. Values are presented as mean ± SD, n = 8. ** p < 0.01 compared with the AA model group; * p < 0.05 compared with the AA model group. ### p < 0.001 compared with control group; ## p < 0.01 compared with control group.
Figure 2.
Effects of ST and CT on index of paws oedema and spleen in AA rats. Values are presented as mean ± SD, n = 8. ** p < 0.01 compared with the AA model group; * p < 0.05 compared with the AA model group. ### p < 0.001 compared with the control group; # p < 0.05 compared with the control group.
2.2. Effect of ST and CT on Histopathological Changes in Ankle Joint
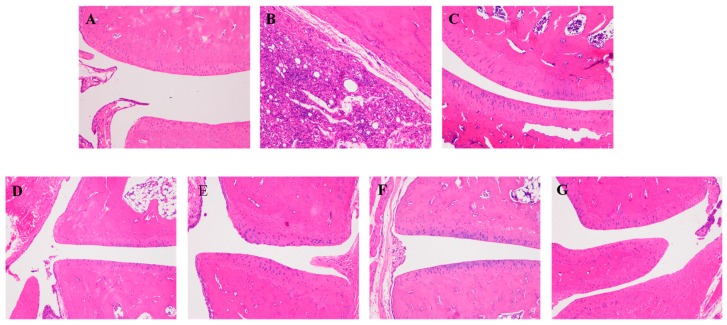
The ankle joints of rats in the model group exhibited synovial hyperplasia, mononuclear cell infiltration in the surrounding tissue, cartilage erosion and joint cavity narrow compared with the normal group. The AA rats received ST, CT treatment showed slightly synovial hyperplasia, prevented the infiltration of inflammatory cells and erosion of bone, and remedied joint stenosis. The rats in high dose of CT group exhibited a remarkable reduction in all pathological damages above compared with AA rats (Figure 3).
Figure 3.
Effects of ST, CT on histopathological changes of ankle joints in AA rat (×100, HE staining). All images are from one of eight in each group. (A) vehicle control, (B) AA model, (C) positive control, (D) ST (low dose), (E) ST (high dose), (F) CT (low dose), (G) CT (high dose).
2.3. Effect of ST and CT on Biochemical Parameters and Cytokines of Serum in AA Rats
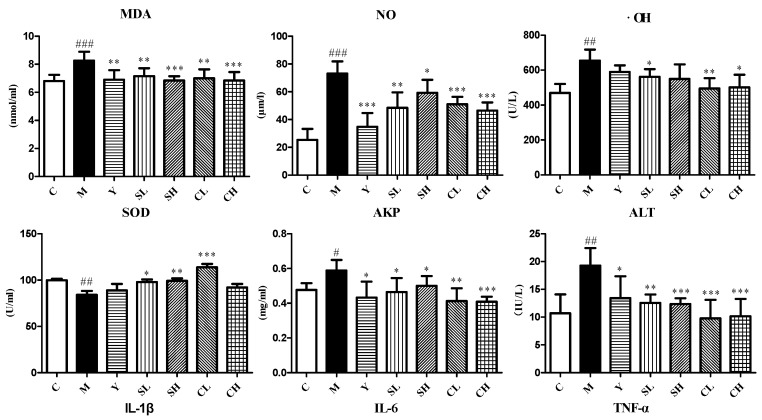
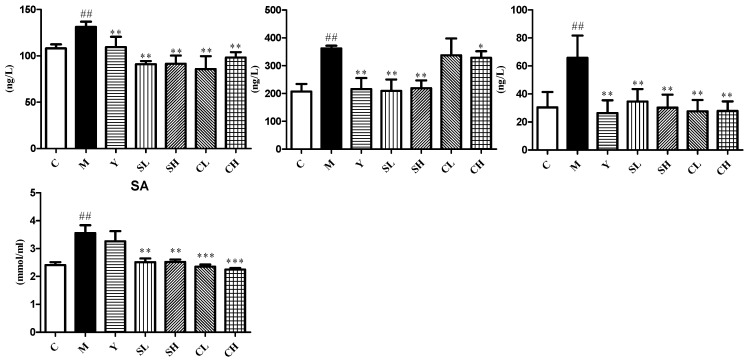
A significant increase in the MDA, NO and OH· levels was observed in AA rats. Meanwhile, the concentration of SOD was significantly lower in AA rats than normal animals. All these showed a higher level of oxidative stress and a lower level of antioxidant capacity. ST and CT treatments produced a significant reduction in the serum MDA, NO and OH· levels as compared to the model group, while the SOD level was also restored (Figure 4).
Figure 4.
Determination of MDA, NO, ·OH, SOD, AKP, ALT, IL-1β, IL-6, TNF-α and SA in serum among all groups. Values are presented as mean ± SD, n = 8. *** p < 0.001 compared with the AA model group; ** p < 0.01 compared with the AA model group; * p < 0.05 compared with the AA model group. ### p < 0.001 compared with the control group; ## p < 0.01 compared with the control group; # p < 0.05 compared with the control group.
All the model animals showed an increase in serum AKP, ALT and SA levels. The treatments of ST, CT and indomethacin reverted all these indexes. The decreases of AKP, ALT and SA were significant compared with AA rats. The treatment of ST and CT produced a dose dependent reduction and were better than indomethacin (Figure 4).
Serum IL-6, IL-1βand TNF-α levels showed a similar effect. IL-6, IL-1βand TNF-αlevels of model group were significantly increased compared with control group. The treatment with ST, CT reverted the up-regulated levels of IL-6, IL-1βand TNF-α. While, the ST showed better effects on IL-6, IL-1βlevels (Figure 4).
2.4. Metabolomics Results
2.4.1. QC Samples Analysis
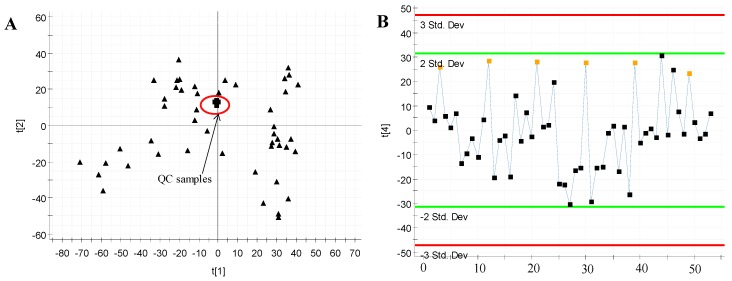
The relatively tight clustering of QC samples (Figure 5) and relative standard deviations (RSD%) of ion intensity (Table 2) demonstrated the quality of QC data. The trend plot showed the variation over all observations with respect to run order (Figure 5B). Ten ions chromatographic peaks were selected to method validation. The repeatability of method was evaluated through six replicates of QC sample. From the PCA results (Figure 5), it can be seen that the QC samples are tightly clustered together, indicating that the experimental results have little difference and the instrument stability is good. These results provided the repeatability and stability of the method were well.
Figure 5.
Assessment of QC samples (A) PCA score plot (PC1 versus PC2) of test samples and QC samples; (B) Trend plot showing the variation of t[1] over all observations. QC samples were colored as red boxes and test samples were colored as black triangle. X axis numbers represented sample number (53 injections). Y axis was arbitrary.
Table 2.
Coefficient of variation of ion intensity of selected ions present in the QC samples covering the range of retention times.
| TR_m/z Pairs | QC1 | QC2 | QC3 | QC4 | QC5 | QC6 | RSD% |
|---|---|---|---|---|---|---|---|
| 1.58_218.1055 | 21.69666 | 22.13039 | 19.78364 | 19.24688 | 19.91056 | 20.79174 | 5.56 |
| 2.02_160.0429 | 21.94678 | 21.72565 | 19.82855 | 19.83975 | 19.87191 | 21.20539 | 4.84 |
| 3.01_336.0743 | 86.66117 | 88.21009 | 87.51105 | 88.2303 | 83.3309 | 86.05141 | 2.13 |
| 4.3_113.0266 | 94.79924 | 94.10457 | 94.61891 | 96.31335 | 94.83017 | 94.60155 | 0.79 |
| 5.99_417.1196 | 98.49249 | 98.61852 | 103.366 | 97.91074 | 104.4012 | 96.68017 | 3.17 |
| 7.48_357.1018 | 199.4248 | 198.0985 | 198.6274 | 190.8936 | 201.4087 | 194.3293 | 1.94 |
| 8.26_355.1405 | 126.9033 | 118.2539 | 121.2757 | 123.4014 | 127.2227 | 120.4814 | 2.93 |
| 9.59_291.1269 | 21.91479 | 21.79148 | 21.69425 | 22.98142 | 21.70019 | 22.18444 | 2.24 |
| 11.28_450.2643 | 11.66441 | 13.14806 | 12.26132 | 12.96975 | 13.07599 | 12.1941 | 4.79 |
| 13.24_681.2932 | 18.93239 | 20.19889 | 18.84712 | 18.31389 | 20.96083 | 18.7799 | 5.24 |
2.4.2. Multivariate Statistical Analysis
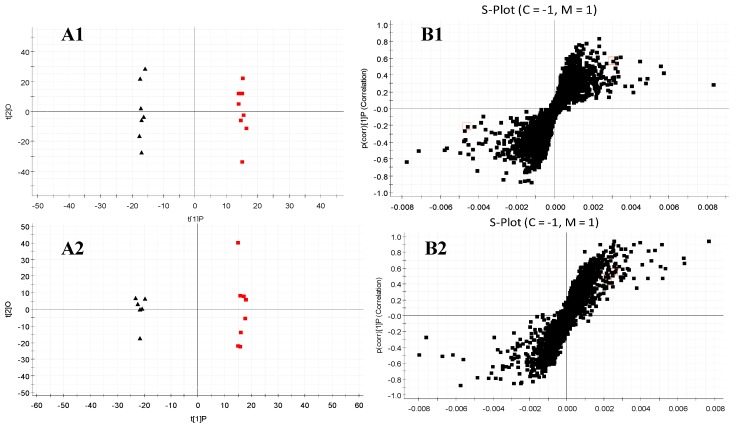
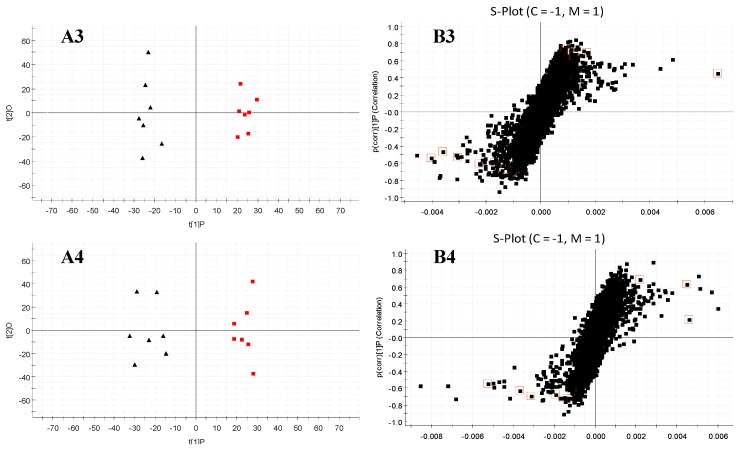
The data of serum and urine samples were analyzed by OPLS-DA and PLS-DA in both positive and negative modes. The score plots of OPLS-DA presented notable separation between control and model groups both in serum and urine metabolic profiles (Figure 6(A1–A4)). R2Y and Q2of the OPLS-DA model in positive and negative modes were both above 0.75; suggesting that the OPLS-DA models presented excellent classification and prediction ability. The potential metabolic markers between control and model groups could be identified from the Splot of OPLS-DA (Figure 6(B1–B4)), combining with the retention time, the standard references, precise molecular mass and MS/MS data.
Figure 6.
OPLS-DA scores plots (A) and S-plot of OPLS-DA (B) for serum (lable 1, 2), and urine (lable 3, 4) of AA model group (red) versus healthy controls (black) in positive and negative ion mode. The label of 1 and 3 were obtained in positive ion mode, with the label of 2 and 4 in negative ion mode. (A1, R2Y = 0.9877, Q2 = 0.8773; A2, R2Y = 0.9903, Q2 = 0.9311; A3, R2Y = 0.9835, Q2 = 0.8213; A4, R2Y = 0.9033, Q2 = 0.8433).
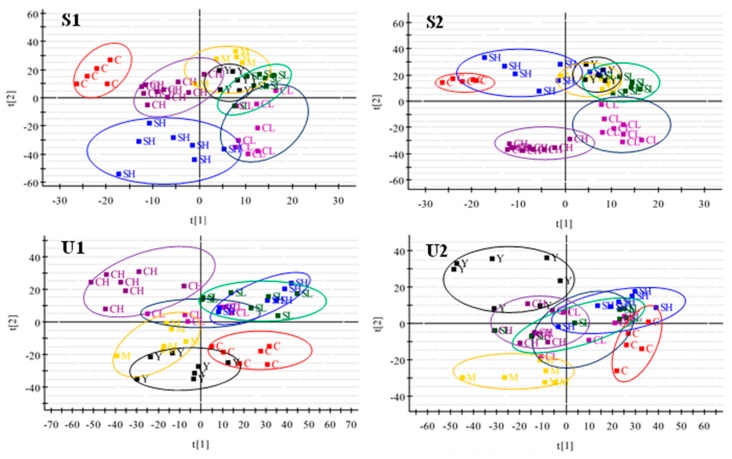
PLS-DA model was built to exhibit the metabolic distinction among all groups (Figure 7). The R2Y and Q2 of PLS-DA model in positive and negative modes indicated that the PLS-DA model was good to fitness and prediction. The variations of metabolic profiling in serum and urine for administration group rats had the tendency to restore back to the levels of controls, especially the SH group. It was obviously found that the relative distance in positive and negative modes of SH and CH groups decreased significantly in serum compared with model group, indicating that SH and CH groups had better effects than other treated groups. While, in urine samples, SL and SH performed better.
Figure 7.
PLS-DA scores plots of serum (S) and urine (U) samples from controls, models, treatment rats in positive and negative ion mode. The label of S1 and U1 were obtained in positive ion mode, with the label of S2 and U2 in negative ion mode. (S1, R2Y = 0.9472, Q2 = 0.8536; S2, R2Y = 0.9773, Q2 = 0.9178; U1, R2Y = 0.9665, Q2 = 0.8923; U2, R2Y = 0.9213, Q2 = 0.8463).
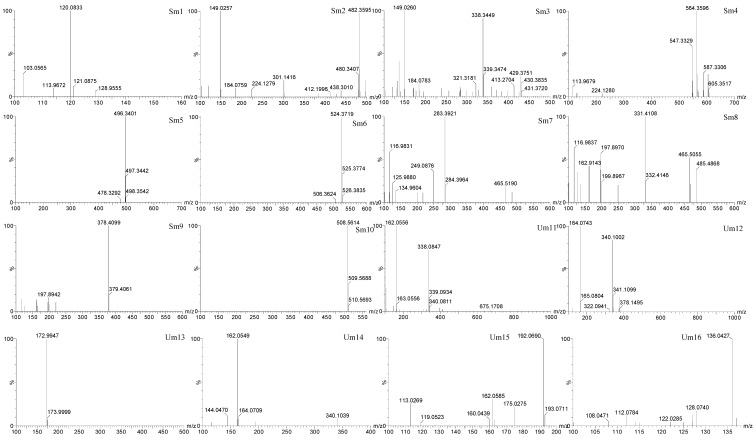
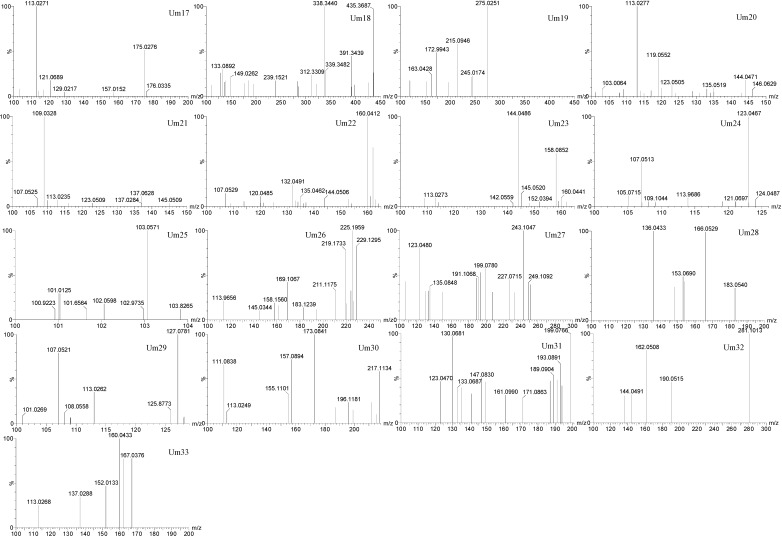
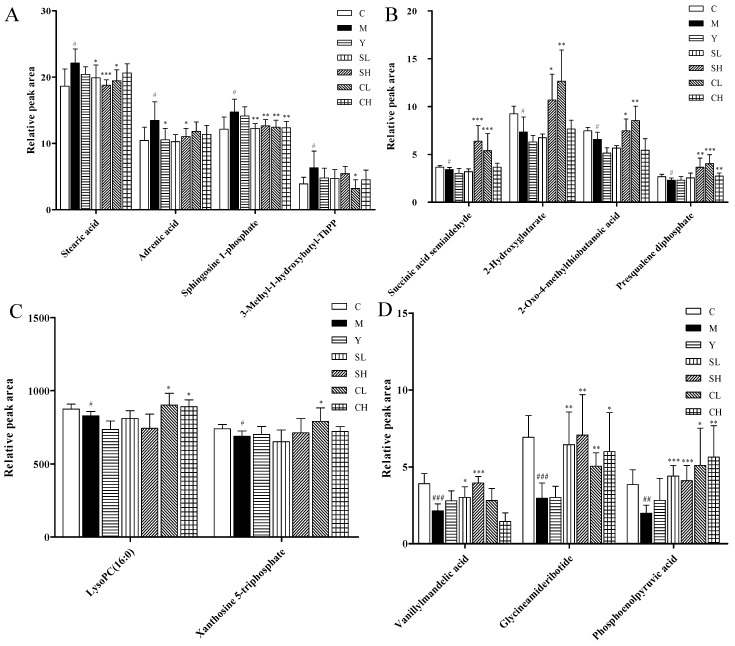
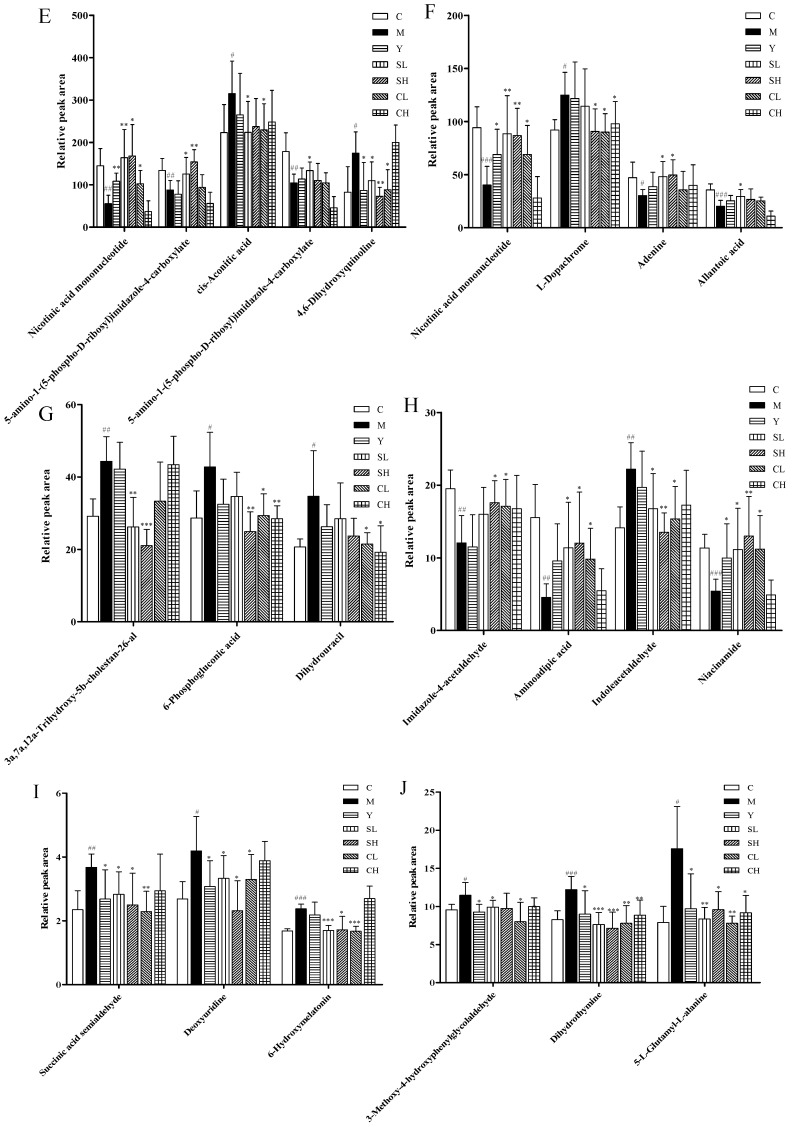
Identification of the endogenous biomarkers was based on retention time, mass assignment and the fragments of corresponding production for the structural identification of metabolites from the UPLC-QTOF/MS analysis platform. In this study, thirty-three endogenous metabolites (ten in serum and twenty-three in urine) were ultimately identified which showed significantly changes between controls and AA models (p < 0.05 or p < 0.01 or p < 0.001) (Table 3). The MS/MS spectra of fragment ions of metabolites are shown in Figure 8. After administration for three weeks, the related potential biomarkers were restored back to a control-like level. The detailed information is shown in Figure 9.
Table 3.
Potential metabolites selected and identified between AA group and control group.
| No. | TR/min | m/z | Formula | Identification | Vip | Trend | HMDB | Pathway |
|---|---|---|---|---|---|---|---|---|
| Sm1 | 1.23 | 103.0576 | C4H6O3 | Succinic acidsemialdehyde | 1.25 | ↓ | 01259 | Alanine, aspartate and glutamate metabolism |
| Sm2 | 8.11 | 149.0263 | C5H8O5 | 2-Hydroxyglutarate | 2.42 | ↓ | 59655 | Butanoate metabolism |
| Sm3 | 13.48 | 149.0264 | C5H8O3S | 2-Oxo-4-methylthiobutanoic acid | 1.85 | ↓ | 01553 | Cysteine and methionine metabolism |
| Sm4 | 2.12 | 587.327 | C30H52O7P2 | Presqualene diphosphate | 1.14 | ↓ | 01278 | Steroid biosynthesis |
| Sm5 | 7.68 | 496.3398 | C24H50NO7P | LysoPC(16:0) | 5.44 | ↓ | 10382 | Glycerophospholipid metabolism |
| Sm6 | 9.44 | 525.0546 | C10H15N4O15P3 | Xanthosine 5-triphosphate | 3.45 | ↑ | 00293 | Purine metabolism |
| Sm7 | 13.41 | 283.3893 | C18H36O2 | Stearic acid | 2.28 | ↑ | 00827 | Biosynthesis of unsaturated fatty acids |
| Sm8 | 11.94 | 331.4114 | C22H36O2 | Adrenic acid | 1.79 | ↑ | 02226 | Biosynthesis of unsaturated fatty acids |
| Sm9 | 5.97 | 378.408 | C18H38NO5P | Sphingosine 1-phosphate | 1.63 | ↑ | 00277 | Sphingolipid metabolism |
| Sm10 | 9.44 | 509.753 | C17H29N4O8P2S | 3-Methyl-1-hydroxybutyl-ThPP | 1.53 | ↑ | 06865 | Valine, leucine and isoleucine degradation |
| Um11 | 3.02 | 338.086 | C11H16NO9P | Nicotinic acid mononucleotide | 11.13 | ↓ | 01132 | Nicotinate and nicotinamide metabolism |
| Um12 | 3.61 | 340.1018 | C9H14N3O9P | 5-amino-1-(5-phospho-d-ribosyl)-imidazole-4-carboxylate | 8.98 | ↓ | 06273 | Purine metabolism |
| Um13 | 2.32 | 172.9933 | C6H6O6 | cis-Aconitic acid | 4.56 | ↑ | 00072 | Citrate cycle (TCA cycle) |
| Um14 | 3.7 | 162.0573 | C9H7NO2 | 4,6-Dihydroxyquinoline | 10.01 | ↑ | 04077 | Tryptophan metabolism |
| Um15 | 3.67 | 192.0679 | C9H7NO4 | l-Dopachrome | 3.59 | ↑ | 01430 | Tyrosine metabolism |
| Um16 | 1.02 | 136.0423 | C5H5N5 | Adenine | 4.89 | ↓ | 00034 | Purine metabolism |
| Um17 | 6.06 | 175.0265 | C4H8N4O4 | Allantoic acid | 4.86 | ↓ | 01209 | Purine metabolism |
| Um18 | 13.73 | 435.3682 | C27H46O4 | 3a,7a,12a-Trihydroxy-5b-cholestan-26-al | 4.01 | ↑ | 03533 | Primary bile acid biosynthesis |
| Um19 | 2.7 | 275.0249 | C6H13O10P | 6-Phosphogluconic acid | 4.50 | ↑ | 01316 | Pentose phosphate pathway |
| Um20 | 2.72 | 113.0266 | C4H6N2O2 | Dihydrouracil | 1.61 | ↑ | 00076 | Pantothenate and CoA biosynthesis |
| Um21 | 2.00 | 109.0381 | C5H6N2O | Imidazole-4-acetaldehyde | 3.25 | ↓ | 03905 | Histidine metabolism |
| Um22 | 2.03 | 162.0579 | C6H11NO4 | Aminoadipic acid | 3.98 | ↓ | 00510 | Lysine degradation |
| Um23 | 2.4 | 158.0841 | C10H9NO | Indoleacetaldehyde | 3.45 | ↑ | 01190 | Tryptophan metabolism |
| Um24 | 5.99 | 123.0475 | C6H6N2O | Niacinamide | 3.89 | ↓ | 01406 | Nicotinate and nicotinamide metabolism |
| Um25 | 5.65 | 103.0575 | C4H6O3 | Succinic acid semialdehyde | 1.01 | ↑ | 01259 | Butanoate metabolism |
| Um26 | 10.05 | 229.1286 | C9H12N2O5 | Deoxyuridine | 1.79 | ↑ | 00012 | Pyrimidine metabolism |
| Um27 | 6.05 | 249.1148 | C13H16N2O3 | 6-Hydroxymelatonin | 1.24 | ↑ | 04081 | Tryptophan metabolism |
| Um28 | 1.04 | 183.054 | C9H10O4 | 3-Methoxy-4-hydroxyphenylg lycolaldehyde | 2.37 | ↑ | 04061 | Tyrosine metabolism |
| Um29 | 4.04 | 127.0788 | C5H8N2O2 | Dihydrothymine | 1.79 | ↑ | 00079 | Pyrimidine metabolism |
| Um30 | 4.52 | 217.1098 | C8H14N2O5 | 5-l-Glutamyl-l-alanine | 1.44 | ↑ | 06248 | Glutathione metabolism |
| Um31 | 6.08 | 199.0781 | C9H10O5 | Vanillylmandelic acid | 2.10 | ↓ | 00291 | Tyrosine metabolism |
| Um32 | 2.53 | 285.0634 | C7H15N2O8P | Glycineamideribotide | 2.18 | ↓ | 02022 | Purine metabolism |
| Um33 | 1.82 | 167.037 | C3H5O6P | Phosphoenolpyruvic acid | 1.23 | ↓ | 00263 | Glycolysis or gluconeogenesis |
Figure 8.
MS/MS spectra of fragment ions of metabolites.
Figure 9.
Relative peak area of potential biomarkers identified in serum (A–C) and urine (D–J) in positive and negative ion mode. Values are presented as mean ± SD, n = 8. *** p < 0.001 compared with the AA model group; ** p < 0.01 compared with the AA model group; * p < 0.05 compared with the AA model group. ### p < 0.001 compared with the control group; ## p < 0.01 compared with the control group; # p < 0.05 compared with the control group.
2.4.3. Metabolic Pathway Analysis
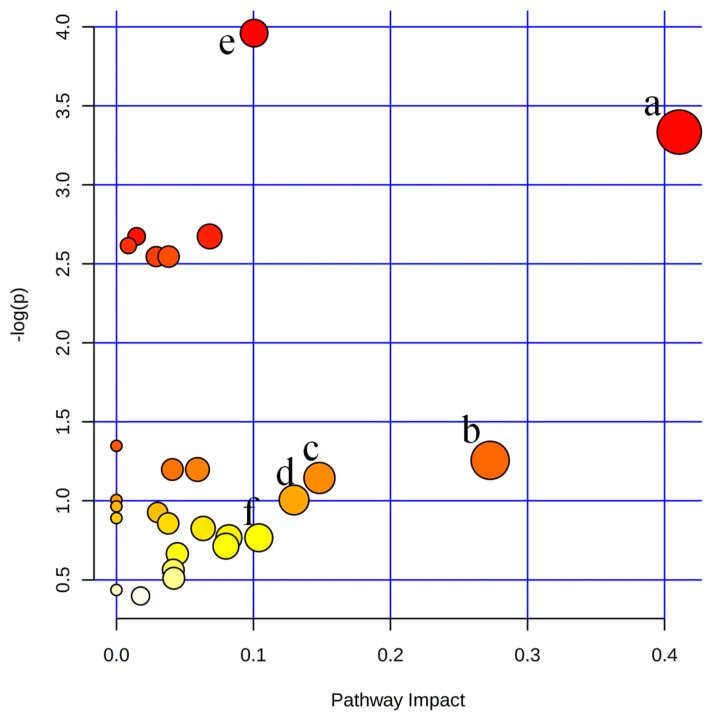
In order to explore potential metabolic pathways affected by the treatment of ST and CT, endogenous metabolites identified above were imported into the web-based database MetPA. The pathways with an impact value above 0.10 were screened out as the potential target pathway. As shown in Figure 10, the selected metabolites are involved in nicotinate and nicotinamide metabolism, pentose and glucuronate interconversions, TCA cycle, beta-Alanine metabolism; purine metabolism and glycolysis or gluconeogenesis.
Figure 10.
Summary of pathway analysis of serum and urine samples of rats. (a) Nicotinate and nicotinamide metabolism; (b) pentose and glucuronate interconversions; (c) TCA cycle; (d) β-alanine metabolism; (e) Purine metabolism; (f) glycolysis or gluconeogenesis.
2.5. Pathway Enrichment Analysis
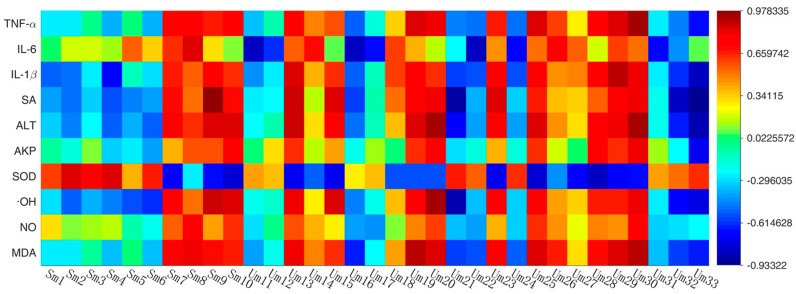
Pearson correlation matrix analysis method was used to discover the correlations between potential biomarkers and biochemical indicators and the significance of the connection was set at the level of p < 0.05. The results of correlation analysis between potential biomarkers and biochemical indicators in serum and urine were presented in Figure 11.
Figure 11.
Correlation analysis between biomarkers and biochemistry indicators according to their pearson correlation coefficient. (all the labels present the same biomarkers as the Table 3).
The level of TNF-α, IL-1β, SA, ALT, AKP, ·OH, and MDA positively correlated with sm7, sm8, sm9, sm10, um13, um19, um20, um23, um29 and um30 (r > 0.6), negatively correlated with um21, um22, um32 and um33 (r < 0.6). SOD positively correlated with sm2, sm3 and sm4 (r > 0.6), negatively correlated with sm10, um13, um15, um23, um25 and um28 (r < 0.6). These correlations found in this study between biomarkers and biochemical indicators could provide reference to understand the pathological mechanisms of the RA.
3. Discussion
The aim of the present study was to assess the therapeutic efficacy of SE, and try to elucidate the anti-arthritic mechanism through metabolic profiling. In this study, both the ST and CT suppressed the increase of IL-1β, IL-6 and TNF-α efficiently while the ST showed better effect than CT. As previous reported, inflammation mediators such as IL-1β, IL-6 and TNF-α play an important role during the process of RA by inducing the infiltration of immune cells and stimulating the release of MMPs [11]. TNF-α is believed to be the key role in the pathogenesis of RA [12]. Many signaling pathways and pro-inflammatory cytokines relative to RA can be simulated by TNF-α [13]. IL-1 is another most important cytokine in the pathogenesis of RA, while IL-1β has more important potential to degrade cartilage and bone than TNF-α [14]. In addition, it has been demonstrated that IL-6 is likely to provide a useful adjunct to the individuals with RA who fail to respond to drugs that block TNF-α [11]. Downregulation of TNF-α, IL-1 and IL-6 simultaneously was probably impact the NF-κB signaling pathway, and relieve the symptoms of RA [15].
Meanwhile, we compared the metabolic characteristics of AA models with healthy controls by using LC-MS platforms combined with multivariate statistical analysis. To some extent, it is an effective approach to investigate how SE works. Previous metabolomics and clinical biochemistry studies have demonstrated that RA could lead to a series of complex responses from multiple metabolic pathways, such as energy metabolism, carbohydrate metabolism, lipid metabolism, amino acid metabolism and so on [16]. In this study, thirty-three metabolites were identified as potential biomarkers of AA rats, which were significantly related to six biological pathways, including nicotinate and nicotinamide metabolism, pentose and glucuronate interconversions, TCA cycle, beta-Alanine metabolism; purine metabolism and glycolysis or gluconeogenesis. The levels of adenine, aminoadipic acid, nicotinic acid mononucleotide, phosphoenolpyruvate, glycinamide, nucleotide, uric acid, Lyso-PC (16:0) were significantly decreased and the levels of succinate semialdehyde, deoxyadenosine, dihydrouracil and 6-phosphogluconate were significantly increased compared with normal controls, which were consistent with literature [17]. Lyso-PC, an important component of oxidized low-density lipoprotein (oxLDL), has been confirmed to be a chemoattractant for T lymphocytes [18]. It also induces antibody formation and macrophage stimulation. Thus the Lyso-PC could make an impact on the inflammation state of an organism. Abnormalities in these metabolites may reflect the impact of AA on phospholipid metabolic pathway. However, treatment with SE normalized these altered levels into near normal.
Notably niacin and nicotinamide metabolic were filtered out as the most important metabolic pathways in present study. Nicotinamide is an amide form of nicotinic acid which exerts its protective function against oxidative stress and inflammation by participating in the energy metabolism of cells. Furthermore, it can effectively prevent cell membranes from free radical damage and block the activation of inflammatory cells [19]. In addition, tricarboxylic acid cycle (TCA), an important energy metabolism pathway, was significantly enhanced. Abnormal excretion of TCA intermediates in AA rats may indicate mitochondrial dysfunction in RA. As cell mitochondria contains most of the tricarboxylic acid cycle enzymes, including citrate synthase (CS) [20].
Besides, glycolysis or gluconeogenesis play a key role in the upkeep of many organisms with sufficient external sugar sources. Some studies have reported that there is increased glycolytic activity in the synovial tissue of RA patients [21]. Our previous results showed that the body weight of AA models were significantly decreased compared with normal controls. By means of SE treatment, the levels of body weight could be up-regulated significantly. A previous study showed that uric acid is the metabolite of purine and pyrimidine in normal synovial tissues. It has strong anti-oxidant effect, so as to remove reactive oxygen species, directly [22]. Low concentrations of uric acid in AA models may indicate that the oxidative damage have close relationship with RA. In addition, SE exhibited significant antioxidant activities indicated by suppressive effects on MDA, ·OH and NO, up-regulation of SOD. Reactive oxygen species (ROS) are produced by normal cellular metabolism, and play an important role in the defense system against infection [23]. But in RA conditions, aggregation of activated monocyte and macrophages could result in excessive ROS production in joints and organs, and cause a direct damage to the cell membrane [24]. At the same time, the concentrations of relative enzymes such as AKP, ALT increased significantly. Administration with SE restored the metabolites and biochemistry indicators correlated with oxidative stress. The result indicated SE can protect organisms from oxidative damage.
Previous studies showed that RA can decay the uptake of amino acid. SE appeared to regulate the amino acid metabolism, mainly including tryptophan, leucine and β-alanine. Tryptophan, one of the essential amino acids in the human body, can inhibits the differentiation, proliferation and functional expression of T cells [25]. Activation of antigen-specific T cells is thought to be central to the onset and progression of RA and can accelerate joint inflammation and tissue destruction [26]. It was found that tryptophan metabolism disorders in patients with rheumatoid arthritis [27]. Leucine is known to synthesize immune-related proteins, remove aging, damaged proteins and participate in tissue repair renewal [28]. Beta-alanine, an amino acid that is not involved in protein synthesis, is widely used as a nutritional supplement to improve animal performance [29].
4. Materials and Methods
4.1. Chemicals and Instruments
Complete Freund’s adjuvant (CFA) (containing 1.0 mg of dry, heat-killed Mycobacterium tuberculosis (strain H37Ra) per 1.0 mL sterile, non-metabolizable oils) and the reference drug indomethacin were purchased from Sigma-Aldrich (St. Louis, MO, USA). UPLC-grade acetonitrile was purchased from Merck (Darmstadt, Germany), formic acid was purchased from Sigma-Aldrich and reference drug indomethacin was purchased from Shanghai New Yellow River Pharmaceutical Limited (Shanghai, China).
Waters Acquity TM Ultra Performance LC system (Waters, Milford, MA, USA) equipped with a Quattro Micro MS spectrometer and a Waters Xevo TM G2 QTof MS (Waters MS Technologies, Manchester, NH, USA). Deionized water was purified on a Milli-Q system (Millipore, Bedford, MA, USA). Mass Lynx v4.1 workstation was adopted to analyze the data, and Ultra-highspeed centrifuge at low temperature (Thermo Scientific, Waltham, MA, USA); DMI3000M microscope (Leica, München, Germany) were used.
4.2. Herbal Preparation and Extraction
The silkworm excrement (ID161104) was purchased from the Li Liang Ji Pharmaceutical Company (Suzhou, China). The silkworm excrement (5 kg) was extracted with water two times and underwent reflux extraction for 1 h each time. The two batches of filtrates were combined and concentrated through vacuum concentrating system for later research. Preparation of ethanol extract: The ethanol extract was gained through the same method. The only one thing that was different is replace water with 60% alcohol.
4.3. Animals
Male Sprague-Dawley rats weighing 180–220 g were purchased from the Experimental Animal Center of Zhejiang Province (Zhejiang, China; certificate no. SCXK 2014-0001). All animals were housed in cages under the controlled conditions (constant humidity: 60 ± 2%, temperature: 23 ± 2 °C, light: 2 h on/12 h off) and with standard pelleted food and water ad libitum. The animal protocol was approved by the Ethical Committee of Nanjing University of Chinese Medicine, and strictly abide by the requirement for the care and use of laboratory animals (US National Research Council, 2011).
4.4. Freund’s Adjuvant Induced Arthritis
All animals were allowed to acclimatize to laboratory conditions before experiment for 7 days, during which they were allowed access to food and water ad libitum. After the acclimation period, all animals were induced with 0.1 mL Freund’s complete adjuvant via intradermal immunization in rat’s right hind paw except vehicle control (with eight rats). After 7 days, all animals were induced with 0.1 mL Freund’s complete adjuvant in the base of tails to strengthen the immunity effect. Saline (0.1 mL) was injected in the right paw and tail of the vehicle control animals.
4.5. Administration
After the first injection, AA rats were randomly divided into six groups (M, Y, SL, SH, CL, CH) consisting of eight animals per group. According to the raw drug dose calculation of each group, the doses are as follows, SL, CL (5.4 g/kg/d), SH, CH (10.8 g/kg/d). All animals were received various doses by gastric intubation daily for 21 days. The rats of M (AA model controls) and C (vehicle controls) were given pure water instead, and the Y (positive controls) were given 3 mg/kg indomethacin at the same time.
4.6. Serum and Urine Sampling
After 21 days of treatment, rats were put individually in the metabolism cages for 24-h urinary collection. And the urine samples were stored at −80 °C until analysis. At day 22 (since treatment), the rats were anesthetized. The whole blood was collected through abdominal aorta, and collected into clean test-tubes with or without EDTA. Then, the blood samples without EDTA were immediately centrifuged at 3000 rpm for 10 min, and the serum samples were separated and stored at −80 °C until analysis.
4.7. Measurement of Paw Edema, Body Weight, Paws Oedema Index and Spleen Index
The body weight and hind paws edema were periodically measured since the second induction [30]. The intervention effect was evaluated by hind paw edema index after sacrifice. The index of hind paw edema was described as the ratio (mg/g) of hind paws weight versus body weight. After treatment was completed, the foot swelling index was used to assess the ultimate therapeutic effect of the drug on the affected foot. The index of spleen was described as the ratio (mg/g) of spleen weight versus body weight.
4.8. Histological Examination
After sacrificed animals, the ankle joints of the inoculated sides were harvested for analysis. The samples were stored in 10% formalin to decalcify. After two weeks, the samples were sectioned, embedded in paraffin, and sliced for hematoxylin and eosin (H&E) for general evaluation. The severity of the arthritis was evaluated based on the changes in inflammatory cells, synovial hyperplasia, pannus formation, cartilage and bone erosion [31].
4.9. Biochemical Analysis and Cytokines Assessment in Serum
The levels of superoxide dismutase (SOD), hydroxy radical (OH), nitric oxide (NO), malondialdehyde (MDA), alkaline phosphatase (AKP), alanine transaminase (ALT), sialic acid (SA) in serum were determined by using quantitative colorimetric assay kits according to the manufacturer instructions. The levels of interleukin-1β (IL-1β), interleukin-6 (IL-6) and tumor necrosis factor alpha (TNF-α) were determined by using rat cytokine ELISA kits according to the manufacturer instructions. All these kits were purchased from JianCheng Bioengineering Institute, (Jiangsu, China).
4.10. UPLC/Q-TOF/MS Analysis of Metabolic Profling
4.10.1. Sample Preparation for LC−MS
The serum and urine samples were thawed at room temperature before operation. The acetonitrile (300 μL) was added into each serum sample (100 μL), then the mixture was vortexed for 60 s and centrifuged at 13,000 rpm for 10 min at 4 °C. The acetonitrile (200 μL) was added into each urine sample (200 μL), then the mixture was vortexed for 60 s and centrifuged at 13,000 rpm for 10 min at 4 °C. Prepared samples were stored at 4 °C before transferred to the autosamplers. The quality control (QC) samples were prepared by mixing 14 serum (or urine) samples randomly selected from each group (two from each group). Thus the QC samples could represent the whole sample set. The QC samples were injected every ten samples throughout the whole process to assess the method stability and repeatability.
4.10.2. UPLC-Q TOF/MS Conditions
Chromatographic separation was performed on a Waters AcquityTM Ultra Performance LC system (Waters) equipped with a Waters XevoTM G2 Q/TOF-MS (Waters MS Technologies). ACQUITY UPLCTM BEH C18 column (100 mm × 2.1 mm, 1.7 m, Waters) was applied for all analyses at 35 °C. The injection volume was 2 μL and the flowrate was 0.4 mL/min. The optimal mobile phase was composed of water (A) (containing 0.1% formic acid) and acetonitrile (B). For serum analysis, the optimized UPLC elution conditions were as follows: 0~3 min, 95~55% A; 4~13 min, 55~5% A; 13~14 min, 5% A; For urine analysis, the optimized UPLC elution conditions were as follows: 0~8 min, 95~70% A; 8~11 min, 70~30% A; 11~13 min, 30~5% A; 13~14 min, 5% A.
Mass spectrometry was performed using a XevoTM G2 QTof (Waters MS Technologies), operated using an electrospray ionization (ESI) source in positive and negative mode. The ionization source conditions were as follows: capillary voltage, 3.0 kV; cone voltage 30 V; source temperature, 120 °C; desolvation temperature, 350 °C and extraction cone voltage 2 V. The cone and desolvation gas flow rates were 50 and 600 L/h, respectively. To ensure accuracy during the MS analysis via a syringe pump, Leucine-enkephalin was used as the lock mass generating an [M + H]+ ion (m/z 556.2771) and [M − H]− ion (m/z 554.2615) in positive and negative modes, respectively. The concentration of leucine-enkephalin was 200 pg/mL and the infusion flow rate was 100 μL/min. The MS data were collected from m/z 100–1000 Da in positive and negative ion modes. The desolvation gas was set to 600 L/h at a temperature of 350 °C, the cone gas was set to 50 L/h and the source temperature was set to 120 °C. The data acquisition rate was set to 30 ms, with a 0.02 s interscan delay. The scan range was from 100 to 1000.
4.10.3. Metabolomics Data Processing and Analysis
The LC–MS raw data were analyzed by Waters MassLynx v4.1 software. After data pretreatment procedures including peak finding, alignment, filtering and normalization to total area, a data matrix consisted of retention time, m/z value, and the normalized peak area was obtained [32]. The main parameters were set as follows: retention time range 1–15 min, mass range 100–1000 amu, mass tolerance 0.1 Da, and noise elimination level 5.
The multivariate data matrix was analyzed by EZinfo software 2.0 (Waters). The analysis methods containing partial least-squares discriminant analysis (PLS-DA) and orthogonal partial least-squares discriminant analysis (OPLS-DA). Prior to PLS-DA and OPLS-DA, all variables obtained from UHPLC–MS data sets were mean-centered and scaled to Pareto variance.
The quality of the model was described by the cross-validation parameter Q2 and R2Y, which represents the predictability of the model and the total explained variation for the X matrix, respectively. The variable importance in the projection (VIP) value is a weighted sum of squares of the PLS weights, reflecting the relative contribution of each X variable to the model. And the variables with VIP >1 were considered to be influential for the separation of samples in the score plots generated from PLS-DA analysis [33].
4.10.4. Biomarker Identification and Metabolic Pathway Analysis
OPLS-DA was performed to discrible the metabolic difference between model group and control group. Prior to that, another OPLS-DA was performed. The normal group and the model were combined into a blank group, and all the administration combinations were the administration group. A S-Plot map between blank group and administration group was used to deleted data points that exist in administration group but do not exist in the blank group. The variables with VIP >1 in the OPLS-DA model, as well as t-test (p < 0.05) were considered as the potential biomarkers. The potential metabolites were identified according to the accurate m/z, retention time, and typical MS/MS fragment and pattern of the potential biomarkers through searching the HMDB (http://www.hmdb.ca/) databases. Pathway analysis was depended on KEGG database (http://www.genome.jp/ kegg/) and Metabo Analyst 3.0 (http://www.MetaboAnalyst.ca/), which is a web-based tool for visualization of metabolomics based on database source including the KEGG and the HMDB databases.
5. Conclusions
The present study validated the intervention efficacy of silkworm excrement on AA rats through many methods. Notably, we integrated information obtained from metabonomic analysis of urine and serum samples of SE-induced AA rats to characterize the systemic metabolic changes during the development of RA. Through the application of metabolomics technology, 33 endogenous metabolites (10 in serum and 23 in urine) and six significantly related metabolic pathways could be identified in the process of RA. After SE intervention, these biomarkers were restored to some extent (p < 0.05). Other than that, the samples were tested only at one time point, a follow-up study to verify the reproducible could be also needed in the future. Thus, the results paved the way for further elucidation of the anti-arthritis mechanism of silkworm excrement.
Acknowledgments
This research received supports from the Construction Project for Jiangsu Key Laboratory for High Technology of TCM Formulae Research (BM2010576), and a project funded by the Priority Academic Program Development of Jiangsu Higher Education Institutions (ysxk-2014).
Author Contributions
The list authors contributed to this work as follows: S.S. and J.-A.D. conceived and designed the experiments, T.Z. wrote the paper; T.Z., X.D. and L.Z. performed the experiment and analyzed the data; Z.O.-Y. contributed materials; S.S. and J.-A.D. acquired funding for the research.
Funding
This work was supported by the National Natural Science Foundation of China (Grant Nos. 81373889, 81673533) and the Program for Excellent Talents in the School of Pharmacy of the Nanjing University of Chinese Medicine (15ZYXET-2). This work was also financially supported by Jiangsu Collaborative Innovation Center of Chinese Medicinal Resources Industrialization (Grant No. ZDXM-3-7).
Conflicts of Interest
The authors declare no conflict of interest.
Footnotes
Sample Availability: Samples of ethanol extract and water extract of Silkworm Excrement are available from the authors.
References
- 1.Sfriso P., Punzi L., Ianniello A., Lazzarin P., Ostuni P.A., Gambari P.F. Clinical, radiological and laboratory aspects of rheumatoid arthritis associated with high serum levels of IgA. Clin. Exp. Rheumatol. 1994;12:690–691. [PubMed] [Google Scholar]
- 2.Williams R., Lenz E.M., Wilson A.J., Granger J., Wilson I.D., Major H., Stumpf C., Plumb R. A multi-analytical platform approach to the metabonomic analysis of plasma from normal and Zucker (fa/fa) obese rats. Mol. Biosyst. 2006;2:174–183. doi: 10.1039/b516356k. [DOI] [PubMed] [Google Scholar]
- 3.Toms T.E., Panoulas V.F., Smith J.P., Douglas K.M., Metsios G.S., Kalinoglous A.S., Kitas G.D. Rheumatoid arthritis susceptibility genes associate with lipid levels in patients with rheumatoid arthritis. Ann. Rheum. Dis. 2011;70:1025–1032. doi: 10.1136/ard.2010.144634. [DOI] [PubMed] [Google Scholar]
- 4.Kawashiri S.Y., Kawakami A., Yamasaki S., Imazato T., Iwamoto N., Fujikawa K., Aramaki T., Tamai M., Nakamura I.H., Origuchi T., et al. Effects of the anti-interleukin-6 receptor antibody, tocilizumab, on serum lipid levels in patients with rheumatoid arthritis. Rheumatol. Int. 2011;31:451–456. doi: 10.1007/s00296-009-1303-y. [DOI] [PubMed] [Google Scholar]
- 5.Wilson I.D., Nicholson J.K. Understanding ‘Global’ Systems Biology: Metabonomics and the Continuum of Metabolism. Nat. Rev. Drug Discov. 2003;2:668–676. doi: 10.1038/nrd1157. [DOI] [PubMed] [Google Scholar]
- 6.Madsen R.K., Lundstedt T., Gabrielsson J., Sennbro C.J., Alenius G.M., Moritz T., Rantapää-Dahlqvist S., Trygg J. Diagnostic properties of metabolic perturbations in rheumatoid arthritis. Arthritis Res. Ther. 2011;13:R19. doi: 10.1186/ar3243. [DOI] [PMC free article] [PubMed] [Google Scholar]
- 7.Wietmarschen H.A., Dai W.D., Kooij A.J., Reijmers T.H., Schroen Y., Wang M., Xu Z.L., Wang X.C., Kong H.W., Xu G.W., et al. Characterization of Rheumatoid Arthritis Subtypes Using Symptom Profiles, Clinical Chemistry and Metabolomics Measurements. PLoS ONE. 2012;7:e44331. doi: 10.1371/journal.pone.0044331. [DOI] [PMC free article] [PubMed] [Google Scholar]
- 8.Wei Z.F., Jiao X.L., Wang T., Lu Q., Xia Y.F., Wang Z.T., Guo Q.L., Chou G.X., Dai Y. Norisoboldine alleviates joint destruction in rats with adjuvant-induced arthritis by reducing RANKL, IL-6, PGE (2), and MMP-13 expression. Acta Pharmacol. Sin. 2013;34:403–413. doi: 10.1038/aps.2012.187. [DOI] [PMC free article] [PubMed] [Google Scholar]
- 9.Shi M.Y., Li J.L., Lu X.M., Pu Y.Z. Research situation of Silkworm Excrement. Pharm. Clin. Chin. Mater. Med. 2013;4:57–60. [Google Scholar]
- 10.Shi W.J., Yang Y.F., Zhu S.R., Feng J.L., Yao J.L., Shen Y.H. Studies on Anti-inflammatory Effect and Analgesic Effect of Silkworm Shit. Asia-Pac. Trad. Med. 2013;9:44–46. [Google Scholar]
- 11.Brennan F.M., Mcinnes I.B. Evidence that cytokines play a role in rheumatoid arthritis. J. Clin. Investig. 2008;118:3537–3545. doi: 10.1172/JCI36389. [DOI] [PMC free article] [PubMed] [Google Scholar]
- 12.Smolen J.S., Redlich K., Zwerina J., Aletaha D., Steiner G., Schett G. Pro-inflammatory cytokines in rheumatoid arthritis. Clin. Rev. Allergy Immunol. 2005;28:239–248. doi: 10.1385/CRIAI:28:3:239. [DOI] [PubMed] [Google Scholar]
- 13.Gorman C.L., Cope A.P. Immune-mediated pathways in chronic inflammatory arthritis. Best Pract. Res. Clin. Rheumatol. 2008;22:221–238. doi: 10.1016/j.berh.2008.01.003. [DOI] [PubMed] [Google Scholar]
- 14.Joosten L.A., Helsen M.M., Saxne T., Heinegard D. IL-1αβ Blockade Prevents Cartilage and Bone Destruction in Murine Type II Collagen-Induced Arthritis, Whereas TNF-α Blockade Only Ameliorates Joint Inflammation. J. Immunol. 1999;163:5049–5055. [PubMed] [Google Scholar]
- 15.Karin M., Lin A. NF-κB at the crossroads of life and death. Nat. Immunol. 2002;3:221–227. doi: 10.1038/ni0302-221. [DOI] [PubMed] [Google Scholar]
- 16.Gu Y., Lu C., Zha Q., Kong H., Lu X., Lu A., Xu G. Plasma metabonomics study of rheumatoid arthritis and its Chinese medicine subtypes by using liquid chromatography and gas chromatography coupled with mass spectrometry. Mol. Biosyst. 2012;8:1535–1543. doi: 10.1039/c2mb25022e. [DOI] [PubMed] [Google Scholar]
- 17.Peng L.X., Chen L.H., Liu D.I. Plasma metabonomic study on Zushima Gancao Tablet in treatment of rheumatoid arthritis based on UPLC/LTQ-Orbitrap-MS. Chin. Trad. Herb. Drugs. 2017;48:1964–1970. [Google Scholar]
- 18.Mcmurray H.F., Parthasarathy S., Steinberg D. Oxidatively modified low density lipoprotein is a chemoattractant for human T lymphocytes. J. Clin. Investig. 1993;92:1004–1008. doi: 10.1172/JCI116605. [DOI] [PMC free article] [PubMed] [Google Scholar]
- 19.Yang C., Zheng Y.M., Dai M. Research progress on the pharmacological effects of nicotinamide. J. Clin. Pulm. Med. 2011;16:1914–1916. [Google Scholar]
- 20.Wang Z., Klipfell E., Bennett B.J., Koeth R., Levison B.S., DuGar B., Feldstein A.E., Britt E.B., Fu X., Wu Y.P., et al. Gut flora metabolism of phosphatidylcholine promotes cardiovascular disease. Nature. 2015;472:57–63. doi: 10.1038/nature09922. [DOI] [PMC free article] [PubMed] [Google Scholar]
- 21.Henderson B., Bitensky L., Chayen J. Glycolytic activity in human synovial lining cells in rheumatoid arthritis. Ann. Rheum. Dis. 1979;38:63–67. doi: 10.1136/ard.38.1.63. [DOI] [PMC free article] [PubMed] [Google Scholar]
- 22.Xiao Z.Y., Zheng Q.Y., Zhang J.P., Jiang Y.Y., Yi Y.H. Effect of esculentoside A on autoimmunity in mice and its possible mechanisms. Acta Pharmacol. Sin. 2002;23:638–644. [PubMed] [Google Scholar]
- 23.Valko M., Leibfritz D., Moncol J., Cronin M.T., Mazur M., Telser J. Free radicals and antioxidants in normal physiological functions and human disease. Int. J. Biochem. Cell Biol. 2007;39:44–84. doi: 10.1016/j.biocel.2006.07.001. [DOI] [PubMed] [Google Scholar]
- 24.Ramadan G., Al-Kahtani M.A., El-Sayed W.M. Anti-inflammatory and Anti-oxidant Properties of Curcuma longa, (Turmeric) Versus Zingiber officinale, (Ginger) Rhizomes in Rat Adjuvant-Induced Arthritis. Inflammation. 2011;34:291–301. doi: 10.1007/s10753-010-9278-0. [DOI] [PubMed] [Google Scholar]
- 25.Munn D.H., Shafizadeh E., Attwood J.T., Bondarev I., Pashine A., Mellor A.L. Inhibition of T cell proliferation by macrophage tryptophan catabolism. J. Exp. Med. 1999;189:1363–1372. doi: 10.1084/jem.189.9.1363. [DOI] [PMC free article] [PubMed] [Google Scholar]
- 26.Miossec P. Interleukin-17 in rheumatoid arthritis: If T cells were to contribute to inflammation and destruction through synergy. Arthritis Rheum. 2003;48:594–601. doi: 10.1002/art.10816. [DOI] [PubMed] [Google Scholar]
- 27.Ju X.D., Min D., Ao Y.F., Wang J.Q., Yu J.K., Cui G.Q., Hu Y.L. The protective effect of tetramethylpyrazine on cartilage explants and chondrocytes. J. Ethnopharmacol. 2010;132:414–420. doi: 10.1016/j.jep.2010.08.020. [DOI] [PubMed] [Google Scholar]
- 28.Lv Z.Q., Guo F.F. Endogenous metabolites—The role of leucine in the regulation of physiological function. Prog. Physiol. Sci. 2012;43:337–340. [PubMed] [Google Scholar]
- 29.Sale C., Saunders B., Harris R.C. Effect of β-alanine supplementation on muscle carnosine concentrations and exercise performance. Amino Acids. 2010;39:321–333. doi: 10.1007/s00726-009-0443-4. [DOI] [PubMed] [Google Scholar]
- 30.Snekhalatha U., Anburajan M., Venkatraman B., Menaka M. Evaluation of complete Freund’s adjuvant-induced arthritis in a Wistar rat model. Comparison of thermography and histopathology. Zeitschrift Für Rheumatologie. 2013;72:375–382. doi: 10.1007/s00393-012-1083-8. [DOI] [PubMed] [Google Scholar]
- 31.Mansky R.G., Wilson M., Fleischmann R., Olsen N., Silverfield J., Kempf P., Kivitz A., Sherrer Y., Pucino F., Csako G., et al. Comparison of Tripterygium wilfordii Hook F Versus Sulfasalazine in the Treatment of Rheumatoid Arthritis: A Randomized Trial. Ann. Intern. Med. 2009;151:229–240. doi: 10.7326/0003-4819-151-4-200908180-00005. [DOI] [PMC free article] [PubMed] [Google Scholar]
- 32.Liu S.M., Yan G.L., Liu C.F., Lu F. An Analysis Method for Eliminating the Exogenous Component Interference during the Metabolomic Data Processing. Feb 13, 2013. CN 102,930,182A.
- 33.Lenz E.M., Wilson I.D. Analytical strategies in metabonomics. J. Proteome Res. 2007;6:443–458. doi: 10.1021/pr0605217. [DOI] [PubMed] [Google Scholar]


