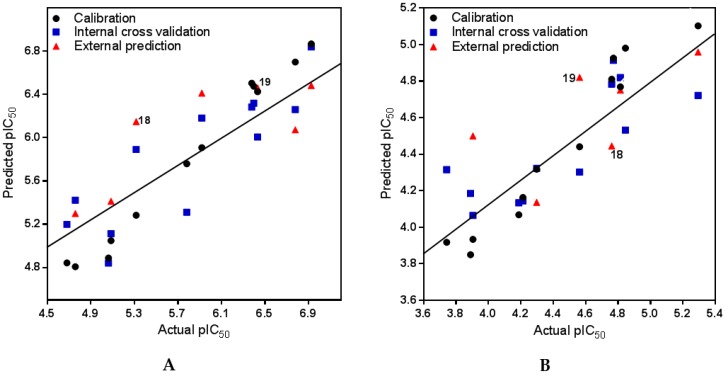
Figure 2.
Scatter plots of predicted versus actual activity of steroid alkaloids against Tbr (A) and L6 rat skeletal myoblasts (B). Data result from the partial least squares (PLS) models with a 3 (A) and a 2 (B) components and represent non-cross validated (black circles), internal predictions by leave-one-out (LOO) cross validation (blue squares) and test set predictions (red triangles). The positions of the Buxus alkaloids 18 and 19 (see Section 2.4) are marked. The trendlines are for the non-cross validated data. For numerical values of all compounds see Table S3, Supplementary Materials.

