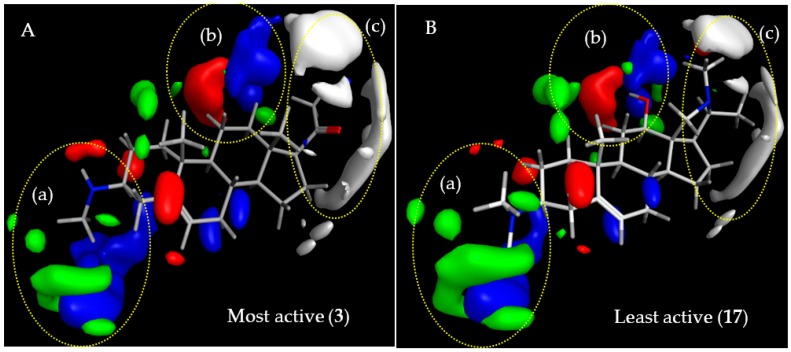
Figure 3.
Steric and electrostatic contour maps representing the comparative molecular field analysis (CoMFA) model for anti-Tbr activity. Compounds shown are the strongest (A; 3) and weakest (B; 17) trypanocides in the series. Green and white regions, respectively, indicate areas where steric interactions increase and decrease activity. Blue and red regions denote enhancing and detrimental electrostatic effects with the positively charged probe, respectively.

