

Abstract
Aim
Osteoprotegerin (OPG) is associated with a poor prognosis in patients with heart failure with preserved ejection fraction (HFpEF). OPG has also been associated with fibrosis and collagen cross-linking, which increase arterial and left ventricle (LV) myocardial stiffness. Little is known about the relation of OPG and LV structure and function in African-Americans who are disproportionately affected by HFpEF.
Methods and results
Our analysis included 1172 participants with preserved LV ejection fraction (>50%) from the African-American cohort in the Genetic Epidemiology Network of Arteriopathy Study (mean age 63 years, 72% female). We used diastolic wall strain indicator measured by echocardiography to assess LV myocardial stiffness. Diastolic wall strain was calculated as (LV posterior thickness at end-systole – LV posterior thickness at end-diastole)/LV posterior thickness at end-systole. Associations between OPG levels and indices of arterial and LV structure and function were evaluated by using generalized linear mixed models and adjusted for possible confounders. OPG levels were correlated with age, female sex, presence of hypertension and diabetes, and lower estimated glomerular filtration rate (P < 0.05 for all). Multivariable analysis revealed that higher OPG levels were associated with greater LV mass index, increased LV myocardial stiffness, and higher N-terminal prohormone brain natriuretic peptide levels (P < 0.05 for all).
Conclusion
In African-Americans, higher OPG levels were associated with characteristics common in patients with HFpEF and were significantly associated with known precursors to HFpEF. These findings indicate a potential role for OPG in the pathophysiology of HFpEF in African-Americans.
Keywords: African-Americans, diastolic dysfunction, myocardial stiffness, osteoprotegerin
Introduction
The prevalence of heart failure with preserved ejection fraction (HFpEF) has increased by 50% over the past two decades and almost half of patients with heart failure have preserved ejection fraction.1,2 Although pharmacological and nonpharmacological therapies have significantly improved survival for patients with heart failure with reduced ejection fraction (HFrEF), therapeutic options for HFpEF patients have not similarly improved outcomes.2 Identifying effective therapies for HFpEF requires a better understanding of the pathophysiology of this condition. Hypertrophy of the left ventricle (LV) and increased LV myocardial stiffness play important roles in the development of HFpEF.3,4 LV myocardial stiffness increases in hypertensive HFpEF patients compared with hypertensive patients without heart failure despite having similar LV mass index.4 Although these findings suggest that LV myocardial stiffness may be an important factor linking LV hypertrophy and HFpEF, the mechanisms responsible for increased myocardial stiffness in patients with HFpEF are uncertain.
Osteoprotegerin (OPG) is a 60-kDa cytokine in the tumor necrosis factor receptor superfamily, which was originally implicated in bone metabolism as a factor inhibiting catabolism.5,6 Of interest, higher OPG levels have been associated with poorer prognoses in patients with HFpEF.7,8 However, the mechanisms of this relationship have not been fully elucidated. OPG levels are also associated with LV hypertrophy.9 In experimental studies, higher OPG levels were associated with vascular and LV fibrosis.10,11 Increased interstitial fibrosis contributes to increase in both arterial and LV myocardial stiffness that are closely linked through ventricular-arterial coupling.12 Thus, we hypothesized that increased serum OPG levels may be associated with ventricular-arterial stiffening and deterioration of LV diastolic function.
African-Americans are reported to have a higher prevalence of HFpEF as well as a worse long-term prognosis compared with whites with HFpEF.13,14 However, LV myocardial stiffness has not been adequately studied in African-Americans. Hence, the objective of this study was to investigate the relationships between serum OPG concentration levels and arterial and LV structure and function in the Jackson Cohort of the well-characterized Genetic Epidemiology Network of Arteriopathy (GENOA).
Methods
Study population
The current study was approved by the Institutional Review Board of the University of Mississippi Medical Center and all participants gave informed consent. The study population for this investigation consisted of participants from the Jackson, Mississippi cohort of the GEN-OA study, as reported in detail previously.15 Briefly, two GENOA cohorts were originally ascertained (1995–2000) through sibships, in which at least two siblings had essential hypertension diagnosed prior to age 60 years. All siblings in the sibships were invited to participate in this study, regardless of the status of hypertension. These included African-Americans from Jackson, Mississippi (n = 1854 at the first exam). Of the Jackson Cohort who returned for the second exam (n = 1518), we excluded the following participants from the current study: participants who did not have OPG concentrations measured (194), participants who had LV ejection fraction less than 50% (78), participants whose LV ejection fraction was not measured (380), participants who had LV wall motion abnormalities (34), and participants whose wall motion was not evaluated (2). The remaining 1172 participants were included in the study.
Laboratory measurements
At the second exam, blood was collected by venipuncture after an overnight fast and processed by using standardized method. Blood was centrifuged for 10 min at 4 °C, aliquoted in 0.5–1.0 ml volumes of plasma and serum, and stored at −80 °C within 2 h after the venipuncture. Aliquots of frozen blood samples were shipped to Rochester, Minnesota on dry ice. OPG levels were measured in duplicate by using the Meso Scale Discovery immunoassay platform (Gaithersburg, Maryland, USA) as previously described.16 Intra-assay coefficients of variation were 4.0% at 133 pg/ml and 2.5% at 180 pg/ml and inter-assay coefficients of variation were 13.3% at 149 pg/ml and 11.3% at 189 pg/ml.16 N-terminal prohormone brain natriuretic peptide (NT pro-BNP) concentration levels were assessed by using ELISA (SearchLight, Pierce Endogen, Boston, Massachusetts, USA) as previously described.16 Serum creatinine levels were measured by standard enzymatic methods and estimated glomerular filtration rate (eGFR) was calculated.17,18
Definition of comorbidities
Essentialhypertension was defined as first, the average of the second and third SBP readings at least 140 mmHg, or second, the average of the second and third DBP readings at least 90 mmHg, or third, previous diagnosis of hypertension and antihypertensive medication prescribed by a physician to be taken daily during the last month. Diabetes was defined as present if a participant was receiving treatment with insulin, oral agents, or had fasting serum glucose levels at least 126 mg/dl. Coronary artery disease (CAD) was defined as present if a participant had undergone coronary arteriography before and had a narrowing of or obstruction of a coronary artery or had a past history of myocardial infarction.
Echocardiography
In the GENOA Study, standardized echocardiography methods with training and certification were used by field-center technicians to achieve high-quality recordings and analyses. Readings were performed at the echocardiography reading center at New York Presbyterian Hospital–Weill Cornell Medical Center and they were verified by a single, highly experienced investigator under masked conditions of other clinical information. Echocardiographic data were recorded on a videocassette and sent to the reading center, in which measurements were made by using a computerized review station equipped with digitizing tablet and monitor screen overlay for calibration and performance of each measurement. LV internal dimension and interventricular septal and posterior wall thicknesses were measured at end-diastole and end-systole on a two-dimensional image in three cardiac cycles according to the recommendations of the American Society of Echocardiography.19 Calculations of LV mass were made using the following equation as recommended by American Society of Echocardiography19: LV mass index (g/m2.7) = (0.8 × {1.04 × [(LVDd +IVSd +PWd)3 − (LVDd)3]} +0.6)/height2.7, where LVDd is the LV diastolic dimension, IVSd is the interventricular septum thickness at end-diastole, and PWd is posterior wall thickness at end-diastole. Relative wall thickness (RWT) was calculated as 2 × (PWd)/LVDd. LV end-diastolic volume, LV end-systolic volume, stroke volume (SV), and LV ejection fraction were calculated from LV diastolic and systolic diameters by using Teichholz method. Peak early mitral E wave velocity, late mitral A wave velocity, the ratio of E wave velocity over A wave velocity (E/A), and deceleration time of E wave velocity were measured from the transmitral pulsed Doppler wave profile. Isovolumic relaxation time (IVRT) was measured as the time from aortic valve closure to the onset of LV inflow. Left atrial diameter at end-systole was measured on two-dimensional image and indexed by body surface area.
Arterial stiffness indicators
Systemic arterial compliance was defined as SV/pulse pressure.20 Effective arterial elastance was calculated as end-systolic pressure (0.9 × SBP)/SV.21
Left ventricle myocardial stiffness indicators
Diastolic wall strain (DWS) is a recently developed indicator of LV myocardial stiffness.22 DWS was calculated as (PWs – PWd)/PWs, where PWs is posterior wall thickness at end-systole. DWS can be calculated easily and noninvasively from indices routinely evaluated during echocardiographic imaging, making LV myocardial stiffness easy to assess in a large cohort.
Statistical analysis
Results are expressed as mean ±SD or proportions unless otherwise specified. The associations between OPG concentration levels and several background characteristics were evaluated by using unadjusted generalized linear mixed models (GLMM) to account for covariance among sibships. To examine the relations between OPG levels and LV structure, function, and NT pro-BNP levels, GLMM analyses were performed. In these analyses, we rescaled OPG concentration levels to be per one SD change in OPG.
Scatter plots between OPG levels and LV mass index and between OPG levels and DWS were structured. In addition to unadjusted models, two models were constructed: Model 1, adjusted for age and sex; Model 2 used Model 1 adjustments and past history of hypertension, diabetes, coronary heart disease, current smoking status, and eGFR. All statistical analyses were performed by using SAS version 9.4 (SAS Institute, Cary, North Carolina, USA).
Results
Baseline characteristics
Baseline characteristics of the study participants are presented in Table 1. Briefly, the study population was composed of 1172 participants following exclusions. Of these, the mean age was 63 years, a majority were women (72%), most were hypertensive (89%), almost one-third were diabetic (28%), and some were current smokers (14%). Serum OPG levels were significantly correlated with older age, female sex, past history of hypertension and diabetes, and lower eGFR (all P <0.01). These results indicate that higher OPG levels were associated with multiple characteristics also common in patients with HFpEF.
Table 1.
Characteristics of study population, including unadjusted association with osteoprotegerin
| Variables | Study population, N = 1172 | Estimate* | P value* |
|---|---|---|---|
| Osteoprotegerin (pg/ml) | 335 (140) | – | – |
| Age (years) | 63 (9) | 0.0190 | <0.001 |
| Female sex, n (%) | 848 (72) | 0.0676 | 0.009 |
| BMI (kg/m2) | 31 (7) | −0.0002 | 0.942 |
| SBP (mmHg) | 139 (21) | 0.0046 | <0.001 |
| DBP (mmHg) | 79 (11) | −0.0013 | 0.208 |
| Heart rate (bpm) | 67 (11) | 0.0009 | 0.441 |
| Hypertension, n (%) | 923 (79) | 0.1151 | <0.001 |
| Diabetes, n (%) | 327 (28) | 0.1177 | <0.001 |
| Coronary artery disease, n (%) | 57 (5) | 0.0656 | 0.230 |
| Stroke, n (%) | 62 (5.3) | 0.0345 | 0.462 |
| COPD, n (%) | 17 (1.5) | 0.1491 | 0.143 |
| PAD, n (%) | 127 (11.0) | 0.2106 | <.001 |
| Current smoker, n (%) | 159 (14) | 0.0210 | 0.554 |
| Estimated GFR (ml/min) | 89 (17) | −0.0075 | <0.001 |
Estimate is for log-transformed OPG and was not back-transformed to show direction of association. Data shown as mean (SD) unless otherwise indicated. BP, blood pressure; COPD, chronic obstructive lung disease; GFR, glomerular filtration rate; GLMM, generalized linear mixed models; OPG, osteoprotegerin; PAD, peripheral artery disease.
Unadjusted GLMM used to account for correlation among family members.
Osteoprotegerin and arterial stiffness indicators
Table 2 shows the unadjusted and adjusted Model 1 and Model 2 GLMM regression between OPG levels and arterial stiffness indicators. In all the models, SD increase by one in OPG was significantly associated with a decrease in systemic arterial compliance and an increase in effective arterial elastance (P <0.01 for both). Thus, OPG was independently and positively associated with arterial stiffness indicators.
Table 2.
Unadjusted and adjusted associations between osteoprotegerin and indicators of aortic stiffness
| Unadjusted | Model 1 | Model 2 | |||||
|---|---|---|---|---|---|---|---|
|
|
|
|
|||||
| Outcome | Median (25th, 75th ranges) | Coefficienta (95% CI) | P value | Coefficienta (95% CI) | P value | Coefficienta (95% CI) | P value |
| SAC (ml/mmHg) | 1.35 (1.07, 1.65) | −0.119 (−0.144, −0.094) | <0.001 | −0.064 (−0.086, −0.041) | <0.001 | −0.061 (0.086,0.036) | <0.001 |
| Ea (mmHg/ml) | 1.62 (1.41, 1.86) | 0.056 (0.034, 0.078) | <0.001 | 0.032 (0.011,0.054) | 0.003 | 0.037 (0.014, 0.059) | 0.001 |
All models account for correlation among family members; Model 1, adjusted for age and sex; Model 2, adjusted for age, sex, history of hypertension, diabetes, coronary heart disease, current smoking status, and estimated glomerular filtration rate; CI, confidence interval; Ea, effective arterial elastance; OPG, osteoprotegerin; SAC, systemic arterial compliance.
Represents a one SD change in OPG and the unit change in the corresponding outcome.
Osteoprotegerin and left ventricle structure, function, and N-terminal prohormone brain natriuretic peptide
Figure 1 shows the scatter plot between OPG levels and LV mass index (Fig. 1a) and DWS (Fig. 1b). LV mass index demonstrated a weak but significant positive correlation with OPG (ρ = 0.20, P <0.01). DWS demonstrated a weak but negative correlation with OPG (ρ = −0.22, P <0.01).
Fig. 1.

Unadjusted correlation between osteoprotegerin concentrations and left ventricle mass index (a), and diastolic wall strain (b). Left ventricle mass index demonstrated a weak but significant positive correlation with osteoprotegerin, while diastolic wall strain demonstrated a weak and negative correlation with osteoprotegerin. DWS, diastolic wall strain; OPG, osteoprotegerin.
Table 3 shows the unadjusted and adjusted Model 1 and Model 2 GLMM regression results. In the unadjusted analysis, a SD increase by one in OPG was significantly associated with an increase in LV mass index, RWT, deceleration time, IVRT, left atrial dimension index, and NT pro-BNP (all P <0.01). Conversely, OPG was associated with a decrease in E/A ratio and DWS (both P <0.01). OPG was not significantly associated with LV ejection fraction. After adjusting for age and sex (Model 1), OPG continued to be significantly associated with LV mass index, delayed deceleration time, DWS, and NT pro-BNP (all P <0.01). In the final Model 2 analysis, adjusting for all covariates of interest (age, sex, history of hypertension, diabetes, coronary artery disease, current smoking, and eGFR), an increase in OPG remained significantly associated with greater LV mass index, prolonged deceleration time, decreased DWS, and elevated NT pro-BNP levels (Fig. 2) (P <0.05). These results indicate that higher OPG levels are associated with more severe LV hypertrophy, increased LV myocardial stiffness, and higher heart failure biomarker levels even after adjustment for possible confounding factors.
Table 3.
Unadjusted and adjusted associations between osteoprotegerin and markers of cardiac structure and function
| Unadjusted | Model 1 | Model 2 | |||||
|---|---|---|---|---|---|---|---|
|
|
|
|
|||||
| Outcome | Median (25th, 75th range) | Coefficienta (95% CI) | P value | Coefficienta (95% CI) | P value | Coefficienta (95% CI) | P value |
| LVDd (cm) | 5.0 (4.8, 5.4) | 0.003 (−0.025, 0.032) | 0.822 | 0.027 (−0.001, 0.054) | 0.061 | 0.015 (−0.014, 0.044) | 0.308 |
| IVSd (cm) | 0.9 (0.8, 1.0) | 0.018 (0.010, 0.027) | <0.001 | 0.009 (−0.000, 0.018) | 0.052 | 0.002 (−0.007, 0.011) | 0.689 |
| LVPWd (cm) | 0.8 (0.7, 0.9) | 0.018 (0.010, 0.026) | <0.001 | 0.011 (0.003, 0.019) | 0.010 | 0.004 (−0.004, 0.012) | 0.342 |
| LVPWs (cm) | 1.3 (1.2, 1.3) | 0.010 (0.003, 0.018) | 0.005 | 0.004 (−0.003, 0.011) | 0.291 | −0.003 (−0.011, 0.005) | 0.457 |
| LVMI (g/m2.7) | 37.1 (31.7, 44.1) | 1.92 (1.23, 2.62) | <0.001 | 1.29 (0.55, 2.04) | 0.001 | 0.819 (0.043, 1.596) | 0.039 |
| RWT | 0.32 (0.29, 0.35) | 0.007 (0.004, 0.010) | <0.001 | 0.003 (−0.001, 0.006) | 0.112 | 0.001 (−0.003, 0.004) | 0.696 |
| LVEF (%) | 62.1 (58.0, 65.9) | 0.258 (−0.09, 0.606) | 0.147 | −0.215 (−0.554, 0.124) | 0.215 | −0.177 (−0.524, 0.170) | 0.318 |
| E/A | 1.05 (0.83, 1.28) | −0.064 (−0.085, −0.044) | <0.001 | −0.020 (−0.041, 0.001) | 0.059 | −0.012 (−0.034, 0.009) | 0.264 |
| DT (ms) | 169 (147, 196) | 7.07 (4.40, 9.73) | <0.001 | 3.91 (1.15, 6.68) | 0.006 | 3.79 (0.79, 6.80) | 0.014 |
| IVRT (ms) | 90 (83, 104) | 1.82 (0.64, 3.00) | 0.003 | 0.936 (−0.452, 2.325) | 0.187 | 0.828 (−0.543, 2.199) | 0.237 |
| DWS | 0.36 (0.31, 0.38) | −0.009 (−0.013, −0.006) | <0.001 | −0.006 (−0.010, −0.002) | 0.001 | −0.004 (−0.008, −0.001) | 0.023 |
| LADI (cm/m2) | 50.9 (46.1, 55.7) | 0.993 (0.483, 1.503) | <0.001 | 0.349 (−0.193, 0.891) | 0.208 | 0.383 (−0.184, 0.949) | 0.186 |
| NTBNP (pg/ml) | 87.6 (57.4, 129.8) | 0.232 (0.163, 0.300) | <0.001 | 0.143 (0.063, 0.224) | 0.001 | 0.116 (0.042, 0.191) | 0.002 |
All models account for correlation among family members; Model 1, adjusted for age and sex; Model 2, adjusted for age, sex, past history of hypertension, diabetes, coronary heart disease, current smoking status, and estimated glomerular filtration rate; CI, confidence interval; DT, deceleration time of early transmitral inflow; DWS, diastolic wall strain; IVRT, isovolumic relaxation time; LADI, left atrium diameter index; LVMI, left ventricular mass index; NTBNP, N-terminal prohormone brain natriuretic peptide; OPG, osteoprotegerin; RWT, relative wall thickness.
Represents a one SD change in OPG and the unit change in the corresponding outcome.
Fig 2.
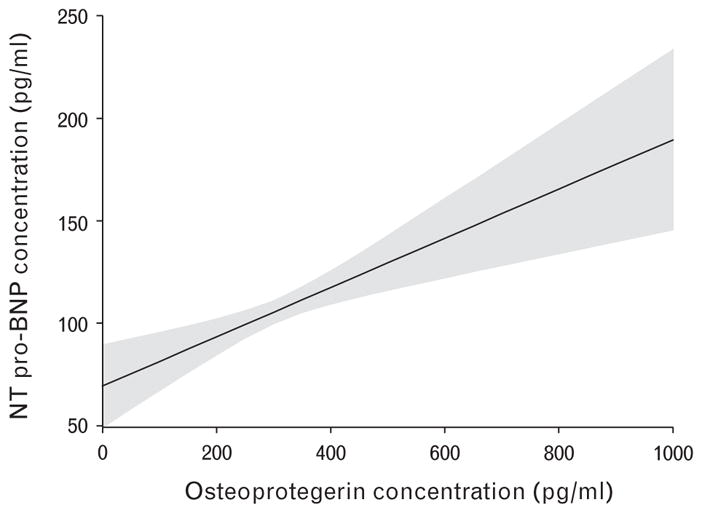
Adjusted correlation between osteoprotegerin concentrations and N-terminal prohormone brain natriuretic peptide concentrations. Marginal effect of osteoprotegerin concentration levels on N-terminal prohormone brain natriuretic peptide concentration levels with a point-wise 95% confidence interval, from a linear regression Model 2. BNP, brain natriuretic peptide; OPG, osteoprotegerin.
Discussion
The goal of this study was to determine whether OPG is associated with arterial and LV stiffening and diastolic dysfunction in African-Americans who are disproportionately affected by HFpEF. The main findings of this study were that higher OPG concentration levels were associated with underlying characteristics consistent with HFpEF. Higher serum OPG concentration levels were associated with increased arterial stiffness, greater LV hypertrophy, increased LV stiffness (indicated by DWS), and higher NT pro-BNP levels, even after adjusting for possible confounders. These findings provide important new information that OPG may play an important role in the pathophysiology of HFpEF and also may be useful in linking OPG as a biomarker of risk for the development of HFpEF in African-Americans.
Blood OPG levels have been linked with acute heart failure.7,8,23–26 It has been reported that in acute heart failure patients with HFpEF or HFrEF, serum OPG concentration levels were associated with a higher long-term mortality or readmission for acute heart failure within 6 months independently of conventional risk factors.8 Those risk factors included age, diabetes, ischemic heart failure, LV systolic function, New York Heart Association functional class, eGFR, and serum BNP or C-reactive protein at discharge.8 In that study, patients with higher OPG levels more frequently had preserved ejection fraction and higher BNP levels compared with those with lower OPG levels. OPG levels were significantly associated with a poorer prognosis only in the HFpEF patients after stratification into each heart failure category. Although they showed a relationship between OPG levels and prognosis in HFpEF patients, no mechanistic links were evaluated. In another investigation, higher OPG levels were also associated with a poor prognosis in HFpEF patients7; however, this study also lacked mechanistic links. Our study builds on these studies by showing that higher serum OPG levels were associated with greater LV mass index, increased arterial and LV myocardial stiffness, and higher NT pro-BNP levels. In an additional study, HFpEF patients with increased LV myocardial stiffness had poor prognoses.27 The results of our study raise the possibility that OPG-mediated arterial and myocardial stiffening may play a significant role in the poorer prognosis in patients with higher OPG levels.
OPG levels were associated with arterial load and stiffness indicators in this study. OPG is reported to increase the expression of intercellular adhesion molecule-1, vascular cell adhesion molecule-1, and E-selectin by endothelial cells and plays a role in endothelial cell survival and neovascularization.28 In a microscopy study, OPG expression was correlated with the abundance of macrophages in lesions.29,30 Recombinant OPG promoted vascular smooth muscle cells proliferation in both rodent cells and humans.31,32 Thus, there is accumulating evidence that OPG may be a proatherogenic mediator and atherosclerosis plays a role in arterial stiffening.33 Moreover, in vascular smooth muscle cells, OPG treatment induced vascular fibrosis.10 Vascular fibrosis has also been associated with arterial stiffening.34 Ventricular-arterial stiffening is thought to play an important role in pathogenesis of HFpEF. Therefore, our finding that OPG was associated with arterial stiffness as well as LV myocardial stiffness supports the relationship between OPG and HFpEF.
OPG was associated with increased LV myocardial stiffness (DWS) and increased biomarker levels of heart failure (NT pro-BNP) after adjustment for possible confounding factors in this study. DWS correlates with the LV myocardial stiffness indicator made by hemodynamic assessment in animal models.22 Of note, DWS associates with adverse prognoses in patients with HFpEF whereas the E/e′ ratio, an indicator central to diastolic evaluation and used to estimate LV filling pressure, was not associated with prognosis after adjustment for age and sex.27 There are two evolving ideas about the relationships between OPG and LV myocardial stiffness and also increased NT pro-BNP: first, LV myocardial stiffness is increased through ventricular-arterial coupling and second, OPG might be directly associated with fibrosis, which contributes to LV myocardial stiffness.10,11 Increased myocardial stiffness is an important determinant of the BNP concentration in patients with HFpEF.35
OPG levels were also associated with deceleration time in this study. Deceleration time is influenced by LV relaxation, LV diastolic pressures following mitral valve opening, and LV chamber stiffness.36,37 LV end-diastolic pressure cannot be estimated from only transmitral inflow indices (such as deceleration time) in those with preserved LV ejection fraction.38 Although we cannot explain the mechanisms of this association, increased OPG may be associated with impaired LV relaxation or LV elastic recoil, as higher OPG levels were associated with greater LV mass index, LV stiffening, and BNP elevation in these conditions. Usually, LV relaxation or LV elastic recoil is impaired.1,39,40
In this study, OPG levels were associated with characteristics common in HFpEF patients: older age and female sex have been reported to be associated with higher arterial and ventricular stiffness that contribute to the higher prevalence of HFpEF in these groups.41 Hypertension is also a well-known contributor to the development of HFpEF.42 Diabetes has been reported to be more frequent in HFpEF than HFrEF43 and its associations with arterial and ventricular stiffening have been described previously.44 Renal dysfunction is also highly prevalent in HFpEF.45 All of these clinical characteristics were associated with higher OPG levels. Hence, our findings showed that participants with higher serum OPG levels had similar characteristics to patients with HFpEF: similar background characteristics and risk factors, LV hypertrophy, and increased arterial and LV myocardial stiffness.
OPG has been associated with CAD as well as collagen production.46,47 Thus, there is a possibility that CAD might mediate the results. However, the prevalence of CAD was very low (5%) in this population and we excluded those with LV regional wall motion abnormalities. Furthermore, in the multivariable linear regression analysis, even after adjustment for history of CAD, OPG levels were significantly associated with LV mass index, DWS, and NT pro-BNP levels. Therefore, our findings suggest that the relationships between OPG levels and LV mass index, DWS, and NT pro-BNP were independent of CAD.
The current investigation has a number of strengths. First, this study was performed in African-Americans and contributed important information regarding myocardial stiffness in African-Americans who are disproportionately affected by cardiovascular disease and particularly HFpEF.13,14 Another strength of this study is that we used a direct indicator of LV myocardial stiffness rather than indirect measures of diastolic filling. The echocardiographic indices that estimate LV diastolic filling have limitations, including dependency on volume status.48 Furthermore, to the best of our knowledge, this is the first study to investigate the relationship between serum OPG levels and LV myocardial stiffness in humans.
One potential limitation of our study is that we did not have clinical information about heart failure symptoms or outcomes, so we could not directly demonstrate the relationship between OPG levels and HFpEF status. Therefore, we have to consider the possibility that those with higher OPG levels may develop HFrEF as well as HFpEF. However, the results of our study revealed OPG levels were not associated with LV systolic function. A recently published study revealed a high frequency of HFpEF (73% of all heart failure) among African-Americans living in Jackson, Mississippi, where the current study was performed.13 Furthermore, it has been reported that among consecutively registered African-Americans with heart failure but without CAD, those with HFrEF and eccentric LV hypertrophy were younger, more frequently male, and had a shorter duration of hypertension as compared with those with HFpEF and concentric LV hypertrophy.49 These findings appear to be in contrast to the classic paradigm of hypertensive heart disease, in which sequential evolution from concentric to eccentric hypertrophy was described. Thus, although we cannot completely deny the possibility that those with higher OPG levels may develop HFrEF, we speculate that those with higher OPG levels are more likely to develop HFpEF rather than HFrEF based on the known links to the observed clinical and echocardiographic characteristics. Another potential limitation of this study is that tissue Doppler imaging and LV myocardial strain by using speckle tracking imaging was not available in this study. Current echocardiographic guidelines recommend using several techniques to assess diastolic function comprehensively. On the contrary, few cohort studies have both measures of OPG and advanced assessment of diastolic function available. Last, the majority of participants were women (72%) and the mean BMI was greater than 30 kg/m2. It has been reported that the prevalence of HFpEF is higher among women than men.50 Also, obesity is one of the emerging risk factors for HFpEF.51 Thus, the characteristics of our study participants may be representative of patients with risk factors for HFpEF.
Conclusion
In a community-based cohort of African-Americans who were disproportionately affected by HFpEF, higher OPG concentration levels were associated with underlying characteristics consistent with HFpEF. Higher serum OPG levels independently associated with greater LV mass index, increased LV myocardial stiffness, and increased NT pro-BNP levels indicated that OPG may play an important role in the development of precursors to HFpEF.
Future studies that examine the potential influence of race differences on the relationships between OPG levels and cardiac structure and function will provide additional knowledge regarding the ability of OPG to serve as an early indicator of risk factors for HFpEF. Both human and animal studies evaluating the mechanistic connections between OPG and LV hypertrophy and wall stress are also warranted. Additional prospective studies will be required to better assess the association between OPG levels and the incidence of cardiovascular events including HFpEF.
Acknowledgments
We would like to thank the families that participated in the GENOA Study. This work was supported in part by grants U01-HL054463 (THM) from the National Institutes of Health and M01-RR000585 (I.J.K.) from the Mayo Clinic’s Center for Translational Science Activities and the Mayo Clinic. M.E.H. is supported by 1K08DK099415 and P20GM104357 from the National Institutes of Health.
Footnotes
Authors’ contribution: D.K. and M.E.H. designed the study. I.J.K., K.R.B. and T.H.M. collected the data. D.K. and M.E.H. with T.S., M.L.L., M.D.W., K.R.B., T.H.M. interpreted the data. D.K., T.S., and M.E.H. wrote the article with critical advises from A.L.F., M.E.G., I.J.K., M.L.L., M.D.W., K.R.B. and T.H.M.
Conflicts of interest
There are no conflicts of interest.
References
- 1.Redfield MM, Jacobsen SJ, Burnett JC, Jr, Mahoney DW, Bailey KR, Rodeheffer RJ. Burden of systolic and diastolic ventricular dysfunction in the community: appreciating the scope of the heart failure epidemic. JAMA. 2003;289:194–202. doi: 10.1001/jama.289.2.194. [DOI] [PubMed] [Google Scholar]
- 2.Owan TE, Hodge DO, Herges RM, Jacobsen SJ, Roger VL, Redfield MM. Trends in prevalence and outcome of heart failure with preserved ejection fraction. N Engl J Med. 2006;355:251–259. doi: 10.1056/NEJMoa052256. [DOI] [PubMed] [Google Scholar]
- 3.Zile MR, Gottdiener JS, Hetzel SJ, et al. Prevalence and significance of alterations in cardiac structure and function in patients with heart failure and a preserved ejection fraction. Circulation. 2011;124:2491–2501. doi: 10.1161/CIRCULATIONAHA.110.011031. [DOI] [PubMed] [Google Scholar]
- 4.Zile MR, Baicu CF, Ikonomidis JS, et al. Myocardial stiffness in patients with heart failure and a preserved ejection fraction: contributions of collagen and titin. Circulation. 2015;131:1247–1259. doi: 10.1161/CIRCULATIONAHA.114.013215. [DOI] [PMC free article] [PubMed] [Google Scholar]
- 5.Baud’huin M, Duplomb L, Teletchea S, et al. Osteoprotegerin: multiple partners for multiple functions. Cytokine Growth Factor Rev. 2013;24:401–409. doi: 10.1016/j.cytogfr.2013.06.001. [DOI] [PubMed] [Google Scholar]
- 6.Perez de Ciriza C, Lawrie A, Varo N. Osteoprotegerin in cardiometabolic disorders. Int J Endocrinol. 2015;2015:564934. doi: 10.1155/2015/564934. [DOI] [PMC free article] [PubMed] [Google Scholar]
- 7.Aramburu-Bodas O, Garcia-Casado B, Salamanca-Bautista P, et al. Relationship between osteoprotegerin and mortality in decompensated heart failure with preserved ejection fraction. J Cardiovasc Med (Hagerstown) 2015;16:438–443. doi: 10.2459/JCM.0000000000000229. [DOI] [PubMed] [Google Scholar]
- 8.Frioes F, Laszczynska O, Almeida PB, et al. Prognostic value of osteoprotegerin in acute heart failure. Can J Cardiol. 2015;31:1266–1271. doi: 10.1016/j.cjca.2015.04.003. [DOI] [PubMed] [Google Scholar]
- 9.Coutinho T, Al-Omari M, Mosley TH, Jr, Kullo IJ. Biomarkers of left ventricular hypertrophy and remodeling in blacks. Hypertension. 2011;58:920–925. doi: 10.1161/HYPERTENSIONAHA.111.178095. [DOI] [PMC free article] [PubMed] [Google Scholar]
- 10.Toffoli B, Pickering RJ, Tsorotes D, et al. Osteoprotegerin promotes vascular fibrosis via a TGF-beta1 autocrine loop. Atherosclerosis. 2011;218:61–68. doi: 10.1016/j.atherosclerosis.2011.05.019. [DOI] [PubMed] [Google Scholar]
- 11.Tsuruda T, Sekita-Hatakeyama Y, Hao Y, et al. Angiotensin II stimulation of cardiac hypertrophy and functional decompensation in osteoprotegerin-deficient mice. Hypertension. 2016;67:848–856. doi: 10.1161/HYPERTENSIONAHA.115.06689. [DOI] [PubMed] [Google Scholar]
- 12.Yamamoto K, Masuyama T, Sakata Y, et al. Myocardial stiffness is determined by ventricular fibrosis, but not by compensatory or excessive hypertrophy in hypertensive heart. Cardiovasc Res. 2002;55:76–82. doi: 10.1016/s0008-6363(02)00341-3. [DOI] [PubMed] [Google Scholar]
- 13.Gupta DK, Shah AM, Castagno D, et al. Heart failure with preserved ejection fraction in African Americans: The ARIC (Atherosclerosis Risk in Communities) study. JACC Heart Fail. 2013;1:156–163. doi: 10.1016/j.jchf.2013.01.003. [DOI] [PMC free article] [PubMed] [Google Scholar]
- 14.East MA, Peterson ED, Shaw LK, Gattis WA, O’Connor CM. Racial differences in the outcomes of patients with diastolic heart failure. Am Heart J. 2004;148:151–156. doi: 10.1016/j.ahj.2004.01.017. [DOI] [PubMed] [Google Scholar]
- 15.O’Meara JG, Kardia SL, Armon JJ, Brown CA, Boerwinkle E, Turner ST. Ethnic and sex differences in the prevalence, treatment, and control of dyslipidemia among hypertensive adults in the GENOA study. Arch Intern Med. 2004;164:1313–1318. doi: 10.1001/archinte.164.12.1313. [DOI] [PubMed] [Google Scholar]
- 16.Kim CX, Bailey KR, Klee GG, et al. Sex and ethnic differences in 47 candidate proteomic markers of cardiovascular disease: the Mayo Clinic proteomic markers of arteriosclerosis study. PLoS One. 2010;5:e9065. doi: 10.1371/journal.pone.0009065. [DOI] [PMC free article] [PubMed] [Google Scholar]
- 17.Rule AD, Larson TS, Bergstralh EJ, Slezak JM, Jacobsen SJ, Cosio FG. Using serum creatinine to estimate glomerular filtration rate: accuracy in good health and in chronic kidney disease. Ann Intern Med. 2004;141:929–937. doi: 10.7326/0003-4819-141-12-200412210-00009. [DOI] [PubMed] [Google Scholar]
- 18.Rigalleau V, Lasseur C, Raffaitin C, et al. The Mayo Clinic quadratic equation improves the prediction of glomerular filtration rate in diabetic subjects. Nephrol Dial Transplant. 2007;22:813–818. doi: 10.1093/ndt/gfl649. [DOI] [PubMed] [Google Scholar]
- 19.Lang RM, Bierig M, Devereux RB, et al. Recommendations for chamber quantification: a report from the American Society of Echocardiography’s Guidelines and Standards Committee and the Chamber Quantification Writing Group, developed in conjunction with the European Association of Echocardiography, a branch of the European Society of Cardiology. J Am Soc Echocardiogr. 2005;18:1440–1463. doi: 10.1016/j.echo.2005.10.005. [DOI] [PubMed] [Google Scholar]
- 20.Otsuki T, Maeda S, Iemitsu M, et al. Systemic arterial compliance, systemic vascular resistance, and effective arterial elastance during exercise in endurance-trained men. Am J Physiol Regul Integr Comp Physiol. 2008;295:R228–R235. doi: 10.1152/ajpregu.00009.2008. [DOI] [PubMed] [Google Scholar]
- 21.Argulian E, Agarwal V, Makani H, Herzog E, Chaudhry FA. Association of exercise tolerance with effective arterial elastance obtained noninvasively in patients with exertional dyspnea. J Am Soc Echocardiogr. 2014;27:675–679. doi: 10.1016/j.echo.2014.01.023. [DOI] [PubMed] [Google Scholar]
- 22.Takeda Y, Sakata Y, Higashimori M, et al. Noninvasive assessment of wall distensibility with the evaluation of diastolic epicardial movement. J Card Fail. 2009;15:68–77. doi: 10.1016/j.cardfail.2008.09.004. [DOI] [PubMed] [Google Scholar]
- 23.Omland T, Drazner MH, Ueland T, et al. Plasma osteoprotegerin levels in the general population: relation to indices of left ventricular structure and function. Hypertension. 2007;49:1392–1398. doi: 10.1161/HYPERTENSIONAHA.107.087742. [DOI] [PubMed] [Google Scholar]
- 24.Omland T, Ueland T, Jansson AM, et al. Circulating osteoprotegerin levels and long-term prognosis in patients with acute coronary syndromes. J Am Coll Cardiol. 2008;51:627–633. doi: 10.1016/j.jacc.2007.09.058. [DOI] [PubMed] [Google Scholar]
- 25.Ueland T, Yndestad A, Oie E, et al. Dysregulated osteoprotegerin/RANK ligand/RANK axis in clinical and experimental heart failure. Circulation. 2005;111:2461–2468. doi: 10.1161/01.CIR.0000165119.62099.14. [DOI] [PubMed] [Google Scholar]
- 26.Roysland R, Masson S, Omland T, et al. Prognostic value of osteoprotegerin in chronic heart failure: the GISSI-HF trial. Am Heart J. 2010;160:286–293. doi: 10.1016/j.ahj.2010.05.015. [DOI] [PubMed] [Google Scholar]
- 27.Ohtani T, Mohammed SF, Yamamoto K, et al. Diastolic stiffness as assessed by diastolic wall strain is associated with adverse remodelling and poor outcomes in heart failure with preserved ejection fraction. Eur Heart J. 2012;33:1742–1749. doi: 10.1093/eurheartj/ehs135. [DOI] [PMC free article] [PubMed] [Google Scholar]
- 28.Mangan SH, Van Campenhout A, Rush C, Golledge J. Osteoprotegerin upregulates endothelial cell adhesion molecule response to tumor necrosis factor-alpha associated with induction of angiopoietin-2. Cardiovasc Res. 2007;76:494–505. doi: 10.1016/j.cardiores.2007.07.017. [DOI] [PMC free article] [PubMed] [Google Scholar]
- 29.Zauli G, Corallini F, Bossi F, et al. Osteoprotegerin increases leukocyte adhesion to endothelial cells both in vitro and in vivo. Blood. 2007;110:536–543. doi: 10.1182/blood-2007-01-068395. [DOI] [PubMed] [Google Scholar]
- 30.Heymann MF, Herisson F, Davaine JM, et al. Role of the OPG/RANK/RANKL triad in calcifications of the atheromatous plaques: comparison between carotid and femoral beds. Cytokine. 2012;58:300–306. doi: 10.1016/j.cyto.2012.02.004. [DOI] [PubMed] [Google Scholar]
- 31.Lawrie A, Waterman E, Southwood M, et al. Evidence of a role for osteoprotegerin in the pathogenesis of pulmonary arterial hypertension. Am J Pathol. 2008;172:256–264. doi: 10.2353/ajpath.2008.070395. [DOI] [PMC free article] [PubMed] [Google Scholar]
- 32.Candido R, Toffoli B, Corallini F, et al. Human full-length osteoprotegerin induces the proliferation of rodent vascular smooth muscle cells both in vitro and in vivo. J Vasc Res. 2010;47:252–261. doi: 10.1159/000257339. [DOI] [PubMed] [Google Scholar]
- 33.Hansen L, Taylor WR. Is increased arterial stiffness a cause or consequence of atherosclerosis? Atherosclerosis. 2016;249:226–227. doi: 10.1016/j.atherosclerosis.2016.04.014. [DOI] [PMC free article] [PubMed] [Google Scholar]
- 34.Mahmud A, Feely J. Arterial stiffness and the renin–angiotensin–aldosterone system. J Renin Angiotensin Aldosterone Syst. 2004;5:102–108. doi: 10.3317/jraas.2004.025. [DOI] [PubMed] [Google Scholar]
- 35.Watanabe S, Shite J, Takaoka H, et al. Myocardial stiffness is an important determinant of the plasma brain natriuretic peptide concentration in patients with both diastolic and systolic heart failure. Eur Heart J. 2006;27:832–838. doi: 10.1093/eurheartj/ehi772. [DOI] [PubMed] [Google Scholar]
- 36.Mossahebi S, Zhu S, Kovacs SJ. Fractionating E-wave deceleration time into its stiffness and relaxation components distinguishes pseudonormal from normal filling. Circ Cardiovasc Imaging. 2015;8:e002177. doi: 10.1161/CIRCIMAGING.114.002177. [DOI] [PubMed] [Google Scholar]
- 37.Nagueh SF, Appleton CP, Gillebert TC, et al. Recommendations for the evaluation of left ventricular diastolic function by echocardiography. J Am Soc Echocardiogr. 2009;22:107–133. doi: 10.1016/j.echo.2008.11.023. [DOI] [PubMed] [Google Scholar]
- 38.Yamamoto K, Nishimura RA, Chaliki HP, Appleton CP, Holmes DR, Jr, Redfield MM. Determination of left ventricular filling pressure by Doppler echocardiography in patients with coronary artery disease: critical role of left ventricular systolic function. J Am Coll Cardiol. 1997;30:1819–1826. doi: 10.1016/s0735-1097(97)00390-2. [DOI] [PubMed] [Google Scholar]
- 39.Iwano H, Kamimura D, Fox E, Hall M, Vlachos P, Little WC. Altered spatial distribution of the diastolic left ventricular pressure difference in heart failure. J Am Soc Echocardiogr. 2015;28:597–605e1. doi: 10.1016/j.echo.2015.01.002. [DOI] [PMC free article] [PubMed] [Google Scholar]
- 40.Ohara T, Niebel CL, Stewart KC, et al. Loss of adrenergic augmentation of diastolic intra-LV pressure difference in patients with diastolic dysfunction: evaluation by color M-mode echocardiography. JACC Cardiovasc Imaging. 2012;5:861–870. doi: 10.1016/j.jcmg.2012.05.013. [DOI] [PubMed] [Google Scholar]
- 41.Redfield MM, Jacobsen SJ, Borlaug BA, Rodeheffer RJ, Kass DA. Age- and gender-related ventricular-vascular stiffening: a community-based study. Circulation. 2005;112:2254–2262. doi: 10.1161/CIRCULATIONAHA.105.541078. [DOI] [PubMed] [Google Scholar]
- 42.Borlaug BA. The pathophysiology of heart failure with preserved ejection fraction. Nat Rev Cardiol. 2014;11:507–515. doi: 10.1038/nrcardio.2014.83. [DOI] [PubMed] [Google Scholar]
- 43.Mentz RJ, Kelly JP, von Lueder TG, et al. Noncardiac comorbidities in heart failure with reduced versus preserved ejection fraction. J Am Coll Cardiol. 2014;64:2281–2293. doi: 10.1016/j.jacc.2014.08.036. [DOI] [PMC free article] [PubMed] [Google Scholar]
- 44.Prenner SB, Chirinos JA. Arterial stiffness in diabetes mellitus. Atherosclerosis. 2015;238:370–379. doi: 10.1016/j.atherosclerosis.2014.12.023. [DOI] [PubMed] [Google Scholar]
- 45.Gori M, Senni M, Gupta DK, et al. Association between renal function and cardiovascular structure and function in heart failure with preserved ejection fraction. Eur Heart J. 2014;35:3442–3451. doi: 10.1093/eurheartj/ehu254. [DOI] [PMC free article] [PubMed] [Google Scholar]
- 46.Ovchinnikova OA, Folkersen L, Persson J, et al. The collagen cross-linking enzyme lysyl oxidase is associated with the healing of human atherosclerotic lesions. J Intern Med. 2014;276:525–536. doi: 10.1111/joim.12228. [DOI] [PubMed] [Google Scholar]
- 47.Venuraju SM, Yerramasu A, Corder R, Lahiri A. Osteoprotegerin as a predictor of coronary artery disease and cardiovascular mortality and morbidity. J Am Coll Cardiol. 2010;55:2049–2061. doi: 10.1016/j.jacc.2010.03.013. [DOI] [PubMed] [Google Scholar]
- 48.Lester SJ, Tajik AJ, Nishimura RA, Oh JK, Khandheria BK, Seward JB. Unlocking the mysteries of diastolic function: deciphering the Rosetta Stone 10 years later. J Am Coll Cardiol. 2008;51:679–689. doi: 10.1016/j.jacc.2007.09.061. [DOI] [PubMed] [Google Scholar]
- 49.Solanki P, Zakir RM, Patel RJ, et al. Hypertension in African Americans with heart failure: progression from hypertrophy to dilatation; perhaps not. High Blood Press Cardiovasc Prev. 2015;22:61–68. doi: 10.1007/s40292-014-0070-3. [DOI] [PubMed] [Google Scholar]
- 50.Cleland JG, Swedberg K, Follath F, et al. The EuroHeart Failure survey programme – a survey on the quality of care among patients with heart failure in Europe. Part 1: Patient characteristics and diagnosis. Eur Heart J. 2003;24:442–463. doi: 10.1016/s0195-668x(02)00823-0. [DOI] [PubMed] [Google Scholar]
- 51.Kitzman DW, Shah SJ. The HFpEF obesity phenotype: the elephant in the room. J Am Coll Cardiol. 2016;68:200–203. doi: 10.1016/j.jacc.2016.05.019. [DOI] [PubMed] [Google Scholar]