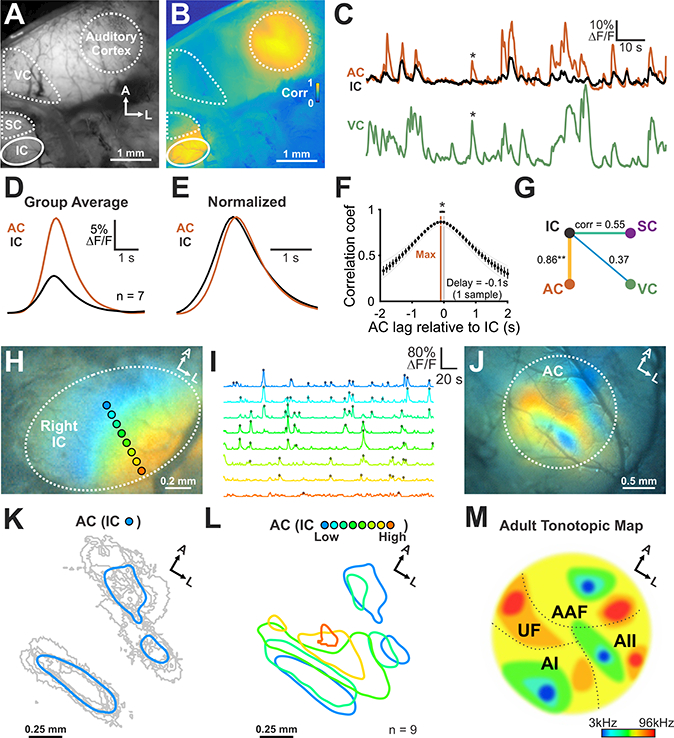
Figure 4. Auditory cortex receives tonotopically-organized information from inferior colliculus.

(A) Spontaneous neural activity across midbrain and cortex using wide field epifluorescence.
(B) Correlation map generated by performing a pixel-by-pixel correlation against signals from the IC (see Methods for details).
(C) Fluorescence transients seen in auditory cortex (AC), IC, and primary visual cortex (VC). Asterisk highlights cortical activity that was not correlated with IC activity.
(D) Average transient from IC and AC (n = 7 animals).
(E) Amplitude normalized transient from IC and AC (n = 7 animals).
(F) Cross-correlogram of signals in IC and AC. n = 7 animals (two-tailed paired Student’s t-test, *: P < 0.05).
(G) Diagram displaying the average correlation coefficient between brain regions. (n = 7 animals; one-way ANOVA, Tukey’s post-hoc, ** P < 0.005 for IC-AC versus all other correlations).
(H) Illustration of ROIs aligned to the future tonotopic axis of the IC. Colors in image indicate high correlations with the ROIs indicated.
(I) Normalized signals from ROIs indicated in (H). Detected peaks are indicated with filled circles.
(J) AC spatial activity map generated using activity from distinct zones within the IC. Concurrent activity in the IC and AC was averaged based on location of the peak within the IC. Each color corresponds to the ROIs indicated in (H).
(K) Individual (gray) and average area (blue) in the AC that exhibited correlated activity with future low frequency areas of the IC. Areas were defined by thresholding average response by 80% of maximum fluorescence.
(L) Group average spatial map in the AC generated from events within distinct, future tonotopic zones of the IC. Note that high frequency regions of the IC are underrepresented, due to the limited visualization of these deeper regions using wide field epifluorescence imaging.
(M) Schematic of AC organization in the adult mouse. AI: primary AC, AII: secondary AC, AAF: anterior auditory field, UF: ultrasonic field.
