Abstract
Increased levels of the second messenger lipid diacylglycerol (DAG) induce a variety of downstream signaling events including the translocation of C1 domain-containing proteins toward the plasma membrane. Here, we introduce three light-sensitive DAGs, termed PhoDAGs, which feature a photoswitchable acyl chain allowing for reversible isomerization under the control of light. The PhoDAGs are inactive in the dark and promote the translocation of proteins that feature C1 domains towards the plasma membrane upon stimulation with UV-A irradiation. This effect is quickly reversed after the termination of photostimulation, or by irradiation with blue light, permitting multiple rounds of translocation and the generation of oscillation patterns. Both novel and conventional isoforms of protein kinase C (PKC), as well as Munc13, can thus be put under optical control. PhoDAGs can be used to control vesicle release in excitable cells, such as mouse pancreatic islets and hippocampal neurons, and modulate synaptic transmission at the neuromuscular junction of Caenorhabditis elegans. As such, the PhoDAGs afford an unprecedented degree of spatiotemporal control, particularly with respect to pattern formation, and are broadly applicable tools to unravel various DAG-dependent signaling pathways.
Introduction
Diacylglycerol (DAG) is not only an integral component of plasma membrane phospholipids, but is also known for its role as a second messenger1. Cellular DAG concentrations are tightly regulated by enzymes including phospholipase C, as well as DAG lipases and kinases2. The bulk of DAG originates from phosphatidylcholine, or the phospholipase C-mediated hydrolysis of phosphoinositides. Rapid changes in DAG levels occur following the extracellular stimulation of receptors3. Over 50 different DAGs have been identified in humans4, and the length and degree of unsaturation of the lipid chains determines the biophysical and pharmacological properties of individual DAG species5.
DAGs interact with both transmembrane and soluble proteins, and are known to activate Transient Receptor Potential (TRP) cation channels, including TRPC3 and TRPC66. Importantly, DAG generation also triggers the translocation towards the plasma membrane of a number of proteins that contain C1 domains7. These small, highly conserved, zinc-binding protein domains were originally characterized as the DAG-sensing regulatory elements of the protein kinase C (PKC) family8. C1-mediated translocation plays a key role in the activation of various other factors, including kinases and nucleotide exchange factors2. The protein machinery involved in synaptic transmission and exocytosis is also affected by DAG2,9. Relevant targets include the protein family of Caenorhabditis elegans Unc13 and its mammalian counterpart Munc13, which are C1-containing effector proteins located on pre-synaptic neuron terminals. Munc13s prime synaptic vesicles for fusion with the plasma membrane by the activation of Syntaxin10, facilitating the release of neurotransmitters into the synaptic cleft following an action potential11–13. Thus, a tool that enables reversible control of C1 domain translocation would be widely applicable towards the control of intra- and intercellular signaling.
Precision pharmacological manipulation of lipid signaling is often difficult due to the restricted localization and diffusion of these hydrophobic molecules. Experimentally, the activation of C1 domain-containing proteins is usually achieved by addition of bryostatins or phorbol-esters, which can be viewed as highly potent DAG mimics14. So far, the greatest control over DAG concentrations has been achieved with the photochemical uncaging of DAGs, such as caged 1,2-O-dioctanoyl-sn-glycerol (cg-1,2-DOG)15. However, once triggered, the activity cannot be switched OFF and the decay of the DAG signal fully depends on its metabolism or diffusion from the cell. Alternatively, chemical dimerizers16,17 or optogenetic techniques18 may be employed to modulate the levels of signaling lipids in cells upon the addition of a small molecule or a flash of light, respectively. While these systems hold great promise for rapid switching within signaling networks, they require recombinant expression of non-native proteins, and frequently depend on the presence of exogenous co-factors.
Previously, we prepared a series of photoswitchable fatty acids, termed FAAzos19, which can mimic highly unsaturated fatty acids such as arachidonic acid. These can be used as modular building blocks for synthetic incorporation into more elaborate photolipids. We now report the incorporation of the FAAzos into the DAG scaffold. The resulting photoswitchable DAGs, PhoDAGs, allow us to mimic the effects of natural DAGs in living cells with unprecedented kinetics and reversibility, especially in regards to pattern formation.
Results
Design and synthesis of photoswitchable DAGs
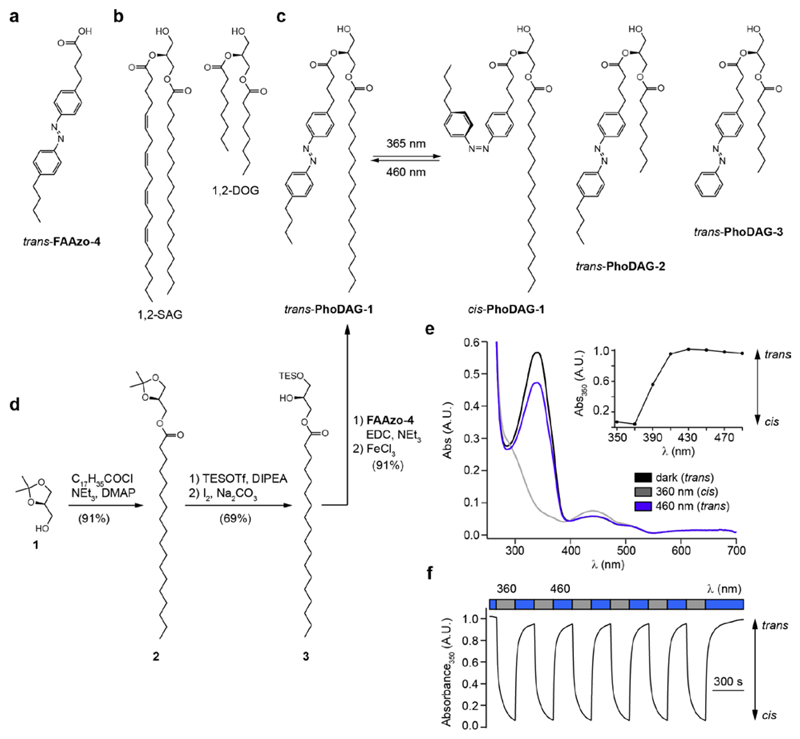
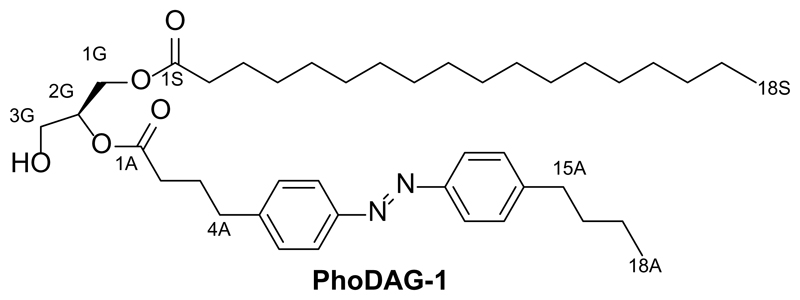
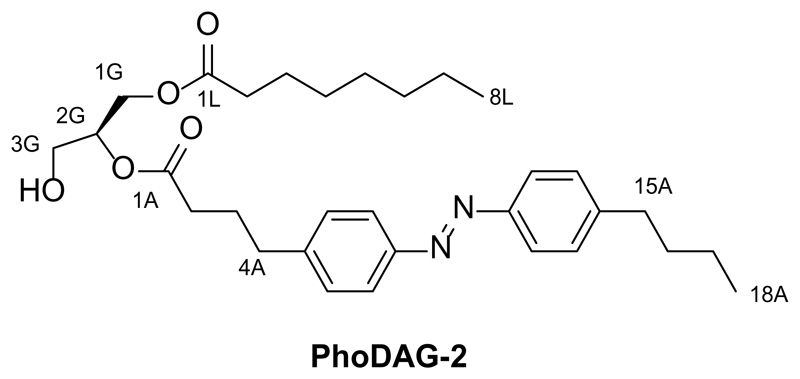
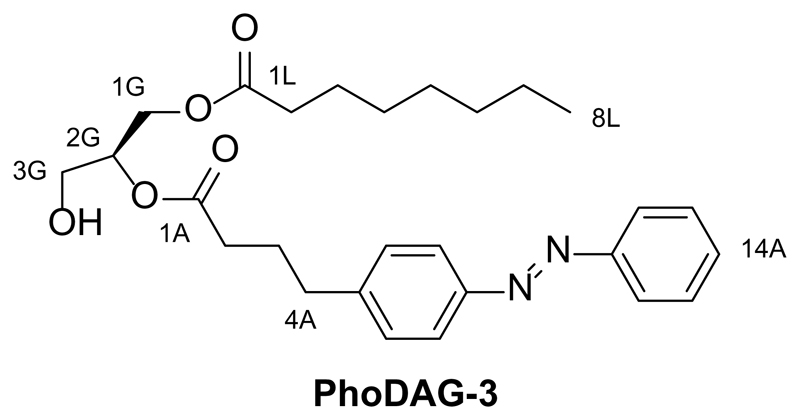
The design of the PhoDAGs was guided by our previous work which suggested that the azobenzene derivative FAAzo-4 (Fig. 1a), in its cis-configuration, is able to mimic arachidonic acid19. Therefore, we synthesized PhoDAG-1 as a photoswitchable analog of 2-O-arachidonyl-1-O-stearoyl-sn-glycerol (1,2-SAG) (Fig. 1b,c). PhoDAG-1 was intended to be less active with the azobenzene in the trans-form, and become more active upon isomerization to the cis-form with λ = 365 nm light. The more hydrophilic DAGs, PhoDAG-2 and PhoDAG-3 (Fig. 1c), were designed as cell-permeable analogs mimicking 1,2-O-dioctanoyl-sn-glycerol (1,2-DOG)20, and contain shorter alkyl chains at the sn1 and sn2 positions (Supplementary Fig. 1).
Figure 1. Design and synthesis of photoswitchable diacylglycerols.
The chemical structures of (a) the photoswitchable fatty acid FAAzo-4, (b) 2-O-arachidonyl-1-O-stearoyl-sn-glycerol (1,2-SAG) and 1,2-O-dioctanoyl-sn-glycerol (1,2-DOG). (c) The chemical structures of photoswitchable diacylglycerols PhoDAG-1, PhoDAG-2 and PhoDAG-3. (d) PhoDAG-1 was synthesized in four steps and 57% overall yield. (e) The UV-Vis spectra of PhoDAG-1 (25 μM in DMSO) in its dark-adapted (black), UV-adapted (gray) and blue-adapted (blue) photostationary states. The absorbance at λ = 350 nm was plotted as a function of the irradiation wavelength, demonstrating that PhoDAG-1 existed primarily in its trans- and cis-configurations under blue and UV-A irradiation, respectively. (f) PhoDAG-1 could be cycled between the two states over many cycles without fatigue. The absorbance at λ = 350 nm was plotted over multiple cycles of alternating UV-A and blue irradiation.
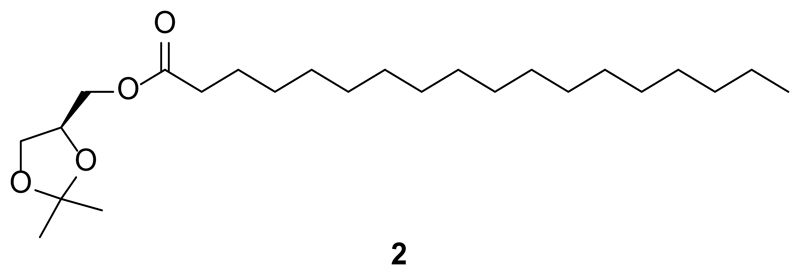
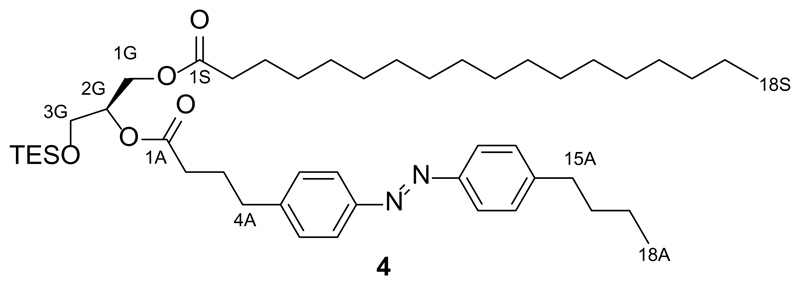
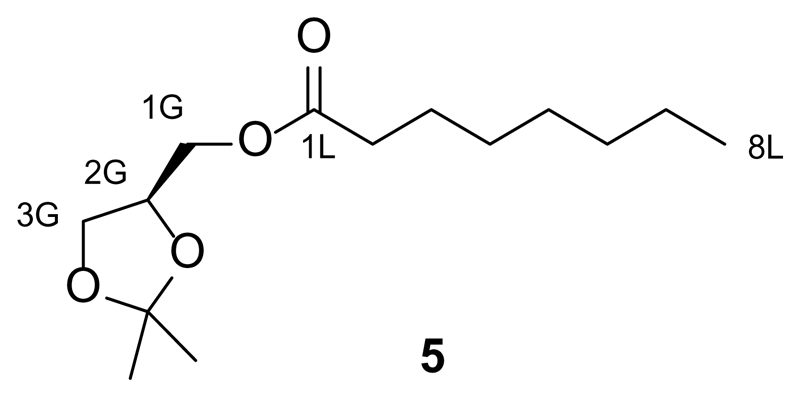
The synthesis of PhoDAG-1 (Fig. 1d) involved first the acetylation of chiral ketal 1 with stearic acid to yield ester 2. Regioselective deprotection of the isopropylidene group afforded alcohol 3, which was immediately acylated with FAAzo-4. Final deprotection of the doubly esterified glycerol 4 yielded PhoDAG-1 after four steps in 57% overall yield. When handled under ambient lighting conditions, PhoDAG-1 existed predominantly in its thermally stable trans-configuration and contained approximately 10% of the cis-isomer (Supplementary Fig. 2a). On irradiation with UV-A light (λ = 350-375 nm), PhoDAG-1 isomerized to its thermally unstable cis-isomer (Fig. 1e). Thermal back-relaxation of cis-PhoDAG-1 occurred with a τ-value of about 60 h in DMSO and 22 h in water. Irradiation with blue light increased the rate of back-relaxation from cis to trans. As such PhoDAG-1 behaves as a regular azobenzene, and can be switched over many cycles without fatigue (Fig. 1f). The remaining PhoDAGs were prepared in an analogous fashion (Supplementary Fig. 2b), and possessed comparable spectral characteristics to PhoDAG-1.
Optical control of C1 domain translocation
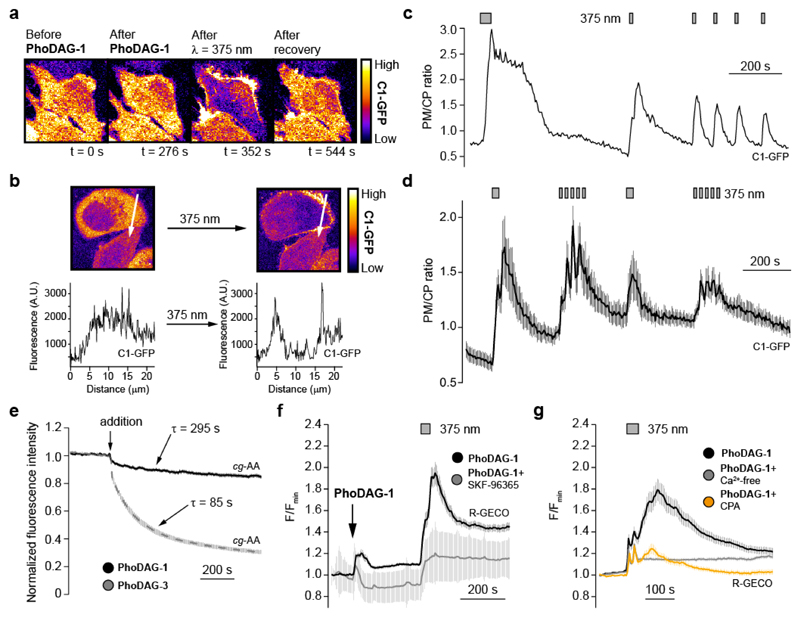
To determine whether the PhoDAGs are able to mimic DAG, we evaluated their effects in HeLa cells transiently expressing a fluorescent C1 domain translocation reporter (C1-GFP)21,22. Before the addition of any compound, C1-GFP was evenly distributed within the cytoplasm, and the application of trans-PhoDAG-1 did not affect the localization of the reporter (Fig. 2a). Illumination with UV-A light (λ = 375 nm) rapidly induced the translocation of C1-GFP towards the outer plasma membrane (Fig. 2b, Supplementary Fig. 3). The degree of C1 domain translocation was quantified by measuring the ratio of the GFP intensities in the plasma membrane and cytoplasm, and was plotted as the plasma membrane to cytoplasmic (PM/CP) fluorescence ratio (Supplementary Fig. 4). After termination of the UV-A irradiation, C1-GFP diffused back into the cytoplasm, and translocation was again triggered on repeated stimulation (Fig. 2c). C1-GFP localization could be controlled with a high degree of spatial precision, as only cells that were directly irradiated were affected (Supplementary Fig. 5). Shorter UV-A pulses triggered a small and transient translocation, while longer periods of irradiation caused a larger and more sustained response (Fig. 2d), permitting the generation of patterns of C1-GFP translocation. After incubation with PhoDAG-1 followed by washing and removal of extracellular compound, translocation of C1-GFP was still observed on photoactivation (Supplementary Fig. 6a). The magnitude of the translocation induced by cis-PhoDAG-1 was comparable to that which was triggered by the uncaging of 1,2-DOG from its coumarin-caged form, cg-1,2-DOG (Supplementary Fig. 6b-d).
Figure 2. PhoDAG-1 enables optical control of C1-GFP translocation and intracellular Ca2+ concentration in HeLa cells.
(a) Fluorescence images showed that PhoDAG-1 (150 μM) catalyzed reversible translocation of C1-GFP in HeLa cells towards the plasma membrane only after irradiation with λ = 375 nm light. (b) C1-GFP fluorescence intensity was sampled across a representative cell. GFP fluorescence accumulated at the plasma membrane in the presence of cis-PhoDAG-1. (c) Translocation could be repeatedly triggered over multiple cycles in the presence of PhoDAG-1, and was quantified by plotting the plasma membrane to cytoplasm (PM/CP) fluorescence intensity ratio of a representative cell. (d) Patterns of C1-GFP translocation were generated by irradiation at λ = 375 nm in the presence of PhoDAG-1. (e) Fluorescence quenching dynamics of coumarin-labelled arachidonic acid (cg-AA, 100 μM) localized at the internal cell membranes after application of PhoDAG-1 (150 μM, n = 18, black) or PhoDAG-3 (150 μM, n = 19, gray) in HeLa cells. (f) The TRPC channel blocker SKF-96365 (50 μM) decreased the Ca2+ influx on application and photoactivation of PhoDAG-1 (n = 54, gray) when compared to PhoDAG-1 alone (n = 16, black). [Ca2+]i levels were monitored with the R-GECO Ca2+ sensor. (g) After incubation with PhoDAG-1 followed by the removal of extracellular compound, both cyclopiazonic acid (CPA, 50 μM, n = 64, orange) and NiCl2 (5 mM) combined with a Ca2+-free extracellular buffer (0.1 mM EGTA, n = 73, gray) reduced the Ca2+ response. Error bars were calculated as s.e.m.
Interestingly, PhoDAG-2 and PhoDAG-3 did not induce pronounced translocation of C1-GFP towards the plasma membrane. C1-GFP mostly accumulated on the inner membranes on application (Supplementary Fig. 7a). To understand this effect, we monitored the localization and uptake of the PhoDAGs by exploiting the quenching of coumarin fluorescence by the azobenzene. We loaded HeLa cells with coumarin-labelled arachidonic acid (cg-AA) (Supplementary Fig. 7b), which localizes predominantly at the inner cellular membranes23. Application of PhoDAG-1 caused a slow but small decrease in the observed coumarin fluorescence (<20% of total, τ = 295 s) (Fig. 2e black, Supplementary Fig. 7c). In comparison, PhoDAG-3 caused a more rapid and significant decrease in coumarin fluorescence (>70% in total, τ = 85 s) (Fig. 2e gray, Supplementary Fig. 7d). Taken together, these results suggest that PhoDAG-1 internalizes more slowly and remains trapped on the plasma membrane. In contrast, the shorter chain PhoDAG-3 quickly moves to the inner membranes. UV-A irradiation alone did not trigger the translocation of C1-GFP to the plasma membrane (Supplementary Fig. 8a).
PhoDAGs modulate intracellular Ca2+ levels in HeLa cells
1,2-SAG was previously reported to increase intracellular Ca2+ ([Ca2+]i) levels in HeLa cells via activation of TRPC channels15. We examined the effect of PhoDAG-1 on [Ca2+]i levels using the genetically encoded Ca2+ sensor, R-GECO24. On application, trans-PhoDAG-1 stimulated a small rise in [Ca2+]i (Fig. 2f). Upon isomerization to cis-PhoDAG-1, a much larger [Ca2+]i increase was observed. The TRPC channel blocker SKF-96365 suppressed the rise in [Ca2+]i (Fig. 2f), suggesting the involvement of TRPC3 and/or TRPC6 channels25. After incubation with PhoDAG-1 followed by washing and removal of extracellular compound, an increase in [Ca2+]i was still observed on photoactivation (Supplementary Fig. 6a, Supplementary Fig. 8b). Incubation with cyclopiazonic acid, which depletes endoplasmic reticulum (ER) Ca2+ stores26, diminished the Ca2+ response (Fig. 2g, orange). NiCl2 in combination with a Ca2+-free extracellular buffer15, abolished the Ca2+ signal by preventing the entry of extracellular Ca2+ (Fig. 2g, gray). Taken together, these results suggest that, cis-PhoDAG-1 promotes Ca2+ influx by activation of TRPC channels, which in turn triggers Ca2+-induced Ca2+ release from intracellular stores27. Interestingly, application and photoactivation of PhoDAG-3 only caused a small increase in [Ca2+]i, which was not affected by SKF-96365 (Supplementary Fig. 8c).
Optical control of protein kinase C
PKCs are a group of serine/threonine kinases that are involved in cell cycle regulation, proliferation, apoptosis and migration3. The PKC family is grouped into three different subtypes; conventional, novel and atypical, according to their cofactor requirements as determined by the regulatory elements linked to the kinase domain28. These regulatory domains allow different PKC isoforms to decode different signals at the plasma membrane, such as the generation of DAG.
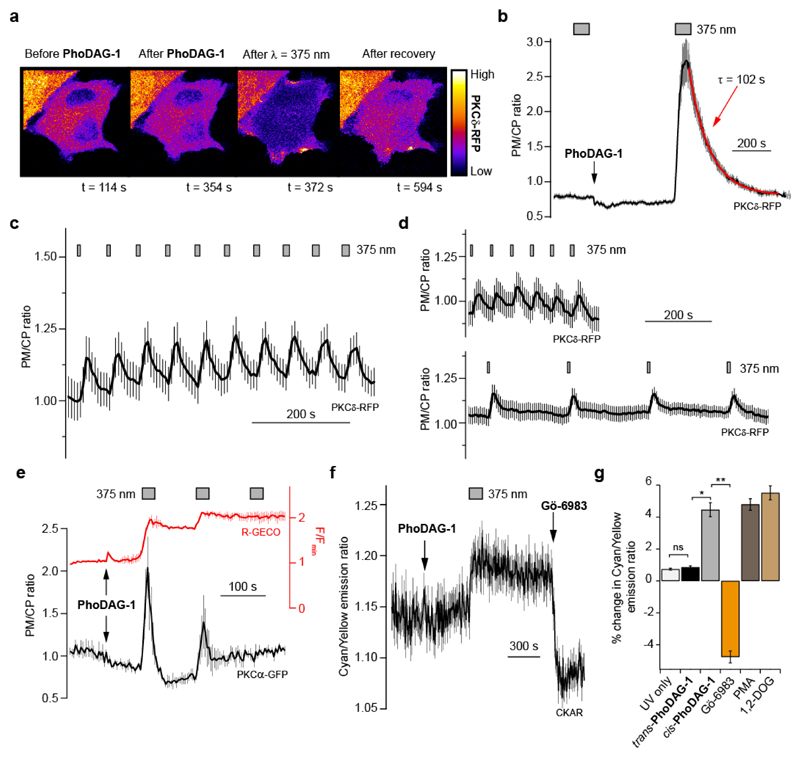
Novel PKC isoforms, such as PKCδ, contain two C1 domains which orchestrate their activation alongside translocation toward the plasma membrane in a Ca2+-independent fashion29. In HeLa cells, PhoDAG-1 triggered translocation of fluorescently labeled PKCδ (PKCδ-RFP) towards the plasma membrane following a UV-A flash (Fig. 3a, Supplementary Movie 1). After termination of the irradiation, PKCδ-RFP translocated back to the cytosol with a τ-value of ~102 s (Fig. 3b). As with C1-GFP, translocation could be repeated over several cycles, however the magnitude of translocation often diminished with repeated UV-A flashes of the same duration (Supplementary Fig. 9a). To overcome this limitation, we developed a protocol that allowed us to perform many translocation cycles with no decrease in efficiency by increasing the irradiation time for each sequential stimulation (Fig. 3c). Increasing the interval time between the UV-A pulses did not affect the translocation magnitude, suggesting that trans-PhoDAG-1 metabolism was not a significant factor (Fig. 3d).
Figure 3. PhoDAG-1 enables optical control of novel and conventional PKC isoforms.
(a) Fluorescence images of HeLa cells expressing PKCδ-RFP showed that PhoDAG-1 (100 μM) triggered the reversible translocation of PKCδ-RFP towards the plasma membrane on λ = 375 nm irradiation. (b) After photoactivation, PKCδ-RFP redistributes back to the cytoplasm (n = 19). Translocation is displayed as the plasma membrane to cytoplasm (PM/CP) fluorescence intensity ratio. (c) Oscillations of PKCδ-RFP translocation could be generated by sequential pulses of UV-A irradiation with increasing length (n = 11). (d) Changing the time between pulses of UV-A light did not affect the magnitude of the translocation. Both the 60 s (n = 13) and 240 s (n = 15) intervals showed similar translocation efficiencies. (e) After the application of trans-PhoDAG-1 (150 μM), PKCα-GFP translocation towards the plasma membrane was induced by isomerization to cis (n = 3). Multiple rounds of irradiation led to diminished translocation efficiency, corresponding to a reduced Ca2+ response on sequential photostimulations. [Ca2+]i levels (R-GECO) were displayed as the RFP fluorescence intensity and normalized to the baseline fluorescence (F/Fmin). (f,g) PKC activation was evaluated in HeLa cells expressing PKCδ-RFP and the cytosolic C kinase activation reporter, CKAR32. (f) PhoDAG-1 (300 μM) triggered an increase in the cyan/yellow fluorescence emission ratio on irradiation at λ = 375 nm, indicating PKC activation (n = 49). (g) Photoactivation of PhoDAG-1 (n = 49) produced a similar FRET change when compared to 1,2-DOG (300 μM, n = 32) and PMA (5 μM, n = 31). Application of Gö-6983 (10 μM, n = 49) reversed this effect. ns = not significant P>0.05, *P<0.005, ** P<0.001. Error bars were calculated as s.e.m.
Conventional PKCs, such as PKCα, also possess dual C1 domains that bind DAG. However, they also contain a C2 domain that binds anionic lipids in a Ca2+-dependent fashion28, complicating our analysis. In HeLa cells expressing a fluorescent PKCα reporter alongside R-GECO, PhoDAG-1 triggered the translocation of PKCα-GFP30 towards the plasma membrane on photoactivation (Fig. 3e). In contrast to C1-GFP and PKCδ-RFP, PKCα-GFP translocation efficiency decreased quickly alongside Ca2+ influx on sequential photostimulations, reflecting its known Ca2+-sensitivity.
Although PKC translocation to the plasma membrane is normally associated with its activation31, translocation alone is not sufficient to conclude whether PhoDAG-1 can activate PKC phosphorylation in a light-dependent manner. To this end, we utilized the C kinase activity reporter (CKAR)32, which displays a decrease in FRET efficiency on phosphorylation (Fig. 3f,g). In line with previous reports32, the addition of 1,2-DOG (Supplementary Fig. 9b) to HeLa cells expressing CKAR caused a 5.5% increase in the CFP/YFP fluorescence ratio, while the application of phorbol 12-myristate 13-acetate (PMA) (Supplementary Fig. 9c) caused a 4.8% increase. As expected, the application of trans-PhoDAG-1 did not cause a significant CKAR FRET change. However, a 4.4% increase in the CFP/YFP fluorescence ratio was observed on isomerization to cis, corresponding to 80% of the response evoked by 1,2-DOG (Fig. 3g). Interestingly, the application of trans-PhoDAG-3 also caused a small increase (2.2%) in the CFP/YFP ratio on application, and a further 2.0% increase was induced by photoactivation (Supplementary Fig. 9d,e). The overall response after the application and photoactivation of PhoDAG-3 was similar to that which was evoked by PhoDAG-1 (95%) or 1,2-DOG (76%). This effect was observed even in the absence of a clear translocation to the outer plasma membrane, suggesting that PKCδ-RFP could be activated on internal membranes as well. In all cases, the effect was reversed by the application of the broad-spectrum PKC inhibitors Gö-6983 or chelerythrine chloride (Fig. 3f,g, Supplementary Fig. 9)33,34.
PhoDAGs enable control of Ca2+ oscillations in MIN6 cells and dissociated β-cells
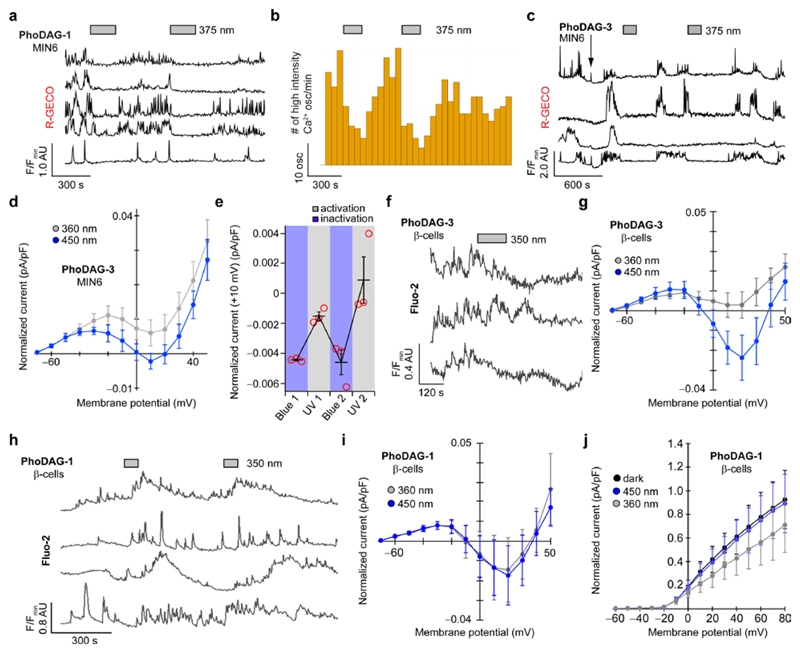
In pancreatic β-cells, glucose induces oscillations in [Ca2+]i levels, the frequency of which strongly correlate with insulin secretion35,36. Similarly, DAG levels have also been shown to oscillate in β-cells22, implicating a connection between glucose and lipid metabolism37. The exact mechanism by which DAGs regulate insulin secretion remains elusive38, however increased DAG levels were reported to terminate Ca2+ oscillations in the mouse insulinoma-derived cell line, MIN639–41. These cells are often used as a model β-cell line, and exhibit characteristics of glucose metabolism and glucose-stimulated insulin secretion broadly similar to those observed in native β-cells42. The addition of trans-PhoDAG-1 did not affect Ca2+ oscillations in MIN6 cells stimulated by a high glucose concentration (20 mM). Photoactivation with λ = 375 nm for 3 min caused a rapid decline in both the intensity and frequency of the Ca2+ oscillations (Fig. 4a,b), as well as the overall [Ca2+]i level (Supplementary Fig. 10a). In the majority of cells examined, this termination was transient and lasted on average 5 min. PhoDAG-3 behaved in a similar manner, but was active at a much lower concentration (Fig. 4c).
Figure 4. Optical control of Ca2+ oscillations in MIN6 and dissociated β-cells.
(a-c) Ca2+ oscillations in glucose-stimulated (20 mM) MIN6 cells were monitored using R-GECO. PhoDAG-1 (300 μM) decreased [Ca2+]i levels on photoactivation with λ = 375 nm light, displayed as (a) individual [Ca2+]i traces from four representative cells, and (b) a statistical analysis of the oscillation frequency (n = 38). Bar graphs represent the number of high intensity Ca2+ oscillations (>50% of highest transient in each trace) detected within every 60 s interval. (c) PhoDAG-3 (35 μM) also triggered a decrease in glucose-stimulated (20 mM) Ca2+ oscillations on photoactivation. (d) Isomerization to cis-PhoDAG-3 (35 μM, n = 6) induced a marked decrease in whole-cell voltage-gated Ca2+ (Cav) current. (e) This effect could be reversed by blue light and could be repeated over several cycles (n = 3). (f,g) In dissociated mouse β-cells, cis-PhoDAG-3 (10 μM) caused a decrease in (f) glucose-stimulated (11 mM) Ca2+ oscillations, corresponding to (g) a reduction in the Cav current (15 μM, n = 3). (h) In contrast, cis-PhoDAG-1 (200 μM) led to an increase in the Ca2+ oscillation frequency. (i) PhoDAG-1 (200 μM) had no effect on the Cav current (n = 5), however (j) a reduction in the delayed rectifier voltage-activated K+ channel (Kv) current was observed on isomerization to cis (n = 3). Error bars were calculated as s.e.m.
Ca2+ oscillations in β-cells are driven by a dynamic interplay between voltage-gated Ca2+ and K+ channels. It has been reported that DAGs modulate the conductance of L-type voltage-activated Ca2+ channels (Cav) in mouse β-cells, and 1,2-DOG is known to inhibit the whole-cell Cav current43. Using whole-cell patch clamp electrophysiology in MIN6 cells44, we evaluated the effect of PhoDAGs on Cav conductance. Photoactivation of PhoDAG-3 with UV-A light triggered a decrease in the Cav current (Fig. 4d, Supplementary Fig. 10b). This effect could be reversed by irradiation with blue light, and could be repeated over several cycles (Fig. 4e). As previously reported41,43, the addition of free 1,2-DOG triggered a gradual decrease in the frequency and intensity of the Ca2+ oscillations, alongside a reduction in the Cav current (Supplementary Fig. 10c,d). Similarly, the uncaging of cg-1,2-DOG led to a rapid decline in the oscillation frequency, due to the immediate liberation of high levels of 1,2-DOG within the cellular membranes (Supplementary Fig. 10e). Application of diltiazem, which blocks L-type Ca2+ channels45, the major subtype in these cells46, diminished the Cav current in a similar fashion (Supplementary Fig. 10c). UV-A irradiation alone did not affect the oscillatory behavior (Supplementary Fig. 11) or the Cav current (Supplementary Fig. 10c).
To compare the responses observed in MIN6 to those of primary β-cells, we cultured β-cells from dissociated mouse pancreatic islets. As in MIN6 cells, PhoDAG-3 triggered a light-dependent decrease in Ca2+ oscillation frequency (Fig. 4f) and the whole-cell Cav conductance (Fig. 4g). Surprisingly, in these cells cis-PhoDAG-1 yielded an increase in the oscillation frequency and [Ca2+]i level (Fig. 4h). Patch clamp experiments revealed that, whereas photoactivation of PhoDAG-1 had little effect on Cav conductance (Fig. 4i), it caused a reduction in the conductance of delayed rectifier voltage-gated K+ channels (Kv) (Fig. 4j). In previous studies, ablation of Kv increased the Ca2+ oscillation frequency in β-cells by extending the action potential duration47,48, and arachidonic acid is known to block Kv2.1 to exert identical effects49. In control experiments, the application of 1,2-DOG also decreased the magnitude of β-cell Cav conductance (Supplementary Fig. 12a), while the addition of arachidonic acid also triggered a decrease in the Kv current (Supplementary Fig. 12b). Neither UV-A nor blue-irradiation alone affected the Cav or Kv currents (Supplementary Fig. 12).
PhoDAGs enable optical control of ionic fluxes and insulin secretion in rodent pancreatic islets
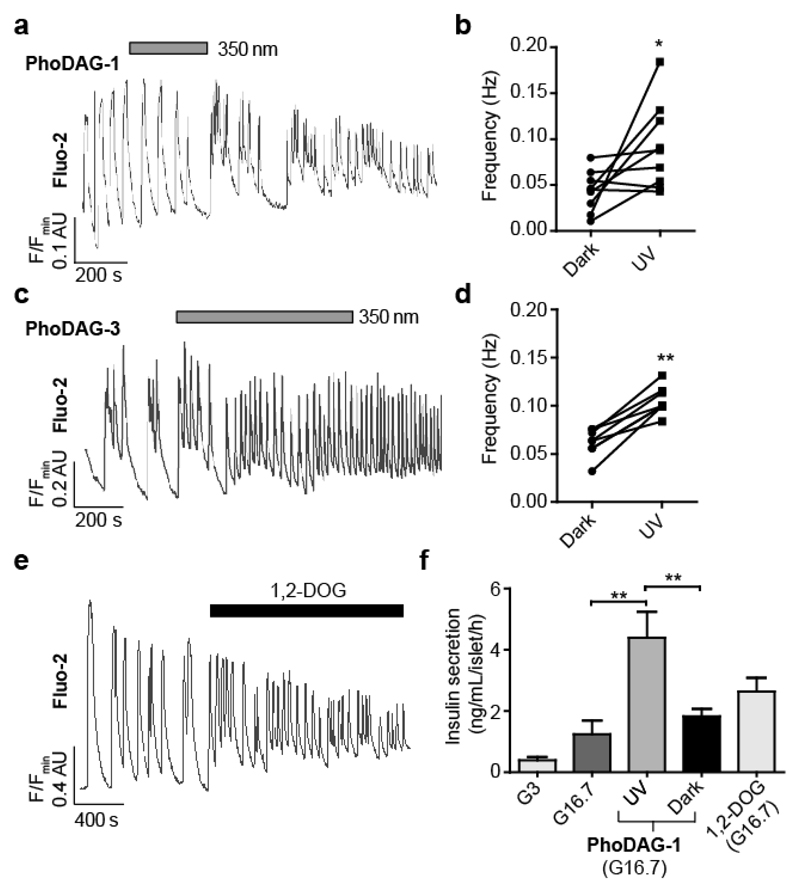
Islets of Langerhans are endocrine micro-organs comprised of hundreds of β-cells together with α-, δ- and pancreatic polypeptide cells50. They respond to glucose with increased DAG levels, and this lipid is considered to be an important mediator of insulin secretion through its effects on C1 domain-possessing partners51. We therefore examined whether responses in intact islets were similar to MIN6 and dissociated β-cells, and whether optical control could be afforded over ionic fluxes to influence insulin release. In contrast to the effects observed in dissociated cells, intact mouse pancreatic islets pre-treated with either PhoDAG-1 (Fig. 5a,b) or PhoDAG-3 (Fig. 5c,d) responded to illumination with a marked and reproducible increase in the glucose-stimulated (11 mM) Ca2+ oscillation frequency. These results could be mimicked by the application of 1,2-DOG (Fig. 5e). Strikingly, islets treated with PhoDAG-1 were rendered light-responsive, displaying almost a 3-fold increase in insulin secretion (at 16.7 mM glucose) following photoactivation (Fig. 5f). UV-A irradiation alone did not significantly affect the oscillation frequency or the amount of insulin secreted (Supplementary Fig. 13). Combined, these results suggest that photoactivation of the PhoDAGs in intact pancreatic islets increases the Ca2+ oscillation frequency and consequently, elevates insulin secretion.
Figure 5. Optical control of insulin secretion in intact mouse pancreatic islets.
Ca2+ oscillations in glucose-stimulated (11 mM) mouse pancreatic islets were monitored using Fluo-2. (a,b) Photoactivation of PhoDAG-1 (200 μM) triggered an increase in the oscillation frequency, displayed as (a) a representative trace from a single islet and (b) the average oscillation frequencies for several islets before and after λ = 350 nm irradiation (n = 9). (c,d) Similarly, photoactivation of PhoDAG-3 (100 μM) led to a marked increase in Ca2+ oscillation frequency (n = 8). (e) The application of 1,2-DOG (100 μM) led to an increase in the oscillation frequency (n = 8). (f) As determined by a homogeneous time-resolved fluorescence (HTRF) assay, cis-PhoDAG-1 (200 μM) at 16.7 mM glucose led to a 3-fold increase in insulin secretion when compared to either trans-PhoDAG-1 or glucose-stimulated conditions (16.7 mM) alone. Similar effects were observed with 1,2-DOG (100 μM) (n = 3 assays from 6 animals). G3 = 3 mM glucose, G16.7 = 16.7 mM glucose. ns = not significant, *P<0.05, **P<0.01. Error bars were calculated as s.e.m.
PhoDAGs enable optical control of synaptic transmission
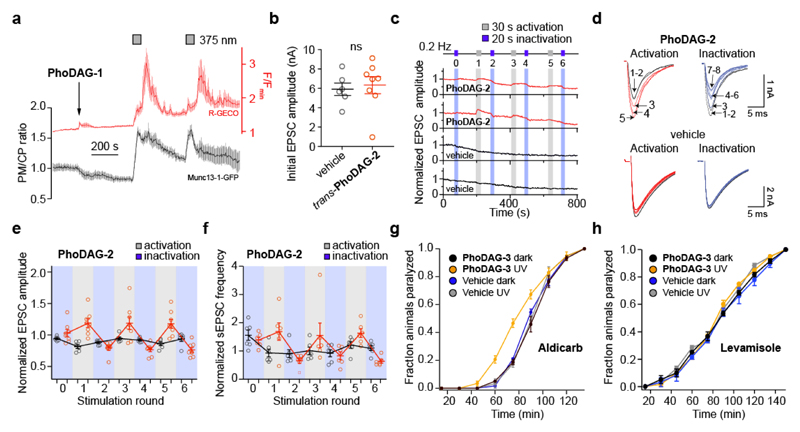
DAG is known as a regulator of neuronal activity9,52. Multiple downstream effectors of DAG signaling have been described13, including the PKC-dependent phosphorylation of Munc18 and the direct binding of DAG to Munc13 proteins, and have been linked to an increase in synaptic transmission53,54. Munc13s function as essential priming factors for synaptic vesicles, preparing them for fusion with the plasma membrane at the active zone, thereby allowing the release of neurotransmitters into the synaptic cleft10–12. We found that PhoDAG-1 could indeed trigger the translocation of the fluorescent translocation reporter Munc13-1-GFP towards the plasma membrane on photoactivation in HeLa cells over multiple cycles (Fig. 6a). The DAG-insensitive Munc13-1H567K-GFP mutant reporter10 did not respond to PhoDAG-1 with UV-A stimulation (Supplementary Fig. 14).
Figure 6. PhoDAGs enable optical control of Munc13 and synaptic transmission.
(a) In HeLa cells, PhoDAG-1 (150 μM) triggered the reversible translocation of Munc13-1-GFP on photoactivation with λ = 375 nm irradiation (n = 14) towards the outer plasma membrane. (b-f) Wild type mouse hippocampal neurons were pre-incubated with PhoDAG-2 (500 μM, 20-25 min at 37 °C). The neurons were whole-cell voltage clamped and action potentials were stimulated at 0.2 Hz to evoke excitatory post synaptic currents (EPSCs). (b) The application of trans-PhoDAG-2 (red, n = 8) did not affect the initial EPSC amplitudes measured when compared to control neurons (black, n = 6). (c) Photoactivation of PhoDAG-2-treated neurons with λ = 365 nm light caused an increase in the EPSC amplitude while deactivation with λ = 425 nm light reversed the effect, plotted for two neurons pre-incubated with PhoDAG-2 (red) and for two control neurons (black). (d) Representative traces of EPSCs during activation and inactivation. Numbers are given to indicate the EPSC number. Black traces – before activation, red or blue traces – beginning of photostimulation. (e,f) The normalized change in (e) the EPSC amplitude (red = PhoDAG-2, n = 8; black = vehicle, n = 6) and (f) sEPSC frequency (red = PhoDAG-2, n = 6; black = vehicle, n = 6) over six rounds of alternating activation and inactivation. The averaged response following illumination was divided by the averaged response before illumination, and the ratios for all neurons measured are presented by open circles. (g) Caenorhabditis elegans were subjected to aldicarb (1 mM) after cultivation with or without PhoDAG-3 (1 mM). Nematodes (n = 3 experiments with 20 animals each) that were exposed to PhoDAG-3 (yellow) and UV-A irradiation became paralyzed more rapidly when compared to animals without UV-A exposure (black). The paralysis rate was not affected by UV-A irradiation alone (blue, gray). (h) Nematodes were exposed to levamisole (0.1 mM), after cultivation with or without PhoDAG-3 (1 mM). Those that were exposed to PhoDAG-3 (yellow) did not show any change in sensitivity to the drug with or without irradiation when compared to animals cultivated with EtOH only (vehicle) (n = 3 experiments with 20 animals, each). A Mann-Whitney test was used to determine statistical significance. Error bars were calculated as s.e.m.
We then examined the effects of all three PhoDAGs in primary cultures of mouse autaptic hippocampal neurons. In this case, PhoDAG-2 produced the most dramatic and reproducible effect on synaptic transmission. At day in vitro 14-16, neurons were incubated with PhoDAG-2, and were whole-cell voltage clamped directly post-incubation. The efficacy of synaptic transmission was monitored by recording evoked excitatory postsynaptic currents (EPSCs) that were elicited by depolarization-induced action potentials at a frequency of 0.2 Hz. The initial EPSC amplitude was not affected by the presence of trans-PhoDAG-2 when compared to control neurons (Fig. 6b). Irradiation of the trans-compound with blue light also did not affect the EPSC amplitude (Fig. 6c, blue bar ‘0’). However, on activation with λ = 365 nm light (30 s), we observed a prominent increase in the EPSC amplitude (Fig. 6c,d). This activation was sustained until inactivation with λ = 425 nm light (20 s) as applied, during which we observed a rapid and significant decrease of the EPSC amplitude. Such an effect was absent in control neurons and could be repeated over multiple cycles with little to no decay in activity. The first activation of PhoDAG-2 led to a 1.19±0.07-fold increase of the EPSC amplitude, and was similar in the following two rounds of activation (1.19±0.1 fold and 1.18±0.07 fold) (Fig. 6e). Similarly, the first inactivation led to a decrease of the EPSC amplitude to 0.8±0.03 fold of the initial EPSC amplitude, and was similar in the two following cycles (0.77±0.03 and 0.76±0.03 fold respectively). We did not observe any change in the series resistance of the patch pipette during activation or inactivation of PhoDAG-2, which could have generated artifacts mimicking increases or decreases in the EPSC size (Supplementary Fig. 15). Similarly, PhoDAG-2 affected the frequency of spontaneous miniature postsynaptic currents (sEPSCs), pointing to an acute effect on the presynaptic release machinery (Fig. 6f). An increase in the sEPSC frequency was observed during periods of activation, by 1.68±0.3, 1.55±0.4 and 1.62±0.2 fold over three rounds. Inactivation led to a decrease in the sEPSC frequency, by 0.65±0.1 fold, 0.82±0.14 fold, and 0.63±0.06 fold over three inactivation cycles, respectively. PhoDAG-3 produced similar results (Supplementary Fig. 16), however the variability of the response of the neurons to photoactivation was larger, and some neurons did not respond consistently during all rounds of activation/inactivation. PhoDAG-1 did not yield a consistent effect on synaptic transmission, likely due to its’ limited solubility at these concentrations during incubation.
PhoDAG-3 enhances the synaptic output at the neuromuscular junction of Caenorhabditis elegans
Caenorhabditis elegans has been used extensively to study mechanisms of synaptic transmission55. At the neuromuscular junction, acetylcholine is released from cholinergic motor neurons and activates post-synaptic cholinergic receptors of the body-wall muscles, inducing muscle contraction56. This process is terminated by the action of acetylcholinesterase. Sensitivity to Aldicarb, an acetylcholinesterase inhibitor, is therefore commonly used to study synaptic transmission at the neuromuscular junction57. C. elegans become hypersensitive to aldicarb under conditions of excess acetylcholine release and display faster onset of paralysis. Animals cultivated in the presence of cis-PhoDAG-3 (1 mM) showed a faster onset of paralysis induced by aldicarb (1 mM) as compared to animals cultivated only with ethanol (vehicle), with or without UV-A irradiation. Animals that were exposed to trans-PhoDAG-3 showed no Aldicarb hypersensitivity (Fig. 6g).
To exclude post-synaptic effects (e.g. a possible PhoDAG-3-induced increase in the sensitivity of muscular nicotinic acetylcholine receptors (nAChRs)), we used levamisole, which paralyzes animals due to hyperstimulation of muscle-specific nAChRs58,59. Animals grown in the presence of trans- or cis-PhoDAG-3 showed similar rates of levamisole-induced paralysis when compared to the vehicle control (Fig. 6h). These results suggest that PhoDAG-3 enables optical control of pre-synaptic transmission via modulating neurotransmitter release at the C. elegans neuromuscular junction.
Discussion
In this study, we have demonstrated that the PhoDAGs are versatile tools for controlling DAG signaling in a variety of experimental settings, and can even be applied in vivo. For all three compounds in different preparations, an increase in efficacy is triggered by photoisomerization to the cis-configuration. Photoisomerization to cis- leads to an increased dipole moment and a more bent orientation60, and we hypothesize that these changes mimic a change from a less bent (ex. saturated) fatty acid, to a highly bent acyl chain like arachidonic acid. Effectively, this action mimics an increase in DAG levels on the membrane, potentially by making the headgroup more accessible for C1 domain binding. Furthermore, these results enforce our hypothesis that cis-FAAzo-4 is capable of mimicking arachidonic acid.
The length of each acyl chain is crucial, as hydrophobicity determines the compound localization and site of activity. As it likely remains trapped on the plasma membrane, PhoDAG-1 upon illumination induces the translocation of C1 domain-containing proteins towards periphery of the cell. We envision that PhoDAG-1 could be used as a general tool, by virtue of C1-fusion, to translocate other effector proteins towards the plasma membrane in a reversible manner. Hence, this approach could be extended to other kinases, lipases, or glycosidases, and could be invaluable in understanding how plasma membrane localization affects these proteins. Although the less hydrophobic PhoDAG-2 and PhoDAG-3 triggered translocation towards intracellular membranes preferentially, we demonstrated that this does not limit their utility. As photochromic ligands, they are applied to cells extracellularly without the need for genetic manipulation. Although their activity cannot be genetically targeted to specific organelles, activation can still be induced with the spatial precision of light, enabling specific cells or organelles to be activated on command.
As with the metabolic generation of endogenous DAGs, the PhoDAGs can be used to stimulate a mosaic of effector proteins, similar to the downstream activation of the Gq-pathway. Although the small dynamic range of the CKAR sensor might limit our detection of PKC phosphorylation to quite low activation levels, our results in more complex systems suggest that the PhoDAGs indeed are capable of stimulating the cell in a physiologically relevant manner. In pancreatic β-cells, DAG signaling can be manipulated with a degree of precision and reproducibility currently unavailable to other chemical tools. These effects likely involve the activation of PKC alongside other partners including Munc13, leading to the modulation of glucose-stimulated Ca2+ oscillations via effects on Kv/Cav channels, intracellular Ca2+ stores, the SNARE apparatus, granule sensitivity and combinations thereof51. Similarly, our experiments in both hippocampal neurons and C. elegans suggest that PhoDAGs increases neurotransmitter release by affecting the pre-synaptic release machinery. PhoDAG isomerization to cis presumably leads to the activation of Munc13 or the phosphorylation of Munc189,54, which in turn increases vesicle release. Combined, these results demonstrate that the PhoDAGs can be used to study the effects of DAG on the exocytosis of both hormones and neurotransmitters.
Most notably, the PhoDAGs revealed the cell and tissue-context of DAG signaling in pancreatic β-cells. When PhoDAGs are activated on the inner membranes, an overall decrease in the Ca2+ oscillation frequency is observed, which could be explained by a reduction in the whole-cell Cav current. Conversely, DAG-activation on the outer plasma membrane of dissociated β-cells preferentially leads to an increase in oscillation speed, which could be attributed to their affect on Kv conductance. Similar effects were also observed for the uncaging of arachidonic acid on the inner vs outer cell membranes of MIN6 cells23, which is not surprising given the metabolic connection between these two lipids. The divergent effects observed between MIN6 and dissociated β-cells highlight the importance of the acyl chain length for DAG activity. This may stem from subtle differences in ion channel expression, membrane composition, and endogenous DAG levels between immortalized and primary cells. In the case of intact islets, a greater amount of extracellular matrix likely increases the surface availability of both long- and short-chain PhoDAGs, resulting in a reduced effect on the Cav channels. This work highlights the limitations of model cell lines, and may explain some of the contrasting reports in the literature on the effects of DAG in pancreatic β-cells.
The PhoDAGs permit control over C1-containg proteins with unmatched spatiotemporal precision. They possess the main advantage of caged DAGs, as they can be applied to cells in the inactive trans-configuration where their activity can be switched ON in seconds with a light stimulus. Importantly, these tools stand alone in their ability to switch OFF. This characteristic will enable researchers to mimic the natural oscillations observed in both DAG levels and PKC activation, in a fully time-controlled fashion32. As the PhoDAGs require high energy UV-A irradiation to become activated, their use could be partially restricted to primary research applications due to the cytotoxicity associated with high intensity UV-A light. Future studies will be directed towards preparing “red-shifted” PhoDAGs61. This will permit the use of longer wavelength, and lower energy irradiation for photoactivation. This deeper-penetrating light will increase the PhoDAGs applicability in more complex intact tissues, and as potential therapeutics.
As a lipid precursor, DAG is incorporated into a collection of more complicated glycerolipids that serve as structural components, protein anchors, and signaling molecules. We expect that novel photolipids built around the DAG scaffold will emerge as useful tools for the optical control of a variety of proteins, alongside the membranes with which they interact.
Methods
List of utilized cDNA constructs
| Name | Characterization |
|---|---|
| R-GECO24 | Red intensiometric Ca2+ sensor |
| C1-GFP21 | Green DAG-sensing translocation probe |
| PKCδ-RFP* | Protein kinase C δ reporter |
| PKCα-GFP30 | Protein kinase C α reporter |
| CKAR32 | Cytosolic C kinase activity reporter |
| Munc13-1-GFP10 | Munc13-1 translocation reporter |
| Munc13-1H567K-GFP10 | Munc13-1H567K mutant translocation reporter |
The PKCδ-RFP construct was prepared by exchanging the eGFP from the original construct62 with mRFP via the EcoRI and EcoRV sites in the MCS of pcDNA3 backbone.
Cell culture
HeLa Kyoto cells were grown in 1.0 g/L glucose Dulbecco's Modified Eagle Medium (DMEM, GIBCO, cat # 31885-023) supplied with 10% FBS (GIBCO, cat # 10270-106) and 0.1 mg/mL antibiotic Primocin (Invitrogen, cat # ant-pm-1). HeLa cells were first seeded in an 8-well Lab-Tek™ chambered coverslip (ThermoScientific # 155411) 24-48 h before transfection at 37 °C and 5% CO2. Transfection was carried out with FugeneHD (Promega, cat # E2311) in DMEM free of FBS and antibiotic according to the manufacturer's instructions. First, the media was aspirated and the wells were charged with DMEM media (200 μL per well). A transfection solution containing DMEM (20 μL per well), cDNA (300 ng total DNA per well) and FugeneHD (1.5 μL per well) was then added to each well of the 8-well Lab-Tek™. Cells were incubated at 37 °C and 5% CO2 for 20-24 h before the microscopy experiments were performed.
The mouse insulinoma derived cell line, MIN6, used in this study was initially developed and provided as a kind gift by Miyazaki et al.42. The cells were grown at 37 °C and 5% CO2 in high glucose Dulbecco's Modified Eagle Medium (DMEM, 41965-039, Life Technologies) supplied with 15% Fetal Bovine Serum (FBS, 10270098, Lifetechnologies), penicillin-streptomycin (Pen Strep, 100 U/mL, 15140122, Lifetechnologies) and β-mercaptoethanol (70 μM, P07-05100, PAN-Biotech) that was always added freshly to the cell culture flasks. Cells were seeded in 8-well Lab-Tek™ microscope dishes 48-64 h (to reach 50-80% confluence) prior to imaging. For Ca2+ imaging, MIN6 cells were transfected with cDNA coding for the R-GECO24 Ca2+ reporter, and cDNA coding for the C1-GFP21 DAG sensor (as a control) usually 24-48 h after seeding. A transfection cocktail of C1-GFP (200 ng per well) and R-GECO (200 ng per well) in Opti-MEM (20 μL per well, 31985-070, Life Technologies) and Lipofectamine2000® transfection reagent (1.5 μL per well, 11668030, Life Technologies) was added to each well of an 8-well Lab-Tek™ microscope dish loaded with 200 μL Opti-MEM (37 °C, immediately before the addition). After 24 h incubation at 37 °C and 8.5% CO2, the media was exchanged to culture media, followed by incubation for another 24 h before the microscopy experiments were performed.
Culture of primary mouse pancreatic islets
Islets were isolated from C57BL6 mice using collagenase digestion, as previously detailed63. Briefly, following euthanasia by cervical dislocation, the bile duct was injected with a collagenase solution (1 mg/mL) before digestion at 37 °C for 10 min and separation of islets using a Histopaque gradient (1.083 and 1.077 g/mL). Islets were cultured for 24-72 h in Roswell Park Memorial Institute (RPMI) medium supplemented with 10% fetal calf serum (FCS), 100 U/mL penicillin and 100 μg/mL streptomycin. Islets were dissociated into single β-cells using trypsin digestion for 5 min at 37 °C and allowed to attach to poly-L-lysine-coated and acid-etched coverslips. All animal work was regulated by the Home Office according to the Animals Act 1986 (Scientific Procedures) of the United Kingdom (PPL 70/7349, Dr Isabelle Leclerc), as well as EU Directive 2010/63/EU.
Laser scanning confocal microscopy
The cells were incubated in 250 μL imaging buffer containing (in mM): 115 NaCl, 1.2 CaCl2, 1.2 MgCl2, 1.2 K2HPO4, 20 HEPES, glucose (20 for MIN6, 11 for islets and β-cells unless otherwise stated), adjusted to pH 7.4 with NaOH at 37 °C and 5% CO2 for at least 10 min. Compounds were first solubilized in DMSO at a concentration of 10 mM. This stock (2-5 μL) was then diluted into imaging buffer (50 μL) and added directly to the well containing the cells in imaging buffer.
Imaging of HeLa, MIN6, or primary rodent pancreatic β-cells was performed cells was performed on one of two microscopes: 1) Olympus Fluoview 1200 with a 20x objective, or a 63x oil objective. GFP excitation was performed with λ = 488 nm laser at low laser power (<3%) and emission was collected at λ = 500-550 nm. CFP excitation was performed with a λ = 405 nm laser at low laser power and emission was collected at λ = 425-475 nm. For FRET experiments, YFP emission was collected at λ = 510-560 nm. RFP/R-GECO excitation was performed with a λ = 559 nm laser at low laser power (<3%) and emission was collected at λ = 570-670 nm. Compound irradiation at λ = 375 nm was triggered using the quench function in the Olympus software. Photoactivation was carried out with λ = 375 nm laser at 100% intensity. 2) Zeiss Axiovert M200 coupled to a Yokogawa CSU10 spinning disk head and 10x and 20x objectives. Fluo-2 excitation was performed using a solid-state λ = 491 nm laser, and emission was collected using a highly sensitive back-illuminated EM-CCD (Hammamatsu C9100-13) at λ = 500-550 nm. Photoactivation was carried out using an X-Cite 120 epifluorescence source and a λ = 350±20 nm band-pass filter. Images were processed with Fiji software (http://fiji.sc/Fiji) and the resulting data was analyzed in Microsoft Excel, MATLAB and R. The data were then plotted with Igor Pro, Origin and R.
Quantification of insulin secretion
Insulin secretion was measured using static incubation of 6-8 islets for 30 min at 37 °C in Krebs-HEPES bicarbonate solution containing (in mM): 130 NaCl, 3.6 KCl, 1.5 CaCl2, 0.5 MgSO4, 0.5 NaH2PO4, 2 NaHCO3, 10 HEPES and 0.1% (wt/vol) bovine serum albumin, pH 7.464. Treatments were applied as indicated, and photoswitching performed at λ = 340±10 nm using a BMG Fluostar Optima platereader. Insulin concentration secreted into the supernatant was determined using a homogeneous time-resolved fluorescence (HTRF) assay (Cisbio), according to the manufacturer’s instructions and low-range protocol.
Whole-cell electrophysiology in MIN6 and dissociated β-cells
MIN6 cells (passage 26-33) were cultured as described above at 37 °C and 5% CO2. For cell detachment, the medium was removed and the cells were washed with Ca2+-free PBS buffer and treated with trypsin for 5 min at 37 °C. The detached cells were diluted in growth medium and plated on acid-etched coverslips in a 24-well plate. 50,000 cells were added to each well in 500 μL growth medium. The growth medium was exchanged every 48 h, and electrophysiological experiments were carried out 2-7 days later.
Whole cell patch clamp experiments were performed using a standard electrophysiology setup equipped with a HEKA Patch Clamp EPC10 USB amplifier and PatchMaster software (HEKA Electronik). Micropipettes were generated from “Science Products GB200-F-8P with filament” pipettes using a Narishige PC-10 vertical puller. The patch pipette resistance varied between 4-7 MΩ. For recording of the Ca2+-channel current44, the bath solution contained (in mM): 82 NaCl, 20 tetraethylammonium chloride, 0.1 tolbutamide, 30 CaCl2, 5 CsCl, 1 MgCl2, 0.1 EGTA, 10 glucose, 5 HEPES (adjusted to pH 7.4 with NaOH). The intracellular solution contained (in mM): 102 CsCl, 10 tetraethylammonium chloride, 0.1 tolbutamide, 10 EGTA, 1 MgCl2, 3 Na2ATP, 5 HEPES (adjusted to pH 7.4 with CsOH). In voltage clamp mode, voltage steps were applied to the cells from the baseline at −70 mV to +50 mV in 10 mV intervals for 0.5 s. All cells had a leak current below 15 pA on break-in at −70 mV. For recording of the Kv current, the bath solution contained (in mM): 119 NaCl, 2 CaCl2, 4.7 KCl, 10 HEPES, 1.2 MgSO4, 1.2 KH2PO4, 14.4 glucose (adjusted to pH 7.3 with NaOH). The intracellular solution contained (in mM): 140 KCl, 1 MgCl2, 10 EGTA, 10 HEPES, 5 MgATP (adjusted to pH 7.25 with KOH). The data was analyzed in Igor Pro using the Patcher`s Power Tools (MPI Göttingen) plugin. Current values were extrapolated and processed in Microscoft Excel, and the results were again plotted in Igor Pro.
Electrophysiology in mouse hippocampal neurons
Microisland cultures of wild type mouse hippocampal neurons were prepared as described65. For experiments, a 12-well plate was filled with 480 μL/well of extracellular recording solution contained (in mM): 140 NaCl, 2.4 KCl, 10 HEPES, 10 glucose, 4 CaCl2, and 4 MgCl2 (320 mOsmol/L), and 20 μL of a 12.5 M stock solution of PhoDAG-2 or PhoDAG-3 in DMSO was added. For controls, 20 μL of DMSO were added. The coverslips containing DIV14-16 neurons were broken and a piece was moved into one well in the 12 well plate. The neurons were incubated at 37 °C, and 5% CO2 for 10 min with PhoDAG-3 and respective controls; or for 20-25 min for PhoDAG-2 and respective controls. For vehicle controls, neurons from the same culture were incubated in DMSO for the same time. Beyond these times, we did not find a correlation between the length of incubation and the presence of an effect or its strength. Longer incubation periods of >1 h resulted in astrocyte death. In the case of PhoDAG-2 patching the incubated neurons was usually easier 1 h after the stock solution was diluted in the extracellular solution. 3-4 coverslips were subsequently incubated in one well where either PhoDAG-2 or PhoDAG-3 were diluted.
Whole-cell voltage clamp recordings were acquired using the Axon Multiclamp 700B amplifier, Digidata 1440A data acquisition system, and the pCLAMP 10 software (Molecular Devices). The standard internal solution contained (in mM): 136 KCl, 17.8 HEPES, 1 EGTA, 4.6 MgCl2, 4 NaATP, 0.3 Na2GTP, 15 creatine phosphate, and 5 U/mL phosphocreatine kinase (315–320 mOsmol/liter), pH 7.4. EPSCs were evoked by depolarizing the cell from −70 to 0 mV for 2 ms. The sEPSCs were derived from the traces where EPSCs were recorded (last 600 ms of a 1 s recording) and were recorded without tetrodotoxin (TTX). However, in the autapse-system, sEPSCs predominantly represent miniature EPSCs Light illumination was performed by a CoolLED pE-2 lamp that was fixed to the setup. Photoactivation was performed at λ = 365 nm (80% strength) and inactivation at λ = 425 nm (40% strength). All analyses were performed using Axograph 1.4.3.
Aldicarb assay
Caenorhabditis elegans wild-type (N2) strain was cultivated at 20 °C on nematode growth medium (NGM) plates seeded with E. coli strain OP50-166. A 100 mM stock solution of PhoDAG-3 was prepared in 100% Ethanol. For application to C.elegans, the stock solution was diluted to the working concentration of 1 mM PhoDAG-3 using OP50-1 and 200 μL of the resulting solution was applied to the NGM plate. For the vehicle control, an equivalent volume of 100% EtOH was used instead of the stock solution. L4 stage larvae were picked onto 1mM PhoDAG-3/EtOH NGM plates and left overnight. The young adult hermaphrodites were used on the following day for the aldicarb and levamisole-sensitivity assays57,59. The assay was performed in the dark, except for the picking and counting of animals which was performed under red light. To study aldicarb or levamisole sensitivity, 20 animals were transferred onto NGM plates containing 1 mM aldicarb (Sigma) or 0.1 mM tetramisole hydrochloride (Racemic form of levamisole, Sigma) and the fraction of animals paralysed was scored every 15 min by assessing movement following three gentle touches with a platinum wire. The animals were illuminated with UV-A light (366 nm, 18 μW/mm2) provided by a UV-A lamp (Benda, Wiesloch, Germany) for the first 5 min after being placed on the aldicarb/levamsiole plates and then subsequently for the last 3 min of each 15 min time interval. The assays were performed blinded regarding the absence/presence of PhoDAG-3, and on the same day with the same batch of aldicarb or levamisole plates.
Synthetic protocols
All reagents and solvents were purchased from commercial sources (Sigma-Aldrich, TCI Europe N.V., Strem Chemicals, etc.) and were used without further purification unless otherwise noted. Tetrahydrofuran (THF) was distilled under a N2 atmosphere from Na/benzophenone prior to use. Triethylamine (NEt3), was distilled under a N2 atmosphere from CaH2 prior to use. Other dry solvents such as ethyl acetate (EtOAc), dichloromethane (CH2Cl2) and toluene (PhMe) were purchased from Acros Organics as "extra dry" reagents and used as received. Reactions were monitored by thin layer chromatography (TLC) on pre-coated, Merck Silica gel 60 F254 glass backed plates and the chromatograms were first visualized by UV-A irradiation at 254 nm, followed by staining with aqueous ninhydrin, anisaldehyde or ceric ammonium molybdate solution, and finally gentle heating with a heat gun. Flash silica gel chromatography was performed using silica gel (SiO2, particle size 40-63 μm) purchased from Merck.
UV-Vis spectra were recorded using a Varian Cary 50 Bio UV-Visible Spectrophotometer with Helma SUPRASIL precision cuvettes (10 mm light path). All compounds were dissolved at a concentration of 25 μM in DMSO. Switching was achieved using a Polychrome V (Till Photonics) monochromator. The illumination was controlled using PolyCon3.1 software and the light was guided through a fiber-optic cable with the tip pointed directly into the top of the sample cuvette. An initial spectrum was recorded (dark adapted state, black) and then again following illumination at the λmax for the π-π* transition (λ = 350 nm) for 3 min (cis-adapted state, purple). A third spectrum was recorded after irradiation at the λmax for the n-π* transition (λ = 450 nm) for 3 min (trans-adapted state, blue).
All NMR spectra were measured on a BRUKER Avance III HD 400 equipped with a CryoProbe™. Multiplicities in the following experimental procedures are abbreviated as follows: s = singlet, d = doublet, t = triplet, q = quartet, quint = quintet, sext = sextet, hept = heptet, br = broad, m = multiplet. Proton chemical shifts are expressed in parts per million (ppm, δ scale) and are referenced to the residual protium in the NMR solvent (CDCl3: δ = 7.26). Carbon chemical shifts are expressed in ppm (δ scale) and are referenced to the carbon resonance of the NMR solvent (CDCl3: δ = 77.16). NOTE: Due to the trans/cis equilibrium of some compounds containing an azobenzene functionality, more signals were observed in the 1H and 13C spectra than would be expected for the pure trans-isomer. Only signals for the major trans-isomer are reported, however the identities of the remaining peaks were verified by 2D COSY, HSQC and HMBC experiments. NMR spectra are displayed in Supplementary Figures 17-25.
Infrared spectra (IR) were recorded as neat materials on a PERKIN ELMER Spectrum BX-59343 instrument. For detection a SMITHS DETECTION DuraSam-plIR II Diamond ATR sensor was used. The measured wave numbers are reported in cm-1.
Low- and high-resolution EI mass spectra were obtained on a MAT CH7A mass spectrometer. Low- and high-resolution ESI mass spectra were obtained on a Varian MAT 711 MS instrument operating in either positive or negative ionization modes.
Synthesis of S-2,3-O-isopropylidene-1-O-stearoyl-sn-glycerol (2)
S-2,3-O-Isopropylidene-1-O-stearoyl-sn-glycerol (2) was prepared using a modified procedure as previously described by Gaffney et al.67 Spectral characteristics matched those previously reported68.
R(-)-2,3-O-Isopropylidene-sn-glycerol (2.85 g, 22.0 mmol, 1.0 equiv.) and 4-(dimethylamino)pyridine (DMAP, 268 mg, 2.20 mmol, 0.1 equiv.) were dissolved in dry CH2Cl2 (75 mL) under an argon atmosphere. To this solution was added dry NEt3 (6.16 mL, 4.48 g, 44.0 mmol, 2.0 equiv.) and the reaction was cooled to 0 °C. Stearoyl chloride was dissolved in dry CH2Cl2 (25 mL) and slowly added to the previously prepared solution. The reaction was allowed to slowly warm to room temperature and stirred for 2 h. H2O (28 mL) was slowly added and the biphasic solution was stirred rapidly for 10 min. The phases were then separated, and the organic phase was washed with aqueous HCl (2 M, 50 mL), followed by saturated aqueous NaHCO3 (2x50 mL) and brine (2x50 mL) solutions. The organic phase was then dried over anhydrous Na2SO4 and filtered. The filtrate was then concentrated and purified by flash silica gel chromatography (150 g SiO2, 20:1 hexane:EtOAc) to yield S-2,3-O-isopropylidene-1-O-stearoyl-sn-glycerol (2, 6.99 g, 81%) as an off-white solid.
Synthesis of 1-O-stearoyl-3-O-triethylsilyl-sn-glycerol (3)
1-O-stearoyl-3-O-triethylsilyl-sn-glycerol (3) was prepared using a modified procedure as previously described by Nadler et al.15 Spectral characteristics matched those previously reported.
S-2,3-O-Isopropylidene-1-O-stearoyl-sn-glycerol (2, 500 mg, 1.25 mmol, 1.0 equiv.) was dissolved in dry 1,2-dichloroethane (DCE, 20 mL) under an argon atmosphere. N,N-Diisopropylethylamine (DIPEA, 1.20 mL, 6.88 mmol), followed by triethylsilyl trifluoromethanesulfonate (TESOTf, 496 mg, 0.425 mL, 1.88 mmol, 1.5 equiv.) were added at room temperature and the reaction was stirred at 90 °C. After 1 h, a second portion of TESOTf (169 mg, 0.145 mL, 0.5 equiv.) was added and the reaction was stirred at 90 °C for 2.5 h. Upon consumption of the starting material as determined by TLC analysis, the solution was cooled to room temperature, diluted with EtOAc, and then washed with aqueous hydrochloric acid (0.1 M, 50 mL) and brine (50% saturated, 2x50 mL). The organic phase was concentrated under reduced pressure and the resulting oil was dissolved in THF (20 mL). To this solution was added an aqueous Na2CO3 solution (10%, 10 mL) followed by I2 (610 mg, 2.4 mmol, 1.95 equiv.). The solution was stirred rapidly for 2.5 h at room temperature. A further portion of I2 was added (300 mg, 1.2 mmol, 1.0 equiv.) and the solution was stirred at room temperature for 1 h. The solution was diluted with EtOAc (50 mL) and washed with saturated aqueous Na2S2O3 (50 mL), water (2x50 mL) and brine (50 mL) solutions. The organic phase was then dried over anhydrous sodium sulfate and filtered. The filtrate was concentrated under reduced pressure and the resulting oil was purified by flash column chromatography (50 g SiO2, 20:1 hexanes:EtOAc) to yield 1-O-stearoyl-3-O-triethylsilyl-sn-glycerol (3, 412 mg, 69%) as a colorless liquid.
TLC (10:1 hexanes:EtOAc): Rf = 0.23.
1H NMR (CDCl3, 400 MHz, 25 °C): δ 4.18 (m, 2 H, H1Ga,b), 3.92-3.82 (m, 1 H, H2G), 3.67 (dd, 1 H, H3Ga, J = 10.3 Hz, 4.5 Hz), 3.60 (dd, 1 H, H3Gb, J = 10.0 Hz, 5.7 Hz), 2.55 (d, 1 H, OH, J = 5.3 Hz), 2.33 (t, 2 H, H2Sa,b, J = 7.6 Hz), 1.66-1.58 (m, 2 H, H3Sa,b), 1.34-1.20 (m, 28 H, 14xCH2(stearoyl)), 0.96 (t, 9 H, 3xCH3(TES), J = 7.8 Hz), 0.88 (t, 3 H, H18Sa,b,c, J = 6.9 Hz), 0.61 (q, 6 H, 3xCH2(TES), J = 7.9 Hz).
13C NMR (CDCl3, 100 MHz, 25 °C): δ 174.1 (C1S), 70.2 (C2G), 65.1 (C1G), 63.5 (C3G), 34.3 (C2S), 32.1 (Calk), 29.9-29.7 (m, Calk), 29.6 (Calk), 29.5 (Calk), 29.4 (Calk), 29.3 (Calk), 25.1 (C3S), 22.9 (Calk), 14.3 (C18S), 6.8 (3C, 3xCH3(TES)), 4.4 (3C, 3xCH2(TES)).
HRMS (ESI+): m/z calcd. for [C27H56NaO4Si]+: 495.3846, found: 495.3850 ([M+Na]+).
Synthesis of 2-O-(4-(4-((4-butylphenyl)diazenyl)phenyl)butanoyl)-1-O-stearoyl-3-O-triethylsilyl-sn-glycerol (4)
FAAzo-419 (1.08 g, 3.3 mmol, 2.0 equiv.), N-(3-dimethylaminopropyl)-N′-ethylcarbodiimide (EDC, 773 mg, 4.38 mmol, 3.0 equiv.) and DMAP (20.2 mg, 166 μmol, 0.1 equiv.) were dissolved in dry CH2Cl2 (50 mL) under an argon atmosphere. This solution was stirred at room temperature for 15 min. After cooling to 0 °C, a solution of 1-O-stearoyl-3-O-triethylsilyl-sn-glycerol (3, 787 mg, 1.66 mmol, 1.0 equiv.) in dry CH2Cl2 (30 mL) was slowly added. The solution was warmed to room temperature and stirred overnight under an argon atmosphere. The solution was then diluted with CH2Cl2 (200 mL) and washed with water (2x100 mL) and brine (100 mL). The solution was then filtered and the filtrate was concentrated under reduced pressure. The resulting red oil was purified by flash silica gel chromatography (170 g SiO2, 30:1 hexanes:EtOAc) to yield 2-O-(4-(4-((4-butylphenyl)diazenyl)phenyl)butanoyl)-1-O-stearoyl-3-O-triethylsilyl-sn-glycerol (4, 944 mg, 72%) as a red oil.
TLC (10:1 hexanes:EtOAc): Rf = 0.50.
1H NMR (CDCl3, 400 MHz, 25 °C): δ 7.85-7.80 (m, 4 H, H7Aa,b, H12Aa,b), 7.31 (d, 4 H, H6Aa,b, H13Aa,b, J = 8.2 Hz), 5.13-5.05 (m, 1 H, H2G), 4.38 (dd, 1 H, H1Ga, J = 12.1 Hz, 3.6 Hz), 4.17 (dd, 1 H, H1Gb, J = 12.1 Hz, 6.1 Hz), 3.73 (d, 2 H, H3Ga,b, J = 5.3 Hz), 2.73 (t, 2 H, H4Aa,b, J = 7.7 Hz), 2.69 (t, 2 H, H15Aa,b, J = 7.8 Hz), 2.37 (t, 2 H, H2Aa,b, J = 7.5 Hz), 2.29 (t, 2 H, H2Sa,b, J = 7.6 Hz), 2.00 (quin, 2 H, H3Aa,b, J = 7.4 Hz), 1.69-1.53 (m, 4 H, H3Sa,b, H16Aa,b), 1.43-1.34 (m, 2 H, H17Aa,b), 1.33-1.21 (m, 28 H, H17Sa,b, 13xCH2(Stear)), 0.97-0.85 (m, 15 H, H18Aa,b,c, H17Sa,b,c, 3xCH3(TES)), 0.59 (q, 6 H, 3xCH2(TES), J = 8.0 Hz).
13C NMR (CDCl3, 100 MHz, 25 °C): δ 173.7 (C1S), 172.8 (C1A), 151.4 (CAzo), 151.1 (CAzo), 146.5 (CAzo), 144.6 (CAzo), 129.3 (2 C, CAzo), 129.2 (2 C, CAzo), 123.0 (2 C, CAzo), 122.9 (2 C, CAzo), 72.1 (C2G), 62.6 (C3G), 61.3 (C1G), 35.7 (C15A), 35.0 (C4A), 34.3 (C2S), 33.7 (C2A), 33.6 (C2S), 32.1 (C3S), 29.9-29.7 (m, CAlk), 29.6 (CAlk), 29.5 (CAlk), 29.4 (CAlk), 29.3 (CAlk), 26.5 (C3A), 25.1 (C16A), 22.9 (C17S), 22.5 (C17A), 14.3 (C18S), 14.1 (C18A), 6.8 (3 C, 3xCH3(TES)), 4.4 (3 C, 3xCH2(TES)).
HRMS (EI+): m/z calcd. for [C20H24N2O2]+: 778.5680, found: 778.5675 ([M-e-]+).
Synthesis of 2-O-(4-(4-((4-butylphenyl)diazenyl)phenyl)butanoyl)-1-O-stearoyl-sn-glycerol (PhoDAG-1)
2-O-(4-(4-((4-Butylphenyl)diazenyl)phenyl)butanoyl)-1-O-stearoyl-3-O-triethylsilyl-sn-glycerol (4, 500 mg, 0.641 mmol, 1.0 equiv.) was first dissolved in CH2Cl2 (5 mL) and added to a solution of FeCl2·6H2O (5 mM in 25 mL 3:1 MeOH:CH2Cl2). This solution was stirred at room temperature for 30 min. The solution was then diluted with EtOAc (200 mL) and washed with water (2x200 mL). The organic phase was then dried over Na2SO4. The mixture was filtered and the filtrate was concentrated under reduced pressure. The resulting oil was purified by flash silica gel chromatography (3:1 hexanes:EtOAc) to yield 2-O-(4-(4-((4-butylphenyl)diazenyl)phenyl)butanoyl)-1-O-stearoyl-sn-glycerol (PhoDAG-1, 0.425 mg, quant.) as an orange solid. Note: Short reaction times and quick chromatography are essential to avoid acyl chain migration.
TLC (3:1 hexanes:EtOAc): Rf = 0.45 (trans), 0.35 (cis).
1H NMR (CDCl3, 400 MHz, 25 °C): δ 7.85-7.80 (m, 4 H, H7Aa,b, H12Aa,b), 7.31 (d, 4 H, H6Aa,b, H13Aa,b, J = 8.1 Hz), 5.10 (quin, 1 H, H2G, J = 5.1 Hz), 4.34 (dd, 1 H, H3Ga, J = 11.9 Hz, 4.5 Hz), 4.24 (dd, 1 H, H3Gb, J = 12.0 Hz, 5.8 Hz), 3.73 (t, 2 H, H1Ga,b, J = 5.2 Hz), 2.74 (t, 2 H, H4Aa,b, J = 7.6 Hz), 2.69 (t, 2 H, H15Aa,b, J = 7.6 Hz), 2.40 (t, 2 H, H2Aa,b, J = 7.3 Hz), 2.32 (t, 2 H, H2Sa,b, J = 7.5 Hz), 2.06-1.97 (m, 2 H, H3Aa,b), 1.69-1.51 (m, 4 H, H16Aa,b, H3Sa,b), 1.44-1.32 (m, 2 H, H17Aa,b), 1.34-1.18 (m, 28 H, H17Sa,b, 28xHSAlk), 0.94 (t, 3 H, H18Aa,b,c, J = 7.1 Hz), 0.88 (t, 3 H, H18Sa,b,c, J = 7.1 Hz).
13C NMR (CDCl3, 100 MHz, 25 °C): δ 174.0 (C1S), 173.1 (C1A), 151.5 (CAzo), 151.1 (CAzo), 146.5 (CAzo), 144.4 (CAzo), 129.3 (2 C, CAzo), 129.2 (2 C, CAzo), 123.0 (2 C, CAzo), 122.9 (2 C, CAzo), 72.4 (C2G), 62.1 (C3G), 61.6 (C1G), 35.7 (C15A), 35.0 (C4A), 34.2 (C2S), 33.6 (C2A), 33.6 (C3S), 29.9-29.7 (m, CAlk), 29.6 (CAlk), 29.5 (CAlk), 29.4 (CAlk), 29.3 (CAlk), 26.4 (C3A), 25.0 (C16A), 22.9 (C17S), 22.5 (C17A), 14.3 (C18S), 14.1 (C18A).
IR (neat, ATR): ṽ = 3483, 2955, 2917, 2850, 1728, 1711, 1601, 1499, 1472, 1460, 1414, 1379, 1256, 1235, 1214, 1188, 1173, 1138, 1096, 1068, 1052, 1031, 1012, 962, 888, 832, 718, 679.
HRMS (EI+): m/z calcd. for [C20H24N2O2]+: 324.1838, found: 324.1834 ([M-e-]+).
UV-Vis (25 μM in DMSO): λmax(π-π*) = 340 nm. λmax(n-π*) = 442 nm (Fig. 1e).
Melting point (°C): 66.5-67.2.
Synthesis of S-2,3-O-isopropylidene-1-O-octanoyl-sn-glycerol (5)
Octanoic acid (490 mg, 3.4 mmol, 1.5 equiv.) was first dissolved in dry CH2Cl2 (10 mL) under an argon atmosphere and then NEt3 (0.310 mL, 2.27 mmol, 1 equiv.) and DMAP (27.7 mg, 0.227 mmol, 0.1 equiv.) were added. The solution was then cooled to 0 °C and then N,N'-dicyclohexylcarbodiimide (DCC, 1.171 mg, 5.68 mmol, 2.5 equiv.) was added. This mixture was stirred at 0 °C for 30 min and then the R(-)-2,3-O-Isopropylidene-sn-glycerol (0.280 mL, 2.27 mmol, 1.0 equiv.) was added. The solution was stirred for a further 2 h, and then was diluted with CH2Cl2 and washed once with a saturated aqueous NaHCO3 solution, and twice with H2O. The organic phase was then dried over Na2SO4 and filtered. The filtrate was concentrated under reduced pressure and the resulting oil was purified by flash silica gel chromatography (30 g SiO2, pre-adsorbed on 1.5 g of SiO2, 40:1 to 10:1 hexanes:EtOAc) to yield S-2,3-O-isopropylidene-1-O-octanoyl-sn-glycerol (5, 537.3 mg, 92%) as a colorless oil.
TLC (20:1 hexanes:EtOAc): Rf = 0.09.
1H NMR (CDCl3, 400 MHz, 25 °C): δ 4.32-4.24 (m, 1 H, H2G), 4.17-4.09 (m, 1 H, HG1a), 4.09-4.00 (m, 2 H, HG1b, HG3a), 3.73-3.68 (m, 1H, H3b) 2.31 (t, 2 H, H2La,b, J = 7.3 Hz), 1.65-1.54 (m, 2 H, H3La,b), 1.40-1.33 (s, 6 H, 2xHCH3), 1.31-1.17 (m, 8 H, Halk), 0.84 (t, 3 H, H8La,b,c, J = 6.7 Hz).
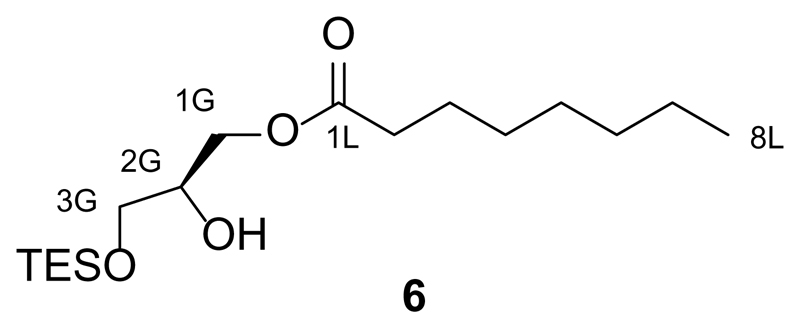
Synthesis of 1-O-octanoyl-3-O-triethylsilyl-sn-glycerol (6)
S-2,3-O-isopropylidene-1-O-octanoyl-sn-glycerol (5, 453.2 mg, 1.75 mmol, 1.0 equiv.) was first dissolved in dry 1,2-dichloroethane (6 mL) under an argon atmosphere and then dry N,N-diisopropylethylamine (DIPEA, 1.5 mL, 9.65 mmol, 5.5 equiv.) was added to the solution. The solution was then warmed to 90 °C and TESOTf (1.4 mL, 6.13 mmol, 3.5 equiv.) was added and the reaction stirred for 2 h. The mixture was then diluted with EtOAc (60 mL) and washed with aqueous HCl (0.1 M, 60 mL) and then H2O (2x60 mL). The organic phase was then dried over Na2SO4 and filtered. The filtrate was concentrated under reduced pressure. The resulting oil was dissolved in THF (8 mL) and then aqueous Na2CO3 (4 mL, 10% w/w) and I2 (1.110 g, 4.38 mmol, 2.5 equiv.) were added to the solution. The reaction was stirred for 75 min at room temperature, and was then diluted with EtOAc (70 mL) and washed once with saturated aqueous Na2S2O3 (70 mL) and H2O (2x70 mL). The organic phase was dried over Na2SO4 and filtered. The filtrate was concentrated under reduced pressure and the resulting oil was purified by flash silica gel chromatography (60 g SiO2, 20:1→15:1→10:1 hexanes:EtOAc) to yield 1-O-octanoyl-3-O-triethylsilyl-sn-glycerol (6, 211 mg, 36%) as a colourless oil.
TLC (9:1 hexanes:EtOAc): Rf = 0.30.
1H NMR (CDCl3, 400 MHz, 25 °C): δ 4.19-4.08 (m, 2 H, H1Ga,b), 3.98-3.87 (m, 1 H, H2G), 3.63 (dd, 1 H, H3Ga, J1 = 10.5 Hz, J2 = 5.3 Hz), 3.56 (dd, 1 H, H3Gb, J1 = 10.3 Hz, J2 = 5.4 Hz), 2.69 (d, 1 H, OH, J = 5.4 Hz), 2.34 (t, 2 H, H2a,b, J = 7.5 Hz), 1.67-1.58 (m, 2 H, H3a,b), 1.34-1.20 (m, 8 H, Halk), 0.96 (t, 9 H, 3xCH3(TES), J = 7.9 Hz), 0.87 (t, 3 H, H8a,b,c, J = 6.9 Hz), 0.61 (q, 6 H, 3xCH2(TES), J = 7.9 Hz).
13C NMR (CDCl3, 100 MHz, 25 °C): δ 174.1 (C1L), 70.2 (CXG), 65.1 (CXG), 63.5 (CXG), 34.3 (C2), 31.8 (Calk), 29.2 (Calk), 29.1 (Calk), 25.1 (Calk), 22.8 (C7L), 14.2 (C8L), 6.8 (3C, 3xCH3(TES)), 4.4 (3C, 3xCH2(TES)).
IR (neat, ATR): ṽ = 3489, 2955, 2929, 2876, 1740, 1458, 1416, 1380, 1239, 1166, 1100, 1006, 976, 842, 807, 744, 728, 676, 619, 588, 601, 564.
HRMS (ESI+): m/z calcd. for [C17H37O4Si]+: 333.2461, found: 333.2460 ([M+H+]+).
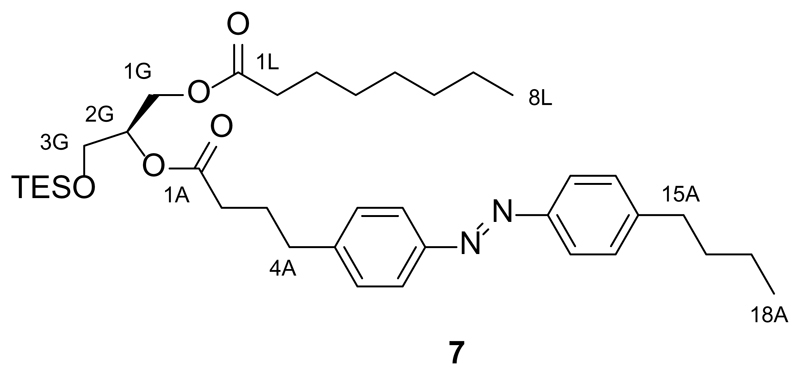
Synthesis of 2-O-(4-(4-((4-butylphenyl)diazenyl)phenyl)butanoyl)-1-O-octanoyl-3-O-triethylsilyl-sn-glycerol (7)
FAAzo-419 (136.3 mg, 0.42 mmol, 2.0 equiv.) was dissolved in dry CH2Cl2 (12 mL) under an argon atmosphere, and then DMAP (5.13 mg, 0.042 mmol, 0.1 equiv.) and EDC (0.11 mL, 0.63 mmol, 3.0 equiv.) were added. The solution was stirred at room temperature for 20 min and then 1-O-octanoyl-3-O-triethylsilyl-sn-glycerol (6, 68.9 mg, 0.21 mmol, 1.0 equiv.) was added. The solution was stirred overnight at room temperature, diluted with CH2Cl2 and then washed three times with H2O. The organic phase was dried over Na2SO4, filtered, and the filtrate was concentrated under reduced pressure. The resulting dark orange oil was purified by flash silica gel chromatography (15 g SiO2, hexanes:EtOAc 20:1→10:1) to yield 2-O-(4-(4-((4-butylphenyl)diazenyl)phenyl)butanoyl)-1-O-octanoyl-3-O-triethylsilyl-sn-glycerol (7, 77.4 mg, 58%) as an orange oil.
TLC (3:1 hexanes:EtOAc): Rf = 0.48 (trans), 0.30 (cis).
1H NMR (CDCl3, 400 MHz, 25 °C): δ 7.87-7.79 (m, 4 H, H7Aa,b, H12Aa,b), 7.31 (d, 4 H, H6Aa,b, H13Aa,b, J = 8.7 Hz), 5.14-5.05 (m, 1 H, H2G), 4.42-4.33 (m, 1H, H1Ga), 4.23-4.13 (m, 1 H, H1Gb), 3.77-3.69 (m, 2 H, H3Ga,b), 2.78-2.67 (m, 4 H, H4Aa,b, H15Aa,b), 2.37 (t, 2 H, H1Aa,b, J = 7.1 Hz), 2.30 (t, 2 H, H2La,b, J = 7.3 Hz), 2.07-1.95 (m, 2 H, H3Aa,b), 1.69-1.52 (m, 4 H, H3La,b, H16Aa,b), 1.44-1.33 (m, 2 H, H17Aa,b), 1.33-1.19 (m, 8 H, Halk), 0.99-0.90 (m, 12 H, H18Aa,b,c, 3xCH3(TES)), 0.86 (t, 3 H, H8La,b,c), 0.59 (q, 6 H, 3xCH2(TES), J = 8.0 Hz).
13C NMR (CDCl3, 100 MHz, 25 °C): δ 173.6 (C1S), 172.8 (C1A), 151.4 (CAzo), 151.9 (CAzo), 146.4 (CAzo), 144.6 (CAzo), 129.3 (2 C, CAzo), 129.2 (2 C, CAzo), 123.0 (2 C, CAzo), 122.9 (2 C, CAzo), 72.1 (C2G), 62.6 (C3G), 61.3 (C1G), 35.7 (C15A), 35.0 (C4A), 34.3 (C2A), 33.63 (C2A), 33.59 (C3A), 31.8 (C3L), 29.2 (CAlk), 29.1 (CAlk), 26.5 (CAlk), 25.0 (CAlk), 22.7 (CAlk), 22.5 (CAlk), 14.2 (C18L), 14.1 (C18A), 6.8 (3 C, 3xCH3(TES)), 4.4 (3 C, 3xCH2(TES)).
IR (neat, ATR): ṽ = 3028, 2955, 2930, 2874, 2859, 1918, 1739, 1602, 1580, 1498, 1458, 1416, 1378, 1302, 1240, 1226, 1156, 1145, 1104, 1013, 977, 844, 800, 744, 728, 674, 642, 618, 601, 571, 564.
HRMS (ESI+): m/z calcd. for [C37H59N2O5Si]+: 639.4193, found: 639.4142 ([M+H+]+).
Synthesis of 2-O-(4-(4-((4-butylphenyl)diazenyl)phenyl)butanoyl)-1-O-octanoyl-sn-glycerol (PhoDAG-2)
2-O-(4-(4-((4-butylphenyl)diazenyl)phenyl)butanoyl)-1-O-octanoyl-sn-glycerol (PhoDAG-2) was prepared from 2-O-(4-(4-((4-butylphenyl)diazenyl)phenyl)butanoyl)-1-O-octanoyl-3-O-triethylsilyl-sn-glycerol (7, 28.0 mg, 0.044 mmol, 1.0 equiv.) as described above in the synthesis of 2-O-(4-(4-((4-butylphenyl)diazenyl)phenyl)butanoyl)-1-O-stearoyl-sn-glycerol (PhoDAG-1). PhoDAG-2 (13.3 mg, 66%) was isolated as an orange oil. NOTE: all reactants and reagents were scaled according to molarity.
TLC (2:1 hexanes:EtOAc): Rf : 0.39 (trans), 0.28 (cis).
1H NMR (CDCl3, 400 MHz, 25 °C): δ 7.86-7.79 (m, 4 H, H7Aa,b, H12Aa,b), 7.31 (d, 4 H, H6Aa,b, H13Aa,b, J = 8.7 Hz), 5.15-5.05 (m, 1 H, H2G), 4.37-4.30 (m, 1H, H3Ga), 4.27-4.20 (m, 1 H, H3Gb), 3.76-3.70 (m, 2 H, H1Ga,b), 2.74 (t, 2 H, H4Aa,b, J = 7.5 Hz), 2.69 (t, 2 H, H15Aa,b, J = 7.8 Hz), 2.40 (t, 2 H, H2Aa,b, J = 7.5 Hz), 2.36-2.29 (m, 2 H, H2La,b), 2.07-1.97 (m, 3 H, H3Aa,b), 1.70-1.50 (m, 4 H, H16Aa,b, HL3a,b), 1.44-1.18 (m, 10 H, Halk), 0.93 (t, 3 H, H18Aa,b,c, J = 7.3 Hz), 0.90-0.81 (t, 3 H, H8La,b,c, J = 7.6 Hz).
13C NMR (CDCl3, 100 MHz, 25 °C): δ 174.0 (C1L), 173.0 (C1A), 152.8 (CAzo), 151.3 (CAzo), 146.5 (CAzo), 144.4 (CAzo), 129.3 (2 C, CAzo), 129.2 (2 C, CAzo), 123.9 (2 C, CAzo), 122.9 (2 C, Cazo), 72.4 (C2G), 62.1 (C3G), 61.6 (C1G), 35.7 (C15A), 35.0 (C4A), 34.2 (C2L), 33.61 (CAlk), 33.58 (CAlk), 31.8 (CAlk), 29.2 (CAlk), 29.1 (CAlk), 26.4 (C3A), 25.0 (C3L), 22.7 (C7L), 22.5 (C17A), 14.2 (C8L), 14.1 (C18A).
IR (neat, ATR): ṽ = 3466, 2956, 2929, 2858, 1739, 1602, 1498, 1458, 1417, 1378, 1225, 1159, 1103, 1051, 1014, 844, 728, 634, 614, 591, 576, 568.
HRMS (EI+): m/z calcd. for [C31H44N2O5]+: 524.3250, found: 524.3245 ([M-e-]+).
UV-Vis (50 μM in DMSO): λmax(π-π*) = 340 nm. λmax(n-π*) = 440 nm.
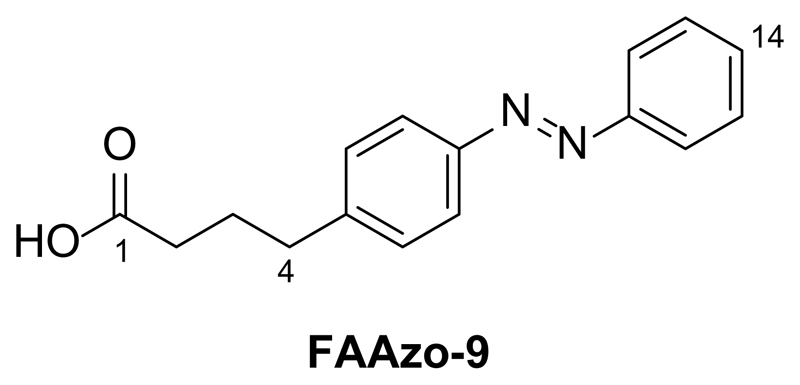
Synthesis of 4-(Phenyldiazenyl)phenyl butanoic acid (FAAzo-9)
4-(4-aminophenyl)butyric acid (200 mg, 1.12 mmol, 1.0 equiv.) was first dissolved in CH2Cl2 (20 mL). Nitrosobenzene (143.4 mg, 1.34 mmol, 1.2 eq) and AcOH (5 mL) were added, and the solution was then stirred at room temperature overnight. The solvents were then removed under reduced pressure. The resulting crude residue was purified by flash silica gel chromatography (20 g SiO2, 99:1 CH2Cl2:AcOH) to yield 4-(phenyldiazenyl)phenyl butanoic acid (FAAzo-9, 320.8 mg, quant.) as an orange solid.
TLC (99:1 CH2Cl2:AcOH): Rf = 0.17.
1H NMR (CDCl3, 400 MHz, 25 °C): δ 7.94-7.82 (m, 4 H, H7a,b, H11a,b), 7.55-7.43 (m, 3 H, H13a,b, H14), 7.34 (d, 2 H, H6a,b, J6,7 = 4.0 Hz), 2.76 (t, 2 H, H4a,b, J4,3 = 7.8 Hz), 2.42 (t, 2 H, H2a,b, J2,3 = 7.3 Hz), 2.02 (dd, 2 H, H3a,b, J2,3 = 7.3 Hz, J4,3 = 7.8 Hz).
13C NMR (CDCl3, 100 MHz, 25 °C): δ 178.7 (C1), 152.8 (C11), 151.4 (C8), 144.8 (C5), 131.0 (C14), 129.4-129.2 (4 C, C6a,b, C13a,b), 123.2-122.9 (4 C, C7a,b, C12a,b), 35.0 (C4), 33.2 (C2), 26.2 (C3).
IR (neat, ATR): ṽ = 3041, 2944, 1693, 1601, 1500, 1486, 1462, 1439, 1411, 1339, 1303, 1282, 1252, 1215, 1152, 1106, 1071, 1020, 914, 851, 822, 787, 764, 745, 732, 684, 638, 616, 577, 561.
HRMS (EI+): m/z calcd. for [C16H16N2O2]+: 268.1212, found: 268.1206 ([M-e-]+).
UV-Vis (50 μM in DMSO): λmax(π-π*) = 330 nm. λmax(n-π*) = 425 nm.
Melting point (°C): 135.5 - 137.5.
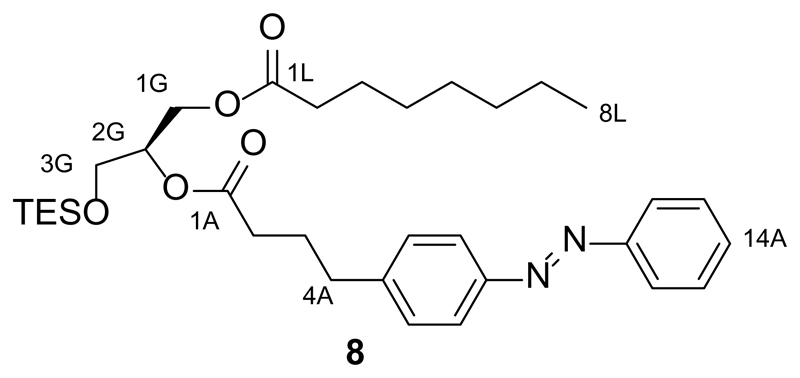
Synthesis of 2-O-(4-(4-(phenyldiazenyl)phenyl)butanoyl)-1-O-octanoyl-3-O-triethylsilyl-sn-glycerol (8)
4-(Phenyldiazenyl)phenyl butanoic acid (FAAzo-9, 153.4 mg, 0.57 mmol, 2.0 equiv.) was dissolved in dry CH2Cl2 (15 mL) under an argon atmosphere. DMAP (3.4 mg, 0.028 mmol, 0.1 equiv.) and EDC (0.15 mL, 0.84 mmol, 3.0 equiv.) were then added to the solution. The mixture was stirred at room temperature for 20 min and then 1-O-octanoyl-3-O-triethylsilyl-sn-glycerol (6, 95.1 mg, 0.28 mmol, 1.0 equiv.) was added. The solution was stirred overnight at room temperature, and was then diluted with CH2Cl2 (100 mL) and washed with H2O (3x50 mL). The organic phase was dried over Na2SO4 and then filtered. The filtrate was concentrated under reduced pressure. The residue was purified by flash silica gel chromatography (20 g SiO2, hexanes:ethyl acetate 20:1→10:1) to yield 2-O-(4-(4-(phenyldiazenyl)phenyl)butanoyl)-1-O-octanoyl-3-O-triethylsilyl-sn-glycerol (8, 100 mg, 61%) as an orange oil.
TLC (9:1 hexanes:EtOAc): Rf = 0.43 (trans), 0.25 (cis).
1H NMR (CDCl3, 400 MHz, 25 °C): δ 7.94-7.83 (m, 4 H, H7Aa,b, H12Aa,b), 7.55-7.43 (m, 3 H, H14A, H13Aa,b), 7.33 (d, 2 H, H6Aa,b, J = 8.2 Hz), 5.15-5.05 (m, 1 H, H2G), 4.41-4.33 (m, 1H, H1Ga), 4.22-4.13 (m, 1 H, H1Gb), 3.78-3.69 (m, 2 H, H3Ga,b), 2.74 (t, 2 H, H4Aa,b, J = 7.2 Hz), 2.38 (t, 2 H, H2A, J = 7.6 Hz), 2.30 (t, 2 H, H2La,b, J = 7.5 Hz), 2.08-1.96 (m, 2 H, H3Aa,b), 1.64-1.54 (m, 2 H, H3La,b), 1.34-1.19 (m, 8 H, HAlk), 0.94 (t, 9 H, 3xCH3(TES), J = 8.3 Hz), 0.90-0.82 (t, 3 H, H8La,b,c, J = 6.9 Hz), 0.59 (m, 6 H, 3xCH2(TES), J = 8.2 Hz).
13C NMR (CDCl3, 100 MHz, 25 °C): δ 173.6 (C1L), 172.8 (C1A), 152.8 (CAzo), 151.3 (CAzo), 145.0 (CAzo), 131.0 (CAzo), 129.3 (2C, CAzo), 129.2 (2 C, CAzo), 123.1 (2 C, CAzo), 122.9 (2 C, CAzo), 72.1 (C2G), 62.6 (C3G), 61.3 (C1G), 35.0 (C4A), 34.3 (C2L), 33.6 (C2A), 31.8 (CAlk), 29.2 (CAlk), 29.1 (CAlk), 26.5 (CAlk), 25.0 (CAlk), 22.7 (C7L), 14.2 (C8L), 6.8 (3 C, 3xCH3(TES)), 4.4 (3 C, 3xCH2(TES)).
IR (neat, ATR): ṽ = 2955, 2930, 2875, 1738, 1603, 1500, 1458, 1415, 1378, 1300, 1240, 1225, 1144, 1103, 1070, 1004, 847, 797, 743, 727, 688, 638, 616, 598, 563.
HRMS (ESI+): m/z calcd. for [C33H51N2O5Si]+: 583.3567, found: 583.3567 ([M+H+]+).
Synthesis of 2-O-(4-(4-(phenyldiazenyl)phenyl)butanoyl)-1-O-octanoyl-sn-glycerol (PhoDAG-3)
2-O-(4-(4-(phenyldiazenyl)phenyl)butanoyl)-1-O-octanoyl-sn-glycerol (PhoDAG-3) was prepared from 2-O-(4-(4-(phenyldiazenyl)phenyl)butanoyl)-1-O-octanoyl-3-O-triethylsilyl-sn-glycerol (8, 22.0 mg, 0.038 mmol, 1 equiv.) as described above in the synthesis of 2-O-(4-(4-((4-butylphenyl)diazenyl)phenyl)butanoyl)-1-O-stearoyl-sn-glycerol (PhoDAG-1). PhoDAG-3 (17.7 mg, quant.) was isolated as an orange oil. NOTE: all reactants and reagents were scaled according to molarity.
TLC (9:1 hexanes:ethyl acetate): Rf = 0.20 (trans), 0.18 (cis).
1H NMR (CDCl3, 400 MHz, 25 °C): δ 7.93-7.83 (m, 4 H, H7Aa,b, H11Aa,b), 7.55-7.43 (m, 3 H, H14A, H13Aa,b), 7.33 (d, 2 H, H6Aa,b, J = 8.3 Hz), 5.14-5.04 (q, 1 H, H2G, J = 4.9 Hz), 4.38-4.29 (m, 1 H, H3Ga), 4.27-4.19 (m, 1 H, H3Gb), 3.78-3.68 (m, 2 H, H1Ga,b), 2.75 (t, 2 H, H4Aa,b, J = 7.7 Hz), 2.40 (t, 2 H, H2Aa,b, J = 7.7 Hz), 2.32 (t, 2 H, H2La,b, J = 7.7 Hz), 2.07-1.96 (m, 2 H, H3Aa,b), 1.65-1.55 (m, 2 H, H3La,b), 1.34-1.20 (m, 8 H, Halk), 0.90-0.82 (t, 3 H, H8La,b,c, J = 7.1 Hz).
13C NMR (CDCl3, 100 MHz, 25 °C): δ 173.4 (C1L), 173.0 (C1A), 152.8 (CAzo), 151.3 (CAzo), 144.8 (CAzo), 130.9 (CAzo), 129.3 (2 C, CAzo), 129.2 (2 C, CAzo), 123.2 (2 C, CAzo), 122.9 (2 C, CAzo), 72.4 (C2G), 62.1 (C3G), 61.6 (C1G), 35.0 (C4A), 34.2 (C2L), 33.6 (2 C, C2A, C14A), 31.8 (C6L), 29.2 (CAlk), 29.0 (CAlk), 26.4 (CAlk), 25.0 (CAlk), 22.7 (C7A), 14.2 (C8A).
IR (neat, ATR): ṽ =3466, 2928, 2857, 1739, 1603, 1458, 1416, 1377, 1224, 1157, 1104, 1052, 847, 768, 690, 615, 601, 590, 568, 554.
HRMS (EI+): m/z calcd. for [C27H36N2O5]+: 468.2624, found: 468.2622 ([M-e-]+).
UV-Vis (50 μM in DMSO): λmax(π-π*) = 325 nm. λmax(n-π*) = 440 nm.
Supplementary Material
Acknowledgments
DT and JAF gratefully acknowledge the Deutsche Forschungsgemeinschaft (SFB 1032, TRR 152) and the European Research Council (ERC Advanced Grant 268795 to DT) for financial support. DAY acknowledges the EIPOD Programme at EMBL. DJH was supported by Diabetes UK R.D. Lawrence (12/0004431) and EFSD/Novo Nordisk Rising Star Fellowships, and an MRC Project Grant (MR/N00275X/1) with GAR. DJH and GAR were also supported by Imperial Confidence in Concept (ICiC) Grants. GAR was supported by Wellcome Trust Senior Investigator (WT098424AIA) and Royal Society Wolfson Research Merit Awards, by MRC Programme (MR/J0003042/1; MR/L020149/1; MR/L02036X/1), Biological and Biotechnology Research Council (BB/J015873/1) and Diabetes UK (11/0004210; 15/0005275) project grants. This work was partly supported by Transregio 83 (to CS) funded by the Deutsche Forschungsgemeinschaft. JN was supported by Deutsche Forschungsgemeinschaft (DFG) grants FOR1279 (GO1011/4-1 and 4-2) and Cluster of Excellence Frankfurt (EXC115) (to AG). We thank Dr. Martin Sumser, Dr. Johannes Broichhagen, and Dr. Timm Fehrentz for insightful discussions leading to the preparation of the manuscript; and Margherita Duca, Simone Wouters, Ryan Mitchell and Natalie Johnston for experimental assistance. We are grateful for the technical support of EMBL’s Advanced Light Microscopy Facility.
Footnotes
Author Contributions
DT and CS coordinated and supervised the study. JAF designed and synthesized the compounds. JAF, DAY, and DJH carried out imaging and secretion experiments. GAR provided reagents and assisted with data analysis. JAF and NL performed electrophysiological experiments. JN performed experiments in C. elegans under the supervision of AG. JSR and NB coordinated and supervised electrophysiological recordings. JAF prepared the manuscript with contributions from all other co-authors.
Competing Financial Interests
The authors declare no competing financial interests.
References
- 1.Almena M, Mérida I. Shaping up the membrane: diacylglycerol coordinates spatial orientation of signaling. Trends Biochem Sci. 2011;36:593–603. doi: 10.1016/j.tibs.2011.06.005. [DOI] [PubMed] [Google Scholar]
- 2.Brose N, Rosenmund C. Move over protein kinase C, you’ve got company: alternative cellular effectors of diacylglycerol and phorbol esters. J Cell Sci. 2002;115:4399–4411. doi: 10.1242/jcs.00122. [DOI] [PubMed] [Google Scholar]
- 3.Newton AC. Protein Kinase C : Structure, Function, and Regulation. J Biol Chem. 1995;270:28495–28498. doi: 10.1074/jbc.270.48.28495. [DOI] [PubMed] [Google Scholar]
- 4.Pessin MS, Raben DM. Molecular species analysis of 1,2-diglycerides stimulated by alpha-thrombin in cultured fibroblasts. J Biol Chem. 1989;264:8729–8738. [PubMed] [Google Scholar]
- 5.Marignani PA, Epand RM, Sebaldt RJ. Acyl Chain Dependence of Diacylglycerol Activation of Protein Kinase C Activity in Vitro. Biochem Biophys Res Commun. 1996;473:469–473. doi: 10.1006/bbrc.1996.1196. [DOI] [PubMed] [Google Scholar]
- 6.Hofmann T, et al. Direct activation of human TRPC6 and TRPC3 channels by diacylglycerol. Nature. 1999;397:259–263. doi: 10.1038/16711. [DOI] [PubMed] [Google Scholar]
- 7.Das J, Rahman GM. C1 Domains : Structure and Ligand-Binding Properties. Chem Rev. 2012;114:12108–12131. doi: 10.1021/cr300481j. [DOI] [PubMed] [Google Scholar]
- 8.Coussens L, et al. Multiple, distinct forms of bovine and human protein kinase C suggest diversity in cellular signaling pathways. Science. 1986;233:859–866. doi: 10.1126/science.3755548. [DOI] [PubMed] [Google Scholar]
- 9.Rhee JS, et al. β phorbol ester- and diacylglycerol-induced augmentation of transmitter release is mediated by Munc13s and not by PKCs. Cell. 2002;108:121–133. doi: 10.1016/s0092-8674(01)00635-3. [DOI] [PubMed] [Google Scholar]
- 10.Betz A, et al. Munc13-1 is a presynaptic phorbol ester receptor that enhances neurotransmitter release. Neuron. 1998;21:123–136. doi: 10.1016/s0896-6273(00)80520-6. [DOI] [PubMed] [Google Scholar]
- 11.Brose N, Hofmann K, Hata Y, Sudhof TC. Mammalian homologues of Caenorhabditis elegans unc-13 gene define novel family of C2-domain proteins. J Biol Chem. 1995;270:25273–25280. doi: 10.1074/jbc.270.42.25273. [DOI] [PubMed] [Google Scholar]
- 12.Varoqueaux F, et al. Total arrest of spontaneous and evoked synaptic transmission but normal synaptogenesis in the absence of Munc13-mediated vesicle priming. Proc Natl Acad Sci U S A. 2002;99:9037–42. doi: 10.1073/pnas.122623799. [DOI] [PMC free article] [PubMed] [Google Scholar]
- 13.Brose N, Betz A, Wegmeyer H. Divergent and convergent signaling by the diacylglycerol second messenger pathway in mammals. Curr Opin Neurobiol. 2004;14:328–340. doi: 10.1016/j.conb.2004.05.006. [DOI] [PubMed] [Google Scholar]
- 14.Wender P, et al. Modeling of the bryostatins to the phorbol ester pharmacophore on protein kinase C. Proc Natl Acad Sci U S A. 1988;85:7197–7201. doi: 10.1073/pnas.85.19.7197. [DOI] [PMC free article] [PubMed] [Google Scholar]
- 15.Nadler A, et al. The fatty acid composition of diacylglycerols determines local signaling patterns. Angew Chem Int Ed Engl. 2013;52:6330–4. doi: 10.1002/anie.201301716. [DOI] [PubMed] [Google Scholar]
- 16.Putyrski M, Schultz C. Protein translocation as a tool: The current rapamycin story. FEBS Lett. 2012;586:2097–2105. doi: 10.1016/j.febslet.2012.04.061. [DOI] [PubMed] [Google Scholar]
- 17.Feng S, et al. A rapidly reversible chemical dimerizer system to study lipid signaling in living cells. Angew Chemie - Int Ed. 2014;53:6720–6723. doi: 10.1002/anie.201402294. [DOI] [PubMed] [Google Scholar]
- 18.Toettcher JE, Voigt C, Weiner OD, Lim W. The promise of optogenetics in cell biology: interrogating molecular circuits in space and time. Nat Methods. 2012;8:35–38. doi: 10.1038/nmeth.f.326. [DOI] [PMC free article] [PubMed] [Google Scholar]
- 19.Frank JA, et al. Photoswitchable fatty acids enable optical control of TRPV1. Nat Commun. 2015;6:7118. doi: 10.1038/ncomms8118. [DOI] [PMC free article] [PubMed] [Google Scholar]
- 20.Davis RJ, Ganongq BR, Belll RM, Czech MP. 1,2-Dioctanoylglycerol. J Biol Chem. 1985;260:1562–1566. [PubMed] [Google Scholar]
- 21.Oancea E, Teruel MN, Quest AFG, Meyer T. Green fluorescent protein (GFP)-tagged cysteine-rich domains from protein kinase C as fluorescent indicators for diacylglycerol signaling in living cells. J Cell Biol. 1998;140:485–498. doi: 10.1083/jcb.140.3.485. [DOI] [PMC free article] [PubMed] [Google Scholar]
- 22.Wuttke A, Idevall-Hagren O, Tengholm A. P2Y1 receptor-dependent diacylglycerol signaling microdomains in beta cells promote insulin secretion. FASEB J. 2013;27:1610–1620. doi: 10.1096/fj.12-221499. [DOI] [PubMed] [Google Scholar]
- 23.Nadler A, et al. Exclusive photorelease of signalling lipids at the plasma membrane. Nat Commun. 2015;6 doi: 10.1038/ncomms10056. 10056. [DOI] [PMC free article] [PubMed] [Google Scholar]
- 24.Zhao Y, et al. An Expanded Palette of Genetically Encoded Ca2+ Indicators. Science. 2011;557:1888–1891. doi: 10.1126/science.1208592. [DOI] [PMC free article] [PubMed] [Google Scholar]
- 25.Harteneck C, Gollasch M. Pharmacological Modulation of Diacylglycerol-Sensitive TRPC3/6/7 Channels. Curr Pharm Biotechnol. 2011;12:35–41. doi: 10.2174/138920111793937943. [DOI] [PMC free article] [PubMed] [Google Scholar]
- 26.Plenge-Tellechea F, Soler F. On the inhibition mechanism of sarcoplasmic or endoplasmic reticulum Ca2+-ATPases by cyclopiazonic acid. J Biol Chem. 1997;272:2794–2800. doi: 10.1074/jbc.272.5.2794. [DOI] [PubMed] [Google Scholar]
- 27.Bootman MD, Young KW, Young JM, Moreton RB, Berridge MJ. Extracellular calcium concentration controls the frequency of intracellular calcium spiking independently of inositol 1,4,5-trisphosphate production in HeLa cells. Biochem J. 1996;314:347–354. doi: 10.1042/bj3140347. [DOI] [PMC free article] [PubMed] [Google Scholar]
- 28.Corbalán-García S, Gómez-Fernández JC. Protein kinase C regulatory domains: The art of decoding many different signals in membranes. Biochim Biophys Acta - Mol Cell Biol Lipids. 2006;1761:633–654. doi: 10.1016/j.bbalip.2006.04.015. [DOI] [PubMed] [Google Scholar]
- 29.Kikkawa U, Matsuzaki H, Yamamoto T. Protein kinase C delta (PKC delta): activation mechanisms and functions. J Biochem. 2002;132:831–839. doi: 10.1093/oxfordjournals.jbchem.a003294. [DOI] [PubMed] [Google Scholar]
- 30.Reither G, Schaefer M, Lipp P. PKCalpha: A versatile key for decoding the cellular calcium toolkit. J Cell Biol. 2006;174:521–533. doi: 10.1083/jcb.200604033. [DOI] [PMC free article] [PubMed] [Google Scholar]
- 31.Violin JD, Newton AC. Pathway illuminated: visualizing protein kinase C signaling. IUBMB Life. 2003;55:653–660. doi: 10.1080/152165401310001642216. [DOI] [PubMed] [Google Scholar]
- 32.Violin JD, Zhang J, Tsien RY, Newton AC. A genetically encoded fluorescent reporter reveals oscillatory phosphorylation by protein kinase C. J Cell Biol. 2003;161:899–909. doi: 10.1083/jcb.200302125. [DOI] [PMC free article] [PubMed] [Google Scholar]
- 33.Toullecs D, et al. The Bisindolemaleimide GF 109203X is a Potent and Selective Inhibitor of Protein Kinase C. J Biol Chem. 1991;266:15771–15781. [PubMed] [Google Scholar]
- 34.Herbert JM, Augereau JM, Gleye J, Maffrand JP. Chelerythrine is a potent and specific inhibitor of protein kinase C. Biochem Biophys Res Commun. 1990;172:993–999. doi: 10.1016/0006-291x(90)91544-3. [DOI] [PubMed] [Google Scholar]
- 35.Bergsten P. Slow and fast oscillations of cytoplasmic Ca2+ in pancreatic islets correspond to pulsatile insulin release. Am J Physiol. 1995;268:E282–E287. doi: 10.1152/ajpendo.1995.268.2.E282. [DOI] [PubMed] [Google Scholar]
- 36.Bergsten P, Grapengiesser E, Gylfe E, Tengholm A, Hellman B. Synchronous oscillations of cytoplasmic Ca2+ and insulin release in glucose-stimulated pancreatic islets. J Biol Chem. 1994;269:8749–8753. [PubMed] [Google Scholar]
- 37.Rorsman P, Braun M. Regulation of Insulin Secretion in Human Pancreatic Islets. Annu Rev Physiol. 2012;75:155–179. doi: 10.1146/annurev-physiol-030212-183754. [DOI] [PubMed] [Google Scholar]
- 38.Wuttke A. Lipid Signalling Dynamics at the β-cell Plasma Membrane. Basic Clin Pharmacol Toxicol. 2015;116:281–290. doi: 10.1111/bcpt.12369. [DOI] [PubMed] [Google Scholar]
- 39.Yang C, Kazanietz MG. Divergence and complexities in DAG signaling: Looking beyond PKC. Trends Pharmacol Sci. 2003;24:602–608. doi: 10.1016/j.tips.2003.09.003. [DOI] [PubMed] [Google Scholar]
- 40.Kaneko YK, Ishikawa T. Diacylglycerol Signaling Pathway in Pancreatic β -Cells : An Essential Role of Diacylglycerol Kinase in the Regulation of Insulin Secretion. Biol Pharm Bull. 2015;38:669–673. doi: 10.1248/bpb.b15-00060. [DOI] [PubMed] [Google Scholar]
- 41.Kurohane Kaneko Y, et al. Depression of Type I Diacylglycerol Kinases in Pancreatic β-Cells From Male Mice Results in Impaired Insulin Secretion. Endocrinology. 2013;154:4089–4098. doi: 10.1210/en.2013-1356. [DOI] [PubMed] [Google Scholar]
- 42.Ishihara H, et al. Pancreatic beta cell line MIN6 exhibits characteristics of glucose metabolism and glucose-stimulated insulin secretion similar to those of normal islets. Diabetologia. 1993;36:1139–1145. doi: 10.1007/BF00401058. [DOI] [PubMed] [Google Scholar]
- 43.Ashcroft FM, et al. Stimulus-secretion coupling in pancreatic beta cells. J Cell Biochem. 1994;55S:54–65. doi: 10.1002/jcb.240550007. [DOI] [PubMed] [Google Scholar]
- 44.Dadi PK, et al. Inhibition of Pancreatic beta-Cell Ca2+/Calmodulin-dependent Protein Kinase II Reduces Glucose-stimulated Calcium Influx and Insulin Secretion, Impairing Glucose Tolerance. J Biol Chem. 2014;289:12435–12445. doi: 10.1074/jbc.M114.562587. [DOI] [PMC free article] [PubMed] [Google Scholar]
- 45.Catterall WA, Perez-Reyes E, Snutch TP, Striessnig J. International Union of Pharmacology. XLVIII. Nomenclature and structure-function relationships of voltage-gated calcium channels. Pharmacol Rev. 2005;57:411–425. doi: 10.1124/pr.57.4.5. [DOI] [PubMed] [Google Scholar]
- 46.Ashcroft FM, Kelly RP, Smith PA. Two types of Ca channel in rat pancreatic beta-cells. Pflugers Arch. 1990;415:504–506. doi: 10.1007/BF00373633. [DOI] [PubMed] [Google Scholar]
- 47.Jacobson DA, et al. Kv2.1 Ablation Alters Glucose-Induced Islet Electrical Activity, Enhancing Insulin Secretion. Cell Metab. 2007;6:229–235. doi: 10.1016/j.cmet.2007.07.010. [DOI] [PMC free article] [PubMed] [Google Scholar]
- 48.Jacobson DA, et al. Calcium-activated and voltage-gated potassium channels of the pancreatic islet impart distinct and complementary roles during secretagogue induced electrical responses. J Physiol. 2010;588:3525–3537. doi: 10.1113/jphysiol.2010.190207. [DOI] [PMC free article] [PubMed] [Google Scholar]
- 49.Jacobson DA, Weber CR, Bao S, Turk J, Philipson LH. Modulation of the Pancreatic Islet beta Cell delayed Rectifier Potassium Channel Kv2.1 by the Polyunsaturated Fatty arachidonate. J Biol Chem. 2007;282:7442–7449. doi: 10.1074/jbc.M607858200. [DOI] [PMC free article] [PubMed] [Google Scholar]
- 50.Rutter GA, Hodson DJ. Beta cell connectivity in pancreatic islets: A type 2 diabetes target? Cell Mol Life Sci. 2015;72:453–467. doi: 10.1007/s00018-014-1755-4. [DOI] [PMC free article] [PubMed] [Google Scholar]
- 51.Nolan CJ, Madiraju MSR, Delghingaro-Augusto V, Peyot M-L, Prentki M. Fatty Acid Signaling in the beta-Cell and Insulin Secretion. Diabetes. 2006;55:S16–S23. doi: 10.2337/db06-s003. [DOI] [PubMed] [Google Scholar]
- 52.Lou X, Korogod N, Brose N, Schneggenburger R. Phorbol esters modulate spontaneous and Ca2+-evoked transmitter release via acting on both Munc13 and protein kinase C. J Neurosci. 2008;28:8257–8267. doi: 10.1523/JNEUROSCI.0550-08.2008. [DOI] [PMC free article] [PubMed] [Google Scholar]
- 53.Basu J, Betz A, Brose N, Rosenmund C. Munc13-1 C1 domain activation lowers the energy barrier for synaptic vesicle fusion. J Neurosci. 2007;27:1200–1210. doi: 10.1523/JNEUROSCI.4908-06.2007. [DOI] [PMC free article] [PubMed] [Google Scholar]
- 54.Wierda KDB, Toonen RFG, de Wit H, Brussaard AB, Verhage M. Interdependence of PKC-Dependent and PKC-Independent Pathways for Presynaptic Plasticity. Neuron. 2007;54:275–290. doi: 10.1016/j.neuron.2007.04.001. [DOI] [PubMed] [Google Scholar]
- 55.Bargmann CI, Kaplan JM. Signal transduction in the Caenorhabditis elegans nervous system. Annu Rev Neurosci. 1998;21:279–308. doi: 10.1146/annurev.neuro.21.1.279. [DOI] [PubMed] [Google Scholar]
- 56.Rand JB. WormBook, ed C. elegans Res Community. 2007. Acetylcholine. [DOI] [Google Scholar]
- 57.Mahoney TR, Luo S, Nonet ML. Analysis of synaptic transmission in Caenorhabditis elegans using an aldicarb-sensitivity assay. Nat Protoc. 2006;1:1772–1777. doi: 10.1038/nprot.2006.281. [DOI] [PubMed] [Google Scholar]
- 58.Fleming JT, et al. Caenorhabditis elegans levamisole resistance genes lev-1, unc-29, and unc-38 encode functional nicotinic acetylcholine receptor subunits. J Neurosci. 1997;17:5843–5857. doi: 10.1523/JNEUROSCI.17-15-05843.1997. [DOI] [PMC free article] [PubMed] [Google Scholar]
- 59.Lewis Ja, Wu CH, Berg H, Levine JH. The genetics of levamisole resistance in the nematode Caenorhabditis elegans. Genetics. 1980;95:905–928. doi: 10.1093/genetics/95.4.905. [DOI] [PMC free article] [PubMed] [Google Scholar]
- 60.Fliegl H, Koehn A, Haettig C, Ahlrichs R. Ab Initio Calculation of the Vibrational and Electronic Spectra of trans- and cis-Azobenzene. J Am Chem Soc. 2003;125:9821–9827. doi: 10.1021/ja034433o. [DOI] [PubMed] [Google Scholar]
- 61.Konrad DB, Frank JA, Trauner D. Synthesis of Redshifted Azobenzene Photoswitches by Late-Stage Functionalization. Chem a Eur J. 2016 doi: 10.1002/chem.201505061. recently accepted manuscript. [DOI] [PubMed] [Google Scholar]
- 62.Hui X, Reither G, Kaestner L, Lipp P. Targeted Activation of Conventional and Novel Protein Kinases C through Differential Translocation Patterns. Mol Cell Biol. 2014;34:2370–2381. doi: 10.1128/MCB.00040-14. [DOI] [PMC free article] [PubMed] [Google Scholar]
- 63.Ravier Magalie A, Rutter GuyA. Isolation and Culture of Mouse Pancreatic Islets for Ex Vivo Imaging Studies with Trappable or Recombinant Fluorescent Probes. Mouse Cell Cult. 2010;633:171–184. doi: 10.1007/978-1-59745-019-5_12. [DOI] [PubMed] [Google Scholar]
- 64.Ravier MA, Rutter GA. Glucose or Insulin, but not Zinc Ions, Inhibit Glucagon Secretion From Mouse Pancreatic alpha-cells. Diabetes. 2005;54:1789–1797. doi: 10.2337/diabetes.54.6.1789. [DOI] [PubMed] [Google Scholar]
- 65.Burgalossi A, et al. Analysis of neurotransmitter release mechanisms by photolysis of caged Ca2+ in an autaptic neuron culture system. Nat Protoc. 2012;7:1351–1365. doi: 10.1038/nprot.2012.074. [DOI] [PubMed] [Google Scholar]
- 66.Brenner S. The genetics of Caenorhabditis elegans. Genetics. 1974;77:71–94. doi: 10.1093/genetics/77.1.71. [DOI] [PMC free article] [PubMed] [Google Scholar]
- 67.Gaffney PRJ, Reese CB. Preparation of 2-O-Arachidonoyl-1-O-stearoyl-sn-glycerol and Other Di-O-Acyl Glycerol Derivatives. Tetrahedron. 1997;38:2539–2542. [Google Scholar]
- 68.Chen C-Y, Han W-B, Chen H-J, Wu Y, Gao P. Optically Active Monoacylglycerols: Synthesis and Assessment of Purity. European J Org Chem. 2013;2013:4311–4318. [Google Scholar]
Associated Data
This section collects any data citations, data availability statements, or supplementary materials included in this article.


