Summary
Pluripotent stem cells, including embryonic stem cells (ESCs) and induced pluripotent stem cells (iPSCs), have the potential to treat type-1 diabetes through cell replacement therapy. However, the protocols used to generate insulin-expressing cells in vitro frequently result in cells which have an immature phenotype and are functionally restricted. MicroRNAs (miRNAs) are now known to be important in cell fate specification, and a unique miRNA signature characterises pancreatic development at the definitive endoderm stage. Several studies have described differences in miRNA expression between ESCs and iPSCs. Here we have used microarray analysis both to identify miRNAs up- or down-regulated upon endoderm formation, and also miRNAs differentially expressed between ESCs and iPSCs. Several miRNAs fulfilling both these criteria were identified, suggesting that differences in the expression of these miRNAs may affect the ability of pluripotent stem cells to differentiate into definitive endoderm. The expression of these miRNAs was validated by qRT-PCR, and the relationship between one of these miRNAs, miR-151a-5p, and its predicted target gene, SOX17, was investigated by luciferase assay, and suggested an interaction between miR-151a-5p and this key transcription factor. In conclusion, these findings demonstrate a unique miRNA expression pattern for definitive endoderm derived from both embryonic and induced pluripotent stem cells.
Keywords: microRNA, embryonic stem cells, induced pluripotent stem cells, differentiation, definitive endoderm, pancreas, type 1 diabetes
1. Introduction
Pluripotent stem cells, including embryonic stem cells (ESCs) and induced pluripotent stem cells (iPSCs), have enormous potential to treat a wide range of diseases through cell replacement therapy, including type 1 diabetes mellitus (T1DM) and iPSCs have now been derived from patients with this genetically complex disease (1). However, to date, the differentiation protocols that have been developed have yet to yield fully functional, mature β-cells with high efficiency. Instead, most of these studies describe the generation of cells that were functionally restricted, either having a polyhormonal phenotype, low levels of insulin synthesis, or lacking appropriate insulin release in response to high glucose. It has been suggested that these characteristics are more reminiscent of foetal pancreatic cells (2) and that a more complete maturation into a pancreatic β-cell phenotype is only possible after the transplantation of pancreatic progenitor cells into immune-deficient mice, where as yet unknown factors in the in vivo environment are capable of inducing these cells to more complete differentiation (3; 4; 5). Despite these challenges, the most successful protocols for generating insulin-expressing cells in vitro have been those which have recapitulated the signalling pathways which are important during in vivo pancreatic development (4; 6; 7). Much of this signalling is dependent on the correct temporal expression of a number of transcription factors and associated transcriptional elements, and there is now increasing evidence that miRNAs play an important role in regulating the expression of these transcriptional networks. These small, non-coding RNAs regulate gene expression by inhibiting translation and/or by causing mRNA degradation and are involved in almost every biological process, including development, metabolism, and ageing, as well as in many human diseases, most notably cancer. Although the number of miRNAs described to date is small compared to that of mRNAs, a single miRNA can target many mRNAs, enabling each miRNA to regulate the expression of many components of a signalling pathway or transcriptional network simultaneously. As a result, miRNAs are likely to have a considerable impact on the rapid and efficient control of gene expression.
Conditional deletion of the miRNA processing enzyme, DICER-1 in the developing pancreas results in defects in all pancreatic lineages, but it particularly affects the insulin-secreting β-cells (8), demonstrating the critical role that miRNAs play in pancreatic development. While there have been a number of reports describing the miRNA expression at the later stages of pancreatic development (reviewed in Francis et al) (9), only a small number of studies have investigated miRNA expression at the definitive endoderm (DE) stage (10; 11; 12) which has previously been identified as critical in the in vitro differentiation towards a pancreatic lineage (13). To date, there have similarly been few reports describing miRNAs which play a role in the differentiation of pluripotent stem cells to a DE phenotype. miR-375 was one of the first miRNAs identified in the pancreas (14), and remains one of the best characterised. It is highly expressed throughout pancreatic development (15; 16), including at the DE stage (10; 11), although the exact role it plays in this process is not fully understood: TIMM8A was identified as a target of miR-375 in ESCs but a function for this pathway in DE formation was not elucidated (11). More recently, overexpression of a panel of miRNAs in mouse ESCs resulted in the up-regulation of the definitive endoderm genes SOX17 and FOXA2, suggesting an increase in differentiation efficiency (17), and another study identified a direct relationship between miR-200a and SOX17 (18).
Clearly, if miRNAs are important in controlling the differentiation of pluripotent stem cells into DE, then of obvious interest is whether there are any differences between iPSCs and ESCs in this regard. However, to date there is little consensus as to whether there are any consistent differences in miRNA expression between ESCs and iPSCs in either the undifferentiated state, or in their differentiated progeny, with some studies finding differences in miRNA expression between the two cell types (19); Wilson et al. 2009 (20; 21) and others finding no differences (22; 23). In the present study, we have investigated changes in miRNA expression in ESCs and iPSCs differentiating into DE. Using miRNA microarray and qRT-PCR to identify candidate miRNAs for further investigation, we identified several miRNAs that are differentially expressed between ESCs and iPSCs and are also identified as being important in DE formation. The predicted target of one of these miRNAs, miR-151a-5p, is SOX17, one of the earliest markers of DE (24). Luciferase assays were performed to further investigate this interaction and demonstrated that miR-151a-5p does indeed bind to the 3’UTR region of the SOX17 mRNA. This study provides further evidence for the important role that miRNAs play in the differentiation process, and indicates miR-151a-5p is a novel miRNA involved in the ability of iPS and hES to undergo differentiation to definitive endoderm.
2. Materials & Methods
2.1. Pluripotent stem cell culture
iPSC lines (designated MRC5I and MRC9G) were generated in-house from MRC5 and MRC9 fibroblasts using a previously described protocol based on retroviral transduction of fibroblasts using the reprogramming factors OCT4, SOX2, KLF4 and C-MYC (25). ESC lines (H1, H7 and H9) were obtained from the UK Stem Cell Bank (www.ukstemcellbank.org.uk). H9 cells were maintained on Matrigel™ (BD) in mTeSR-1 medium (Stem Cell Technologies) and the other cell lines were maintained on inactivated SNL feeders in knockout DMEM supplemented with 10% knockout serum replacement, 2mM L-glutamine, 1% non-essential amino acids, 0.1mM β-mercaptoethanol, and 4ng/ml bFGF (Invitrogen).
2.2. Characterisation of iPSC cells
Stem cells were fully characterised for expression of pluripotency genes and ability to spontaneously differentiate into all three embryonic germ layers in vitro prior to their use in this study. Immunocytochemistry was carried on formalin-fixed, permeabilised cells. 500μl of primary antibody was added to the cells which were then incubated in the dark overnight at 4°C. The cells were washed 3 times with PBST, and 500μl secondary antibody was then added to the cells and incubated at 4°C for 1h. 200μl of Hoescht DNA stain was added to the cells and incubated for 1min at room temperature. The cells were then washed for 5min in PBST. Isotype controls were also prepared. For qRT-PCR analysis, both mRNA and miRNA were isolated using the miRNeasy Mini Kit (Qiagen). Stem cell colonies were isolated by mechanical dissection into 700μl QIAzol lysis reagents and incubated at room temperature for 5min. 140μl chloroform was added to each sample, shaken vigorously for 15sec, then incubated at room temperature for 2-3min. Samples were centrifuged at 4°C for 15min at 12,000 x g, allowing separation into phases. The upper aqueous phase was transferred to a new collection tube and 1.5 volumes of 100% ethanol were added and mixed. The sample was applied to an RNeasy mini spin column. Washing was carried out according to the manufacturer’s instructions. On-column DNase digestion was performed using the RNase-free DNase kit (Qiagen). Total RNA (including the miRNA fraction) was eluted in 30μl water. For the reverse transcription of mRNAs, 1μl Oligo(dT)15 primers (0.5μg/μl) and 1μl random primers (0.5μg/μl) were added 9.5μl total RNA and incubated at 70°C for 5min then immediately cooled on ice for 5min. The reverse transcription reaction was set up as follows: 4 μl 5x Reaction Buffer, 1μl 10mM dNTPs, 2 μl 40U/μl RNAsin, 0.5μl 400mM DTT, 1μl MMLV-RT enzyme (all Promega reagents). 8.5μl of this master mix was added to the RNA and incubated for 50min at 42°C, followed by 15min at 70°C. PCR reactions were set up in 20μl reactions as follows: 10μl Sensimix Plus reaction buffer (Bioline), 1μl 10μm forward primer (IDT); 1μl 10μm reverse primer (IDT); 2μl cDNA; 6μl water. PCR reactions were carried out using the following PCR cycling conditions: 10min at 95°C; followed by 40 repeated cycles of 5sec at 95°C, 15sec at 58°C and 10sec at 72°C. The fluorescence was acquired at the end of the elongation step. mRNA expression levels were normalised against the CYCG reference gene.
2.3. Differentiation into DE
Differentiation into DE was carried using a previously described protocol (26) The cells were treated with 100ng/ml Activin A and 25ng/ml Wnt3A for 1 day, then with 100ng/ml Activin A and 0.2% foetal calf serum for 2 days. RNA was isolated from undifferentiated samples at day 0 and differentiated samples at day 3. Spontaneously differentiated samples were treated with RPMI (Invitrogen) without growth factors (R&D Technologies) and also harvested on day 3.
2.4. Microarray analysis of miRNA expression
Microarray hybridisation and image scanning was carried out by Exiqon Services, Denmark, who then supplied the raw data for analysis. A common reference approach was used, where each sample is co-hybridised with the same reference sample, which is a mixture of all the samples included in the analysis, providing a baseline for miRNA expression. This allows a direct comparison of each sample with any other sample. Principal component analysis and hierarchical clustering figures were also supplied by Exiqon. Background correction, normalisation and miRNA expression analysis was carried out using Nexus Expression software. For comparisons of miRNA expression between samples, the log fold change was calculated and compared. Calculated p-values were based on Students’ T-test. A multiple testing correction (Benjamini-Hochberg method) was used.
2.5. qRT-PCR for analysis of miRNA expression
RNA was isolated as previously described. Reverse transcription was carried out using the miScript™ reverse transcription kit (Qiagen). The reverse transcription master mix was prepared as follows: 4μl 5x miScript™ RT Buffer, 5μl RNase-free water, 1μl miScript™ Reverse Transcriptase, 10μl RNA. The reverse transcription reaction was carried out at 37°C for 60min followed by 95°C for 5min.
qRT-PCR analysis of miRNA expression was carried out using a forward primer specific for the miRNA of interest in combination with the miScript™ SYBR Green PCR kit (Qiagen). The reaction was prepared as follows: 10μl 2x QuantiTect SYBR Green PCR Master Mix; 2μl 10x miScript Universal Primer; 2μl 10 miScript Primer Assay; 4μl PCR-grade water; 2μl cDNA. PCR reactions were carried out on the Qiagen Rotor-Gene™ 6000 using the reaction conditions as follows: 15min at 95°C; 40 cycles of 15sec at 94°C, 30sec at 55°C and 30sec at 70°C. The fluorescence was acquired at the end of the extension step. miRNA expression levels were normalised against the SN43 small nucleolar RNA.
2.6. miRNA target prediction
Target prediction of relevant miRNAs was performed using TargetScan (www.targetscan.org), miRDB (www.mirdb.org) and Pictar (www.pictar.mdc-berlin.de/cgi-bin/PicTar_vertebrate.cgi).
2.7. Luciferase assay
293FT cells were plated at a density of 1x10⁵ cells per well of a 24-well plate. After 24hrs, cells were transfected with miTarget 3’UTR target vectors (Genecopoeia), containing the 3’UTR sequence of SOX17 or TIMM8A, plus a miRNA mimic (miR-375, miR-151a5p, or miR-200a, all Qiagen) using Lipfofectamine 3000 (Life Technologies). Specifically, 150 ng plasmid DNA and 5 pmol miRNA mimic were diluted in 25 μl Opti-MEM reduced serum medium (Invitrogen) in parallel with 0.75 μl Lipofectamine 3000 reagent in 25 μl Opti-MEM. Solutions were incubated for 5 min at room temperature after which they were combined and incubated for a further 5 min at room temperature, before adding drop-wise to cells. 48h after plasmid transfection, the supernatant was collected and analysed for luminescence using the SecretePair™ Dual Luminescence Assay Kit (Genecopoeia) according to the manufacturer’s instructions.
3. Results
3.1. Differentiation of iPSCs and ESCs into definitive endoderm
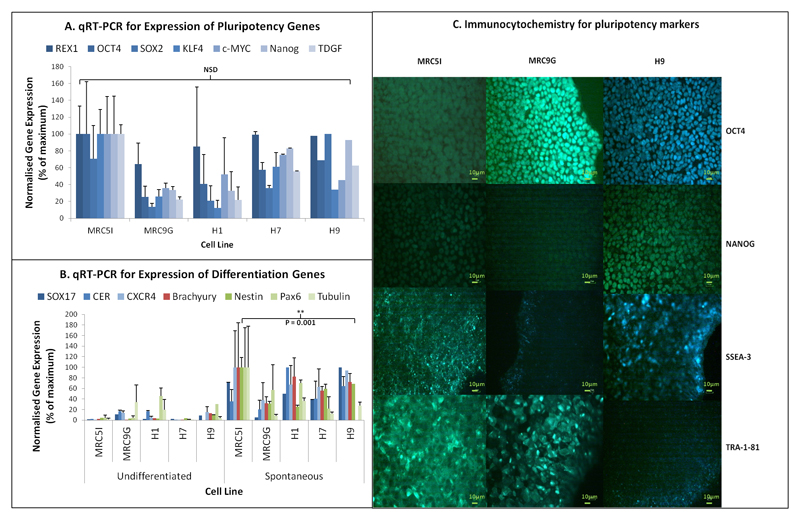
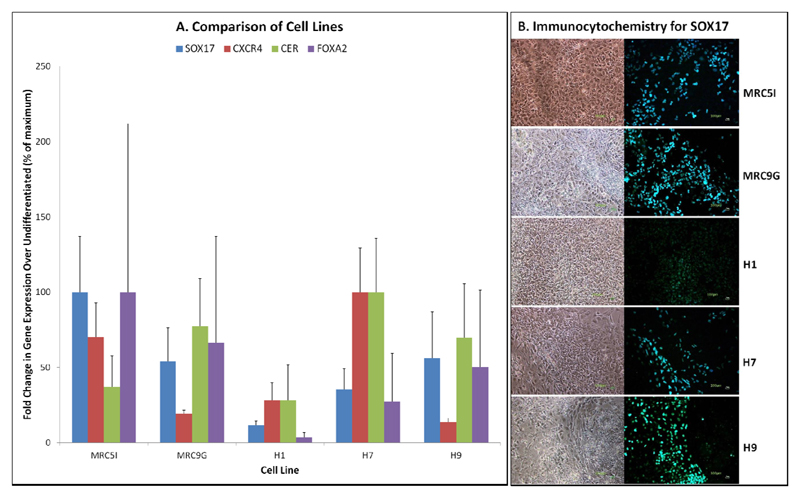
Prior to differentiation experiments, we derived two iPSC lines using methods previously described (25). Figure 1 summarises characterisation data demonstrating the successful reprogramming of MRC5 and MRC9 fibroblasts into iPSC lines that expressed pluripotency genes including OCT4 and NANOG, at a similar level to the ESC lines as assessed by qRT-PCR (figure 1A) and immunocytochemistry (figure 1C), and expressed genes indicative of differentiation into all three embryonic germ layers following spontaneous differentiation in vitro (figure 1B). Both ESCs and iPSCs could be differentiated into DE at high efficiency, as shown by qRT-PCR analysis of DE genes (figure 2A) and immunocytochemistry for SOX17 (figure 2B). During these experiments it was noticed that the H1 ESC line has a lower efficiency of differentiation into DE than the other cell lines used, which has also been demonstrated by other studies (7; 27).
Figure 1.
Characterisation of new iPSC lines (MRC5I & MRC9G) in comparison with ESC lines (H1, H7 & H9). A) qRT-PCR analysis of pluripotency; B) qRT-PCR analysis of genes characteristic of each embryonic germ layer: endoderm (SOX17, CER & CXCR4), mesoderm (BRACHYURY), and ectoderm (NESTIN, PAX6 & TUBULIN); C) Immunocytochemistry for pluripotency markers OCT4, NANOG, SSEA-3 and TRA-181.
N = 3, ANOVA with Fisher’s a priori test used to determine statistical significance of differences between groups.
Figure 2.
Differentiation of iPSCs (MRC5I & MRC9G) and ESCs (H1, H7 and H9) into definitive endoderm. A) qRT-PCR for definitive endoderm genes: SOX17, CXCR4, CER and FOXA2; B) Immunocytochemistry for SOX17 (10x magnification, scale bar 100um). N = 3, ANOVA with Fisher’s a priori test used to determine statistical significance of differences between groups.
3.2. Identification of miRNAs Involved in Differentiation to Definitive Endoderm
Microarray analysis was performed on undifferentiated and differentiated samples from four cell lines: two iPSC lines (MRC5I and MRC9G) and two ESC lines (H1 and H9). Although this experimental design represented somewhat of a compromise, since a comprehensive comparison of different cell types and culture conditions would require a much larger number of cell lines, it did allow us to identify candidate miRNAs which may be important in the differentiation of iPSCs and ESCs into DE. Although initial experiments were carried out using the two iPSC lines and the H9 cell line, which is a well-characterised ESC line, we recognised that since H9 was grown on Matrigel™ and the iPSCs were grown on iSNL feeders, the inclusion of an ESC line that was grown on feeders may reveal additional miRNAs of interest. For this reason H1 was introduced into the microarray analysis. However, given that differentiation experiments showed that H1 was poor at making DE, we anticipated that it may be more appropriate to also analyse the data, firstly excluding H9, which may have a markedly unique miRNA expression pattern as a result of culture conditions and then excluding H1, which doesn’t have a high propensity for DE formation, so as not to bias the microarray results. For the more detailed analysis and validation of miRNA expression patterns using qRT-PCR, we also included the H7 ESC line, grown on Matrigel, to i) increase the sample size and ii) provide additional evidence whether miRNA expression is dependent on culture method or is consistent for all ESC populations in this study. Only miRNAs whose expression was consistent across culture methods and cell types (ESC or iPSC) were considered for future investigation.
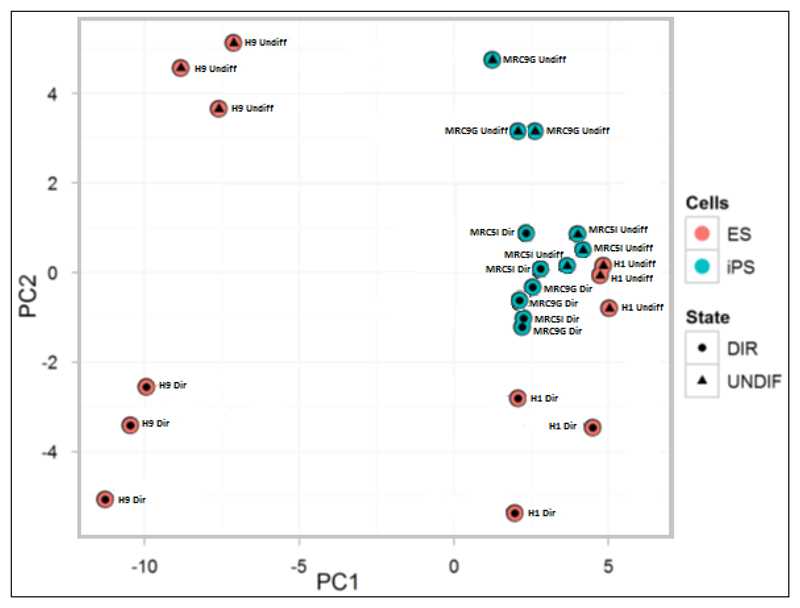
Array data were first analysed using principal component analysis (PCA) to assess the variance between samples. PCA allows visual identification of differences in miRNA expression related to biological or technical factors, providing a useful summary of the microarray data. Figure 3 demonstrates that differentiated cells (denoted by circles) cluster together, and distinctly from undifferentiated cells (denoted by triangles). In addition, ESCs (shown in red) and iPSCs (shown in blue) also cluster separately. Furthermore, H9 cells cluster separately from the other cell lines (H1, MRC5I and MRC9G) possibly reflecting the fact that this cell line is cultured on Matrigel™ rather than iSNL feeders.
Figure 3.
Principal component analysis summarising the data from microarray analysis of differentiated (circles, DIR) and undifferentiated (triangles, UNDIFF) ESCs (red) and iPSCs (blue).
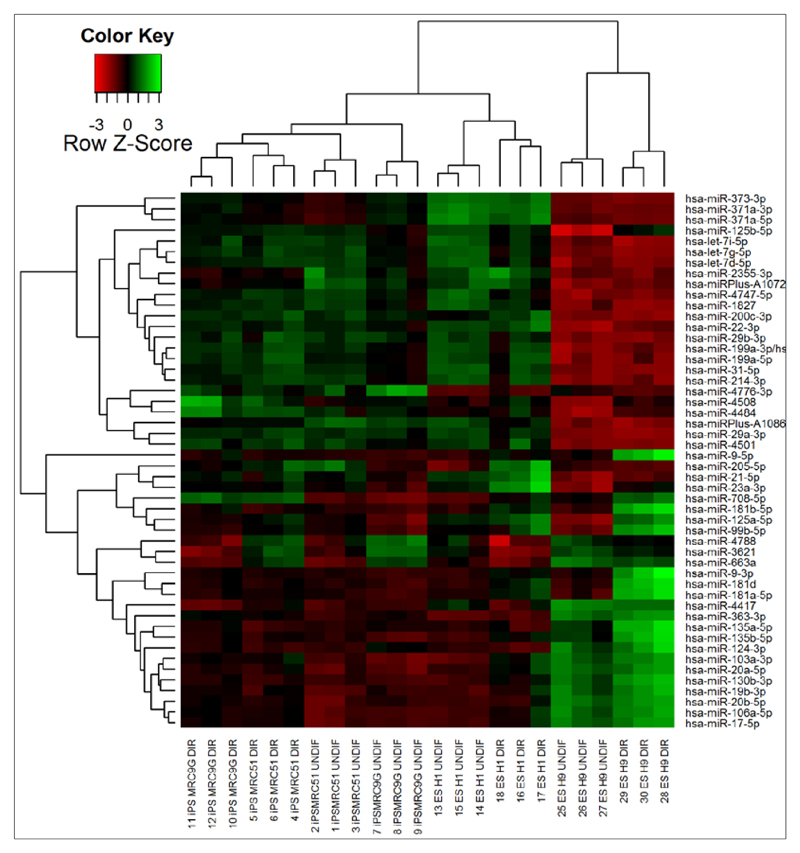
Next, unsupervised hierarchical clustering analysis was used to further interrogate the 50 miRNAs with the highest variation in expression levels between samples to examine how either samples (horizontal clusters) or miRNAs (vertical clusters) cluster together based on this variance. Hierarchical clustering treats each data point as a single cluster, and then successively merges clusters based on their similarity until all points have been merged into a single cluster. This is represented by the dendrogram shown in figure 4, and allows a simple visual identification of the samples which are most similar in terms of their miRNA expression profile. Thus, figure 4 shows that the two iPSC lines (MRC5I and MRC9G) cluster together, with undifferentiated samples distinct from differentiated samples, suggesting that these iPSC lines are highly similar in terms of their miRNA expression, both at the undifferentiated and the DE stage. The H1 ESC line, which is also grown on feeders, is the most similar to these iPSC lines but clusters separately, indicating some differences in miRNA expression. The H9 cell line, which is grown on Matrigel™, clusters separately both from the iPSC lines and the ESC line on feeders, confirming the likely distinctions identified in the PCA. Figure 4 also demonstrates that miRNAs from the same family cluster together, for example, miR-373-3p, miR-371a-3p, and miR-371a-5p cluster together at the top of the list. In addition, the -3p and -5p forms of some miRNAs also cluster together e.g. miR-371a-3p and -5p. This suggests that miRNAs which are likely to be co-regulated and co-transcribed show similar expression patterns in these samples, indicating that the results of the microarray follow expected biological patterns, offering confidence in the validity of the results.
Figure 4.
Unsupervised hierarchical clustering analysis based on the normalised expression of the 50 miRNAs with the highest variation between samples (iPSC lines = MRC5I and MRC9G; ESC lines = H1 and H9; DIR = differentiated; UNDIF = undifferentiated). miRNAs which are expressed at lower levels than in the reference sample are shown in red, while miRNAs which are expressed at higher levels are shown in green. Z score transformation allows expression of hybridisation values for individual miRNAs as a unit of standard deviation from the normalized mean of zero.
To aid in the identification of candidate miRNAs that may be important in the differentiation of iPSCs and ESCs into DE, we decided to analyse the miRNA expression patterns in four distinct sample populations as they differentiated into DE: iPSCs (MRC5I and MRC9G combined), ESCs (H1 and H9 combined) and, based on the fact that the hierarchical clustering analysis identified the H1 and H9 ESC lines as clearly distinct populations, we also assessed these ESC lines individually. 86 miRNAs were identified as being differentially expressed between differentiated and undifferentiated iPSCs, while 82 miRNAs were differentially expressed between differentiated and undifferentiated ESCs. These miRNAs may play a role in differentiation to DE. As it was not practical to further investigate so many candidate miRNAs, the 10 miRNAs which were most highly up- or down-regulated in ESCs and iPSCs were selected for further analysis (Table 1). The expression levels of these miRNAs in the H1 and H9 ESC lines when analysed individually is also shown. Taken together, these represent candidate miRNAs whose expression was then selected for more detailed analysis.
Table 1. Top 10 miRNAs most highly up- (upper table) or down- (lower table) regulated during differentiation of ESCs and iPSCs to definitive endoderm.
Individual comparisons were carried out for the ESC lines (H1 & H9) as these clearly demonstrated distinct profiles of miRNA expression in the principal component analysis and hierarchical clustering analysis. P-values of <0.1 were considered statistically significant.
| miRNAs Upregulated In DE Formation | ||||
| miRNA |
ESC p-value |
iPSC p-value |
H9 p-value |
H1 p-value |
| hsa-miR-375 | 0.019 | 0.042 | 0.092 | 0.048 |
| hsa-miR-708-5p | 0.050 | 0.000 | 0.020 | 0.083 |
| hsa-miR-744-5p | 0.029 | 0.038 | 0.234 | 0.084 |
| hsa-miR-27b-3p | 0.036 | 0.070 | 0.085 | 0.084 |
| hsa-miR-26b-5p | 0.021 | 0.066 | 0.092 | 0.084 |
| hsa-miR-30b-5p | 0.050 | 0.068 | 0.108 | 0.104 |
| hsa-miR-4530 | 0.019 | 0.051 | 0.155 | 0.109 |
| hsa-miR-151a-3p | 0.094 | 0.019 | 0.106 | 0.084 |
| hsa-miR-151a-5p | 0.066 | 0.020 | 0.165 | 0.084 |
| hsa-miR-191-5p | 0.023 | 0.081 | 0.273 | 0.084 |
| miRNAs Downregulated In DE Formation | ||||
| miRNA |
ESC p-value |
iPSC p-value |
H9 p-value |
H1 p-value |
| hsa-miR-3941 | 0.065 | 0.042 | 0.236 | 0.077 |
| hsa-miR-3148 | 0.066 | 0.041 | 0.250 | 0.104 |
| hsa-miR-124-5p | 0.015 | 0.063 | 0.249 | 0.084 |
| hsa-miR-4285 | 0.045 | 0.066 | 0.979 | 0.083 |
| hsa-miR-3935 | 0.050 | 0.128 | 0.218 | 0.089 |
| hsa-miR-378a-3p | 0.021 | 0.313 | 0.086 | 0.075 |
| hsa-miR-4451 | 0.035 | 0.163 | 0.015 | 0.148 |
| hsa-miR-516b-5p | 0.039 | 0.145 | 0.072 | 0.088 |
| hsa-miR-4436b-5p | 0.269 | 0.037 | 0.310 | 0.083 |
| hsa-miR-4732-3p | 0.380 | 0.005 | 0.952 | 0.083 |
Following previous reports of differences in miRNA expression between ESCs and iPSCs, we were also interested to see if any such differences could be identified between the cell lines in this study and which may therefore be important in determining the potential of specific cell populations to differentiate into DE. Interrogating the microarray data, we found that when undifferentiated iPSCs (MRC5I and MRC9G together) were compared to undifferentiated ESCs (H1 and H9 together), no miRNAs were identified that were significantly differently expressed, suggesting that starting populations of these cell populations are equivalent in terms of their miRNA expression. This was a rather surprising result and is in contrast to several previous studies (19;20;21), which reported miRNAs that were differentially expressed between undifferentiated iPSCs and ESCs, although two more recent studies have also reported that ESCs and iPSCs could not be distinguished by their miRNA expression pattern (22;23). In addition, however, this highlights an important limitation in comparisons of this type (ESCs vs. iPSCs), since we know that H1 and H9 ESCs exhibit different miRNA expression profiles, possibly as a result of differing culture conditions. When these cell lines were compared to iPSC lines as individual ESC populations there were in fact 154 miRNAs differentially expressed in H9, and 28 miRNAs differentially expressed in H1 ESCs. Importantly, when differentiated iPSCs were compared to differentiated ESCs, 91 miRNAs were significantly differentially expressed between the two cell types. Several of these miRNAs also appeared on the lists of miRNAs most up- or down-regulated during differentiation, including miR-151a-5p, miR-151a-3p, miR-26b-5p, miR-27b-3p, miR-30b-5p, miR-378a-3p, and miR-4530.
Having identified candidate miRNAs that may play a role in the differentiation of these cells into DE, and also those that may be differentially expressed between ESCs and iPSCs, we next investigated the expression of these miRNAs in undifferentiated and differentiated cells from a number of cell lines (MRC5I, MRC9G, H1, H9 and an additional ESC line, H7) using qRT-PCR. This allows a more focussed assessment and has been shown to be a more robust method for the analysis of miRNA expression (28).
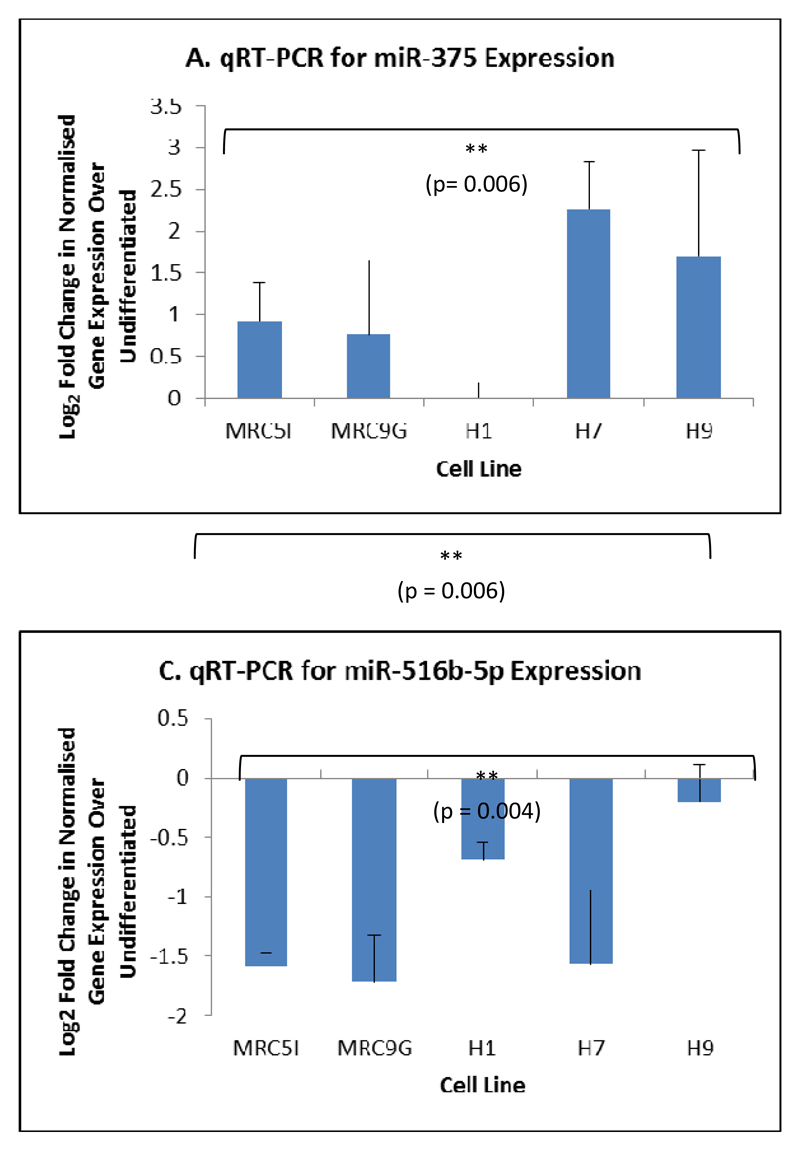
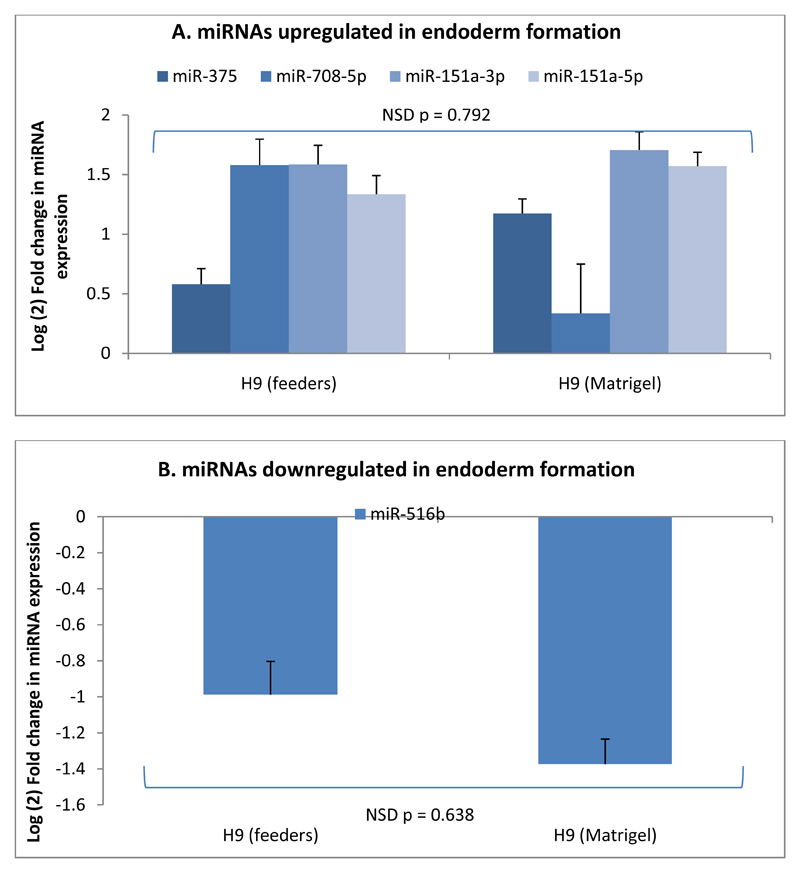
Of the ten miRNAs that were predicted by microarray analysis to be the most highly up- or down-regulated during DE formation, two (miR-375 and miR-708-5p) were confirmed by qRT-PCR to be specifically upregulated in cells undergoing differentiation to DE (figures 5A and 5B). Both miR-375 (10; 11; 29) and miR-708-5p (11; 29) have been shown previously to be upregulated in DE formation. Similarly, of the ten miRNAs predicted to be most strongly downregulated in DE formation, miR-516b was confirmed to be significantly downregulated in all five cell lines undergoing differentiation to DE (figure 5C). To our knowledge, this miRNA has not been previously implicated in DE formation. Given the potential, at least in the H9 ESC line, for the expression of these miRNAs to be a result of specific culture conditions (i.e culture on Matrigel™), we also assessed the expression levels of these miRNAs in the H9 ESC line grown on both Matrigel™ and iSNL feeders. Figure 6 shows that there is no significant difference in the expression of miRNAs, which are up- or down-regulated during differentiation to DE, between H9 cells grown using either culture method, providing further confidence that the miRNAs identified in this study represent conserved changes in miRNA expression as a result of differentiation into DE which are not dependent on either individual cell lines or the culture method used.
Figure 5.
qRT-PCR analysis of miRNAs differentially expressed during differentiation of iPSCs (MRC5I and MRC9G) and ESCs (H1, H7 and H9) to definitive endoderm. A) Expression of miR-375; B) Expression of miR-708-5p; C) Expression of miR-516b-5p. N = 3, ANOVA with Fisher’s a priori test used to determine statistical significance of differences between groups.
Figure 6.
Comparison of expression of miRNAs A) upregulated in DE formation; or B) downregulated in DE formation in H9 cells cultured on both iSNL feeders or Matrigel™. N = 3, ANOVA with Fisher’s a priori test used to determine statistical significance of differences between groups
Two miRNAs, miR-744 and miR-27b, which were predicted by the microarray analysis to be upregulated in DE formation, were confirmed to be upregulated by qRT-PCR, but were also found to be significantly upregulated in spontaneously differentiated cells (data not shown), suggesting a role for these miRNAs in more general differentiation rather than specifically in differentiation to DE.
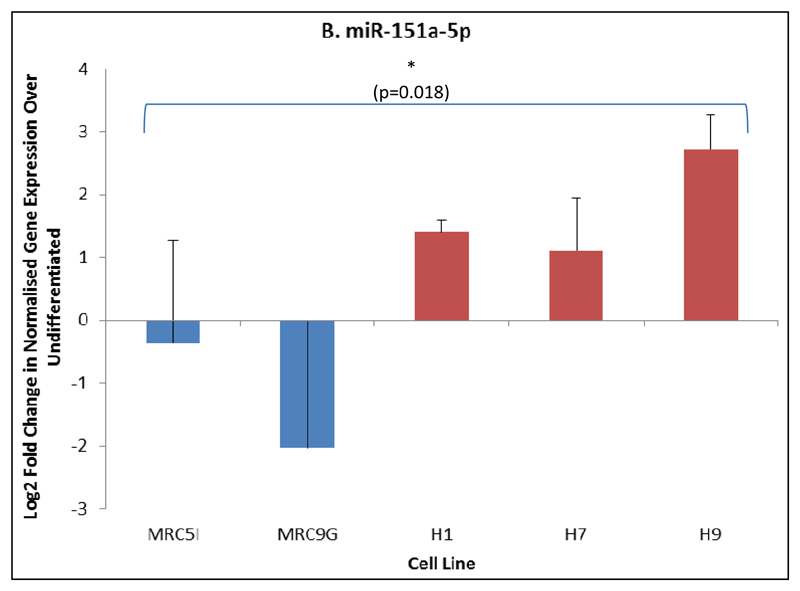
Of those miRNAs reported by microarray to be differentially expressed between DE derived from ESCs and iPSCs, and which were also present in the list of the top ten miRNAs most strongly up- or down-regulated during DE formation, two (miR-151a-3p and miR-151a-5p) were confirmed by qRT-PCR as being differently expressed between ESCs and iPSCs directed to differentiate into DE (figure 7). Interestingly, these miRNAs are upregulated upon differentiation to DE in ESCs but downregulated in iPSCs. There was no difference in the expression of these miRNAs in either undifferentiated ESCs vs. iPSCs, or in spontaneously differentiated ESCs vs. iPSCs, suggesting that this difference arises during differentiation and is specific to DE formation. These miRNAs have not been previously implicated in DE formation, although their expression has been noted in foetal liver (30) and their function remains unknown, although a small number of gene targets have been experimentally validated (mirtarbase.mbc.nctu.edu.tw/index.php). For this reason, these miRNAs were identified for further study beginning with the identification of putative target mRNAs.
Figure 7.
qRT-PCR analysis of miRNAs differentially expressed between iPSCs (MRC5I & MRC9G) and ESCs (H1, H7 & H9) in differentiation to DE. A) Expression of miR-151a-3p; B) Expression of miR-151a-5p. N = 3, ANOVA with Fisher’s a priori test used to determine statistical significance of differences between groups.
3.3. Identification of gene targets of miR-151a-5p
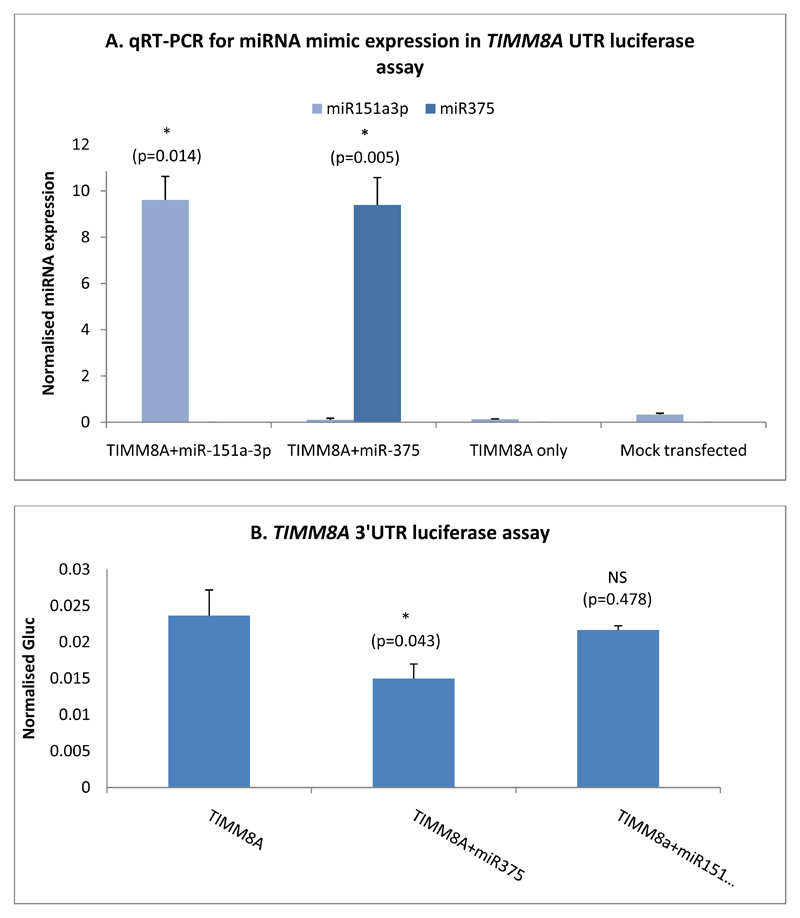
In order to validate our approach of using luciferase assays to detect miRNA-target binding relationships, we first investigated a previously described relationship between miR-375 and its target gene TIMM8A (11). A plasmid encoding a modified Gaussia luciferase gene linked to the 3’UTR of the target mRNA (TIMM8A) was introduced into 293FT cells, which provide an easy-to-transfect model cell line in which to investigate miRNA-target gene interaction. Figure 8A demonstrates the successful co-transfection of 293FT cells with either a miR-375 or miR-151a-3p mimic, with significantly increased levels of mimic expression over the mock treated or plasmid only controls. The binding of miR-375 miRNA to the 3’UTR region of the plasmid results should result in reduced luciferase expression, with any variability in the transfection of the 3’UTR vector between cell populations normalised between samples by the use of a dual reporter luciferase assay system. Indeed, figure 8B shows the results of a representative TIMM8A luciferase assay, with a significant reduction in luciferase in cells treated with both the TIMM8A 3’UTR plasmid and the miR-375 mimic, demonstrating miRNA binding to this target. miR-151a-3p mimic was included in these assays as a negative control. Overall, four independent assays were performed, resulting in an average 62.2% luciferase activity for miR-375 and 107.2% luciferase with miR-151a-3p, where the luciferase activity of the TIMM8A 3’UTR vector-only samples were set at 100%.
Figure 8.
A) qRT-PCR data showing expression of miR-151a-3p and miR-375 in 293FT cells transfected with respective miRNA mimics. N=3, a paired two-tailed t-test was used to test for statistical significance between controls and experimental sample. B) Normalised luciferase readings from 293FT cells transfected with the TIMM8A 3’UTR plasmid and a miR-375 mimic. Data shown is one assay, representative of four independent experiments. N=3, a paired two-tailed t-test was used to test for statistical significance between control and experimental sample
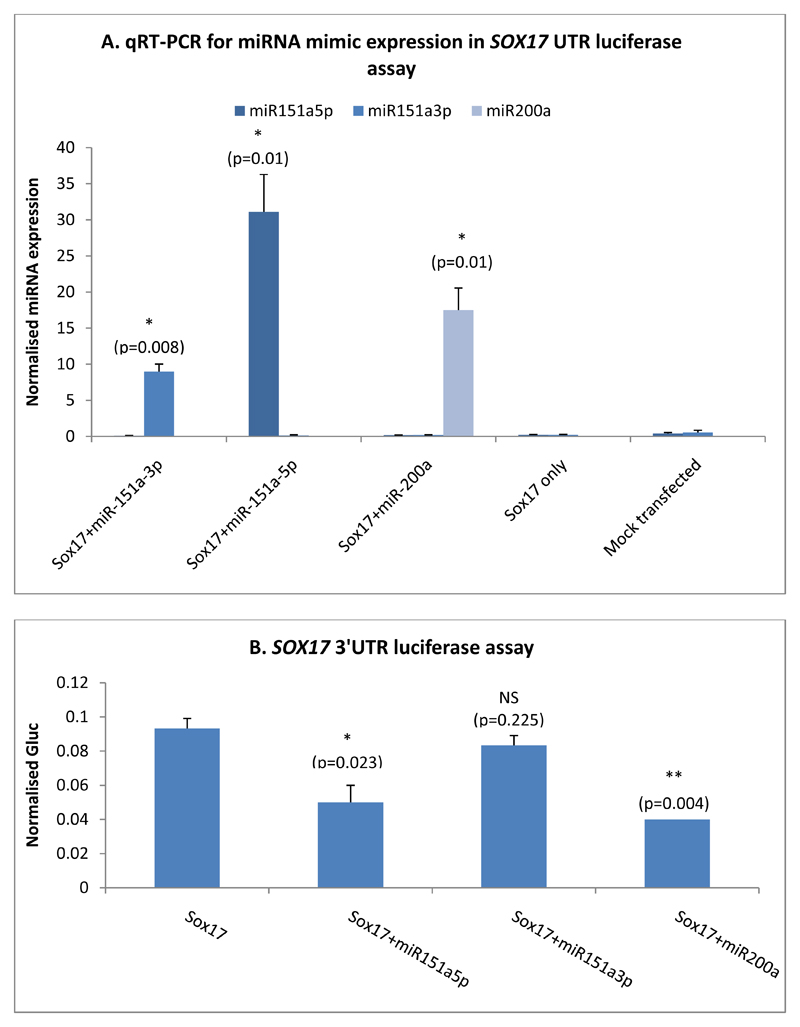
Next, we used target prediction algorithms to identify possible gene targets of miR-151a-3p and miR-151a-5p. Interestingly, SOX17 appeared on the list of predicted targets for miR-151a-5p in the results from both TargetScan and miRDB. This gene is one of the earliest markers of DE (24), and is essential for endoderm formation (31). It is possible that miR-151a-5p has an effect on endoderm formation through regulation of SOX17 expression, and that differential expression of this miRNA between ESCs and iPSCs may affect their ability to differentiate into DE. A recent publication has also provided additional evidence using luciferase assays that miR-151a-5p binds to SOX17 (32). With this in mind, a luciferase assay was carried out to confirm if miR-151a-5p is able to bind directly to the 3’UTR of SOX17 mRNA. We co-transfected a luciferase reporter plasmid containing the SOX17 3’UTR into 293FT cells alongside a miR-151a-5p mimic or a miR-151a-3p mimic as a negative control. As an additional positive control for these assays, we also included a miR-200a miRNA mimic, which has also recently been described as binding to SOX17 (18).
Figure 9A demonstrates the expression levels of miR-151a-5p in transfected 293FT cells. There was a significant increase in miR-151a-5p expression in cells treated with the miR-151a-5p mimic compared to plasmid only or mock treated cells, confirming successful transfection. Figure 9B shows the results of a representative SOX17 3’UTR luciferase assay, demonstrating significant reduction in luciferase activity in cells transfected with both the SOX17 3’UTR and the miR-151a-5p mimic. A similar significant reduction in luciferase activity was also seen in cells treated with the SOX17 3’UTR and the miR-200a mimic, providing confirmation of this interaction. As the negative control, miR-151a-3p did not show a reduction in luciferase activity. Overall, four independent assays were performed, with an average percentage luciferase activity of 59% for miR-151a-5p and 50.2% for miR-200a compared with 86.4% for miR-151a-3p transfected cells, where the luciferase activity of the SOX17 3’UTR vector-only samples were set at 100%. These results imply miR-151a-5p can directly bind its predicted target gene SOX17.
Figure 9.
A) qRT-PCR data showing expression of miR-151a-5p, miR-151a-3p and miR-200a in 293FT cells transfected with respective mimics. N=3, a paired two-tailed t-test was used to test for statistical significance between control and experimental sample. B) Normalised luciferase readings from 293FT cells transfected with the SOX17 3’UTR plasmid and a miR-151a-5p mimic. Data shown is one assay, representative of four independent experiments. N=3, a paired two-tailed t-test was used to test for statistical significance between controls and experimental sample.
4. Discussion
The generation of β-cells in vitro is an attractive option for cell therapy treatments for type 1 diabetes and a number of studies have demonstrated that insulin-expressing cells can be generated by the in vitro differentiation of human pluripotent stem cells. However, to date, these differentiation protocols are sub-optimal and in many cases are time-consuming, inefficient and highly variable. In part this is a result of an incomplete understanding of the regulatory processes involved in the differentiation of human pluripotent stem cells. One such process that has recently received increased attention is the control of gene expression by miRNAs. Although several miRNAs have been previously identified as playing a role in DE formation, few of these studies elucidated a function for these miRNAs in endoderm formation, and the target genes of these miRNAs are still largely unknown. In this study, we have attempted to further elucidate a role for miRNAs in the differentiation of pluripotent stem cells into DE, and to identify any differences in miRNA expression between iPSCs and ESCs during the differentiation process. As a first step, we derived iPSC lines according to published protocols and demonstrate the successful reprogramming of MRC5 and MRC9 fibroblasts. These iPSC lines express markers of pluripotency at levels comparable to the ESC lines used in this study, and were able to spontaneously differentiate into cells representing all three embryonic germ layers. Both ESCs and iPSCs could be differentiated into DE at high efficiency, although these experiments suggested that the H1 ESC line has a noticeably lower efficiency of differentiation into DE than the other cell lines used, which has also been demonstrated by other studies (27; 7).
Next, we used microarray technology to assess global changes in the profiles of miRNA expression in these cell lines after differentiation into DE. From the principal component and hierarchical clustering analyses, it was clear that cells cluster separately, based on both their differentiation status (DE or undifferentiated) and their origin (ESC or iPSC), suggesting that miRNAs may play a role in differentiation of these cells to DE. However, it was obvious from these analyses, and with our study design, that we could clearly see that the differences in miRNA profiles were greater between the two ESC lines in this study than between the two iPSC lines. This is not perhaps surprising since the two iPSC lines were derived from very similar starting cell populations using identical reprogramming methods, whereby the ESC lines have been generated by very distinct derivation procedures. In addition, perhaps at least as important as differences in cell derivation, are the effects of different culture conditions. In these experiments, the H9 ESCs were cultured on Matrigel™ while H1 ESCs and both iPSC lies were cultured on mouse feeders, which may, at least in part, explain the differences in the miRNA profiles observed between H1 and H9 ESC lines. Recognising that it is impossible to draw definitive conclusions from these data regarding the effects of culture on the miRNA expression profiles of the cell lines in our study, and given that the intention of the array experiments were to identify miRNAs that may play a role in differentiation into definitive endoderm, we did not investigate the role of culture conditions further.
From the array data, and through subsequent confirmation using qRT-PCR, we identified both miR-375 and miR-708 to be specifically upregulated in cells undergoing differentiation to DE, and both of these miRNAs have previously been described to be involved in this process. miR-516b was identified as specifically downregulated in differentiation to DE, and has not been previously described in this context. miR-151a-3p and miR-151a-5p were identified both as being involved in DE formation and as being differentially expressed between ESCs and iPSCs. There was no difference in the expression of these miRNAs in either undifferentiated ESCs vs. iPSCs, or in spontaneously differentiated ESCs vs. iPSCs, suggesting that this difference arises during differentiation and is specific to DE formation. While there have been several studies which have investigated the expression of miRNAs in both ESCs and iPSCs, with some studies finding differences in miRNA expression between the two cell types (19; 20; 21) and others finding no differences (22; 23), most of these studies have looked at differences between undifferentiated ESCs and iPSCs and to date there is little consensus on whether there are differences between the two cell types and what impact this may have on differentiation. For this reason, we have investigated miR-151a-3p and miR-151a-5p expression in our cells in more detail.
First, target prediction software was used to identify potential target genes for both miR-151a-3p and miR-151a-5p. TargetScan, miRDB and Pictar were chosen, since in a comparison of target prediction programs, these three, used either alone or in combination, had the best trade-off between sensitivity and specificity (33). Interestingly, SOX17 appeared on the list of predicted targets for miR-151a-5p in the results from both TargetScan and miRDB, and an interaction between SOX17 and miR-151a-5p has been recently described elsewhere (32). Subsequently, we used a luciferase assay, having first validated the approach using a previously known relationship between miR-375 and the 3’UTR of TIMM8A, to determine whether there was a direct interaction between miR-151a-5p and the SOX17 3’UTR. A reduction in luciferase was observed in the presence of the miR-151a-5p mimic, indicating that there is a direct binding interaction between the 3’UTR of SOX17 and miR-151a-5p.
Binding to SOX17 may represent a mechanism by which the differential expression of miR-151a-5p in the hES and iPS cell lines in this study may play a role in the efficiency with which these cells undergo differentiation to DE. It will be of particular interest to determine, in future studies, whether the manipulation of miR-151a-5p expression using miRNA mimics and/or inhibitors in iPS cells, during differentiation to definitive endoderm, can influence the efficiency of this process. It remains possible that the relationship between miR-151a-5p and SOX17 is part of a larger regulatory network of miRNAs and genes. Indeed, SOX17 is also targeted by another pancreatic specific miRNA, miR-200a, and it remains to be determined if there are additional miRNAs that can influence the expression of this key transcription factor during differentiation to DE. In addition, we have investigated only one of the potential targets of miR-151a-5p, and it may also be possible that miR-151a-5p plays a role in DE formation through another mechanism entirely.
Understanding the roles that miRNAs play in pluripotency and differentiation will clearly be important in determining the most appropriate starting cell type for the production of materials to be used in a cell therapy context. However, this knowledge may also lead to an improvement in differentiation protocols. As well as potentially providing additional markers for each stage of differentiation, recent studies have demonstrated the ability of miRNAs to influence cell fate, which is actually highly appealing for a number of reasons. They have the potential to directly and immediately alter gene transcription, which may reduce the time required for in vitro differentiation leading to increased efficiency and reduced costs for the manufacture of cell therapy products. They can also be transiently expressed in a cell and so do not permanently integrate into the cellular genome, which is an important safety consideration and are inherently less variable than the recombinant growth factors commonly used in differentiation protocols. One of the clearest indications of the ability of miRNAs to influence cell fate is through the demonstration that pluripotency-associated miRNAs are able to reprogram somatic cells to iPSCs without the need for additional reprogramming factors (34). However, we now know that miRNAs can also be used to induce differentiation. Although there have been few examples of this in driving pancreatic development, perhaps reflecting the current lack of understanding of the role of miRNAs in this process, one report did demonstrate that the overexpression of a panel of miRNAs in mouse ESCs resulted in the up-regulation of the DE markers SOX17 and FOXA2, suggesting an increase in differentiation efficiency (17). In addition, Hinton et al. (2010) showed that manipulation of miR-375 in human ESCs resulted in altered expression of TIMM8A, although this gene has not previously been implicated in DE formation and the authors did not observe any change in differentiation efficiency. Similarly, a recent study elucidated the temporal expression of several miRNAs known to be involved in pancreatic development, and correlated these with genes known to be expressed at specific stages of differentiation (35). This study showed that manipulation of miR-375 expression in human ESCs resulted in altered expression of HNF1B and SOX9, transcription factors that are important in pancreatic development, but a direct interaction was not demonstrated. More recently, miR-375 overexpression has been shown to promote pancreatic endocrine differentiation in human ESCs in the absence of any extrinsic factors and to give rise to cells that exhibited characteristics similar to those of mature islets, including glucose-stimulated insulin release (36). This work has been extended very recently to human iPSCs, where the same researchers have demonstrated the use of miRNAs in the pancreatic specification of patient-specific iPSCs (37). These studies highlight the potentially important role that miRNAs may play in reaching the ultimate goal of a β-cell replacement therapy for type 1 diabetes.
Supplementary Material
Acknowledgements
GAR was supported by a Wellcome Trust Senior Investigator (WT098424AIA), MRC Programme (MR/J0003042/1), Diabetes UK (11/0004210), BBSRC Project Grants and a Royal Society Wolfson Research Merit Award. The work leading to this publication has received support from the Innovative Medicines Initiative Joint Undertaking under grant agreement n° 155005 (IMIDIA), resources of which are composed of financial contribution from the European Union's Seventh Framework Programme (FP7/2007-2013) and EFPIA companies’ in kind contribution (G.A.R.). This report was also [in part], independent research which was commissioned and funded by the Department of Health Policy Research Programme (NIBSC Regulatory Science Research Unit, 044/0069) (N.F., M.M., C.B.). The views expressed in this publication are those of the author(s) and not necessarily those of the Department of Health.
Abbreviations
- ESC
Embryonic stem cell
- iPSC
induced pluripotent stem cell
- T1DM
type 1 diabetes mellitus
- T2DM
type 2 diabetes mellitus
- miRNA
microRNA
- DE
definitive endoderm
Footnotes
Financial disclosure: None
Reference List
- (1).Maehr R, Chen S, Snitow M, Ludwig T, Yagasaki L, Goland R, et al. Generation of pluripotent stem cells from patients with type 1 diabetes. Proc Natl Acad Sci U S A. 2009 Sep 15;106(37):15768–73. doi: 10.1073/pnas.0906894106. [DOI] [PMC free article] [PubMed] [Google Scholar]
- (2).Patterson M, Chan DN, Ha I, Case D, Cui Y, Van HB, et al. Defining the nature of human pluripotent stem cell progeny. Cell Res. 2012 Jan;22(1):178–93. doi: 10.1038/cr.2011.133. [DOI] [PMC free article] [PubMed] [Google Scholar]
- (3).Blum B, Hrvatin SS, Schuetz C, Bonal C, Rezania A, Melton DA. Functional beta-cell maturation is marked by an increased glucose threshold and by expression of urocortin 3. Nat Biotechnol. 2012 Mar;30(3):261–4. doi: 10.1038/nbt.2141. [DOI] [PMC free article] [PubMed] [Google Scholar]
- (4).Kroon E, Martinson LA, Kadoya K, Bang AG, Kelly OG, Eliazer S, et al. Pancreatic endoderm derived from human embryonic stem cells generates glucose-responsive insulin-secreting cells in vivo. Nat Biotechnol. 2008 Apr;26(4):443–52. doi: 10.1038/nbt1393. [DOI] [PubMed] [Google Scholar]
- (5).Xie R, Everett LJ, Lim HW, Patel NA, Schug J, Kroon E, et al. Dynamic chromatin remodeling mediated by polycomb proteins orchestrates pancreatic differentiation of human embryonic stem cells. Cell Stem Cell. 2013 Feb 7;12(2):224–37. doi: 10.1016/j.stem.2012.11.023. [DOI] [PMC free article] [PubMed] [Google Scholar]
- (6).D'Amour KA, Bang AG, Eliazer S, Kelly OG, Agulnick AD, Smart NG, et al. Production of pancreatic hormone-expressing endocrine cells from human embryonic stem cells. Nat Biotechnol. 2006 Nov;24(11):1392–401. doi: 10.1038/nbt1259. [DOI] [PubMed] [Google Scholar]
- (7).Nostro MC, Sarangi F, Ogawa S, Holtzinger A, Corneo B, Li X, et al. Stage-specific signaling through TGFbeta family members and WNT regulates patterning and pancreatic specification of human pluripotent stem cells. Development. 2011 Mar;138(5):861–71. doi: 10.1242/dev.055236. [DOI] [PMC free article] [PubMed] [Google Scholar]
- (8).Lynn FC, Skewes-Cox P, Kosaka Y, McManus MT, Harfe BD, German MS. MicroRNA expression is required for pancreatic islet cell genesis in the mouse. Diabetes. 2007 Dec;56(12):2938–45. doi: 10.2337/db07-0175. [DOI] [PubMed] [Google Scholar]
- (9).Francis NA, Moore M, Rutter GA, Burns CJ. The Role of MicroRNAs in the Pancreatic Differentiation of Pluripotent Stem Cells. MicroRNA. 2014 Aug 1;3 doi: 10.2174/2211536603666140522003220. [DOI] [PubMed] [Google Scholar]
- (10).Tzur G, Levy A, Meiri E, Barad O, Spector Y, Bentwich Z, et al. MicroRNA expression patterns and function in endodermal differentiation of human embryonic stem cells. PLoS One. 2008;3(11):e3726. doi: 10.1371/journal.pone.0003726. [DOI] [PMC free article] [PubMed] [Google Scholar]
- (11).Hinton A, Afrikanova I, Wilson M, King CC, Maurer B, Yeo GW, et al. A distinct microRNA signature for definitive endoderm derived from human embryonic stem cells. Stem Cells Dev. 2010 Jun;19(6):797–807. doi: 10.1089/scd.2009.0224. [DOI] [PubMed] [Google Scholar]
- (12).Porciuncula A, Zapata N, Guruceaga E, Agirre X, Barajas M, Prosper F. MicroRNA signatures of iPSCs and endoderm-derived tissues. Gene Expr Patterns. 2013 Jan;13(1–2):12–20. doi: 10.1016/j.gep.2012.08.002. [DOI] [PubMed] [Google Scholar]
- (13).Courtney ML, Jones PM, Burns CJ. Importance of quantitative analysis in the generation of insulin-expressing cells from human embryonic stem cells. Pancreas. 2010 Jan;39(1):105–7. doi: 10.1097/MPA.0b013e3181b79d3c. [DOI] [PubMed] [Google Scholar]
- (14).Poy MN, Eliasson L, Krutzfeldt J, Kuwajima S, Ma X, Macdonald PE, et al. A pancreatic islet-specific microRNA regulates insulin secretion. Nature. 2004 Nov 11;432(7014):226–30. doi: 10.1038/nature03076. [DOI] [PubMed] [Google Scholar]
- (15).Kloosterman WP, Lagendijk AK, Ketting RF, Moulton JD, Plasterk RH. Targeted inhibition of miRNA maturation with morpholinos reveals a role for miR-375 in pancreatic islet development. PLoS Biol. 2007 Aug;5(8):e203. doi: 10.1371/journal.pbio.0050203. [DOI] [PMC free article] [PubMed] [Google Scholar]
- (16).Poy MN, Hausser J, Trajkovski M, Braun M, Collins S, Rorsman P, et al. miR-375 maintains normal pancreatic alpha- and beta-cell mass. Proc Natl Acad Sci U S A. 2009 Apr 7;106(14):5813–8. doi: 10.1073/pnas.0810550106. [DOI] [PMC free article] [PubMed] [Google Scholar]
- (17).Fu S, Fei Q, Jiang H, Chuai S, Shi S, Xiong W, et al. Involvement of histone acetylation of Sox17 and Foxa2 promoters during mouse definitive endoderm differentiation revealed by microRNA profiling. PLoS One. 2011;6(11):e27965. doi: 10.1371/journal.pone.0027965. [DOI] [PMC free article] [PubMed] [Google Scholar]
- (18).Liao X, Xue H, Wang YC, Nazor KL, Guo S, Trivedi N, et al. Matched miRNA and mRNA signatures from an hESC-based in vitro model of pancreatic differentiation reveal novel regulatory interactions. J Cell Sci. 2013 Sep 1;126(Pt 17):3848–61. doi: 10.1242/jcs.123570. [DOI] [PMC free article] [PubMed] [Google Scholar]
- (19).Chin MH, Mason MJ, Xie W, Volinia S, Singer M, Peterson C, et al. Induced pluripotent stem cells and embryonic stem cells are distinguished by gene expression signatures. Cell Stem Cell. 2009 Jul 2;5(1):111–23. doi: 10.1016/j.stem.2009.06.008. [DOI] [PMC free article] [PubMed] [Google Scholar]
- (20).Neveu P, Kye MJ, Qi S, Buchholz DE, Clegg DO, Sahin M, et al. MicroRNA profiling reveals two distinct p53-related human pluripotent stem cell states. Cell Stem Cell. 2010 Dec 3;7(6):671–81. doi: 10.1016/j.stem.2010.11.012. [DOI] [PubMed] [Google Scholar]
- (21).Wilson KD, Venkatasubrahmanyam S, Jia F, Sun N, Butte AJ, Wu JC. MicroRNA profiling of human-induced pluripotent stem cells. Stem Cells Dev. 2009 Jun;18(5):749–58. doi: 10.1089/scd.2008.0247. [DOI] [PMC free article] [PubMed] [Google Scholar]
- (22).Koyanagi-Aoi M, Ohnuki M, Takahashi K, Okita K, Noma H, Sawamura Y, et al. Differentiation-defective phenotypes revealed by large-scale analyses of human pluripotent stem cells. Proc Natl Acad Sci U S A. 2013 Nov 20; doi: 10.1073/pnas.1319061110. [DOI] [PMC free article] [PubMed] [Google Scholar]
- (23).Razak SR, Ueno K, Takayama N, Nariai N, Nagasaki M, Saito R, et al. Profiling of microRNA in human and mouse ES and iPS cells reveals overlapping but distinct microRNA expression patterns. PLoS One. 2013;8(9):e73532. doi: 10.1371/journal.pone.0073532. [DOI] [PMC free article] [PubMed] [Google Scholar]
- (24).Lewis SL, Tam PP. Definitive endoderm of the mouse embryo: formation, cell fates, and morphogenetic function. Dev Dyn. 2006 Sep;235(9):2315–29. doi: 10.1002/dvdy.20846. [DOI] [PubMed] [Google Scholar]
- (25).Yamanaka S. Strategies and new developments in the generation of patient-specific pluripotent stem cells. Cell Stem Cell. 2007 Jun 7;1(1):39–49. doi: 10.1016/j.stem.2007.05.012. [DOI] [PubMed] [Google Scholar]
- (26).D'Amour KA, Agulnick AD, Eliazer S, Kelly OG, Kroon E, Baetge EE. Efficient differentiation of human embryonic stem cells to definitive endoderm. Nat Biotechnol. 2005 Dec;23(12):1534–41. doi: 10.1038/nbt1163. [DOI] [PubMed] [Google Scholar]
- (27).Bock C, Kiskinis E, Verstappen G, Gu H, Boulting G, Smith ZD, et al. Reference Maps of human ES and iPS cell variation enable high-throughput characterization of pluripotent cell lines. Cell. 2011 Feb 4;144(3):439–52. doi: 10.1016/j.cell.2010.12.032. [DOI] [PMC free article] [PubMed] [Google Scholar]
- (28).Git A, Dvinge H, Salmon-Divon M, Osborne M, Kutter C, Hadfield J, et al. Systematic comparison of microarray profiling, real-time PCR, and next-generation sequencing technologies for measuring differential microRNA expression. RNA. 2010 May;16(5):991–1006. doi: 10.1261/rna.1947110. [DOI] [PMC free article] [PubMed] [Google Scholar]
- (29).Kim N, Kim H, Jung I, Kim Y, Kim D, Han YM. Expression profiles of miRNAs in human embryonic stem cells during hepatocyte differentiation. Hepatol Res. 2011 Feb;41(2):170–83. doi: 10.1111/j.1872-034X.2010.00752.x. [DOI] [PubMed] [Google Scholar]
- (30).Fu H, Tie Y, Xu C, Zhang Z, Zhu J, Shi Y, et al. Identification of human fetal liver miRNAs by a novel method. FEBS Lett. 2005 Jul 4;579(17):3849–54. doi: 10.1016/j.febslet.2005.05.064. [DOI] [PubMed] [Google Scholar]
- (31).Kanai-Azuma M, Kanai Y, Gad JM, Tajima Y, Taya C, Kurohmaru M, et al. Depletion of definitive gut endoderm in Sox17-null mutant mice. Development. 2002 May;129(10):2367–79. doi: 10.1242/dev.129.10.2367. [DOI] [PubMed] [Google Scholar]
- (32).Chiyomaru T, Yamamura S, Zaman MS, Majid S, Deng G, Shahryari V, et al. Genistein suppresses prostate cancer growth through inhibition of oncogenic MicroRNA-151. PLoS One. 2012;7(8):e43812. doi: 10.1371/journal.pone.0043812. [DOI] [PMC free article] [PubMed] [Google Scholar]
- (33).Witkos TM, Koscianska E, Krzyzosiak WJ. Practical Aspects of microRNA Target Prediction. Curr Mol Med. 2011 Mar;11(2):93–109. doi: 10.2174/156652411794859250. [DOI] [PMC free article] [PubMed] [Google Scholar]
- (34).Anokye-Danso F, Trivedi CM, Juhr D, Gupta M, Cui Z, Tian Y, et al. Highly efficient miRNA-mediated reprogramming of mouse and human somatic cells to pluripotency. Cell Stem Cell. 2011 Apr 8;8(4):376–88. doi: 10.1016/j.stem.2011.03.001. [DOI] [PMC free article] [PubMed] [Google Scholar]
- (35).Wei R, Yang J, Liu GQ, Gao MJ, Hou WF, Zhang L, et al. Dynamic expression of microRNAs during the differentiation of human embryonic stem cells into insulin-producing cells. Gene. 2013 Apr 15;518(2):246–55. doi: 10.1016/j.gene.2013.01.038. [DOI] [PubMed] [Google Scholar]
- (36).Lahmy R, Soleimani M, Sanati MH, Behmanesh M, Kouhkan F, Mobarra N. Pancreatic islet differentiation of human embryonic stem cells by microRNA overexpression. J Tissue Eng Regen Med. 2013 Jul 30; doi: 10.1002/term.1787. [DOI] [PubMed] [Google Scholar]
- (37).Lahmy R, Soleimani M, Sanati MH, Behmanesh M, Kouhkan F, Mobarra N. MiRNA-375 promotes beta pancreatic differentiation in human induced pluripotent stem (hiPS) cells. Mol Biol Rep. 2014 Apr;41(4):2055–66. doi: 10.1007/s11033-014-3054-4. [DOI] [PubMed] [Google Scholar]
Associated Data
This section collects any data citations, data availability statements, or supplementary materials included in this article.


