Abstract
Biomineralization at the organic-inorganic interface is critical to many biology material functions in vitro and in vivo. Recombinant silk-silica fusion peptides are organic-inorganic hybrid material systems that can be effectively used to study and control biologically-mediated mineralization due to the genetic basis of sequence control. However, to date, the mechanisms by which these functionalized silk-silica proteins trigger the differentiation of human mesenchymal stem cells (hMSCs) to osteoblasts remain unknown. To address this challenge, we analyzed silk-silica surfaces for silica-hMSC receptor binding and activation, and the intracellular pathways involved in the induction of osteogenesis on these bioengineered biomaterials. The induction of gene expression of αVβ3 integrin, all three Mitogen-activated Protein Kinsases (MAPKs) as well as c-Jun, Runt-related Transcription Factor 2 (Runx2) and osteoblast marker genes was demonstrated upon growth of the hMSCs on the silk-silica materials. This induction of key markers of osteogenesis correlated with the content of silica on the materials. Moreover, computational simulations were performed for silk/silica-integrin binding which showed activation of αVβ3 integrin in contact with silica. This integrated computational and experimental approach provides insight into interactions that regulate osteogenesis towards more efficient biomaterial designs.
Keywords: spider silk-chimera, silica surface, biomineralization, intracellular pathways, multiscale modeling
Graphical abstract
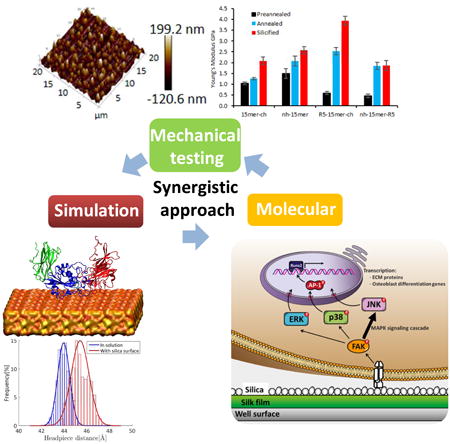
This work describes the intracellular pathways leading to osteogenesis for recombinant silk–chimera proteins with potential utility in regenerative medicine. Using an integrated computational and experimental approach we provide insight into key interactions for the control of osteogenesis, demonstrating the involvement of integrin αVβ3, and MAPK pathways in the induction of osteogenic markers promoted by silica surfaces. This is critical for future optimized designs to generate mineralized materials.
1. Introduction
Mineralized polymeric biomaterials provide cell-instructive surfaces with utility towards tissue repair and regeneration. As such, improved insight into key features of these biomaterials that modulate the biological outcomes would be useful.[1] Silk fibroin is useful as biomaterial due to its biocompatibility and outstanding mechanical and physical properties, [2-8] as well as due to the potential for fine-tuning properties through bioengineered sequence modification to incorporate diverse functional domains.[8-11] Organic-inorganic biomaterial systems, such as silk-silica materials, provide suitable systems for the study of tissue regeneration. In this study we focused on silk-silica chimeras,[8,12-16] the chimeras are comprised by a core census repeat [(SGRGGLGGQGAGAAAAAGGAGQGGYGGLGSQGT)×15] derived from the spider Nephila clavipes major ampullate dragline silk, with a MW of ∼40 KDa, which serves as an organic scaffold that controls material stability - by increasing resilience to degradation and mechanical strength, both essential properties in the study of biomaterials for tissue regeneration -, fused with the silica-promoting peptide R5 (SSKKSGSYSGSKGSKRRIL) derived from the Cylindrotheca fusiformis silaffin gene.[17] The R5 peptide has been previously used to functionalize recombinant spider silk-like proteins, demonstrating that it did not disrupt the mineral deposition ability of the R5 domain.[13] In previous studies we determined that the N-terminal location of the R5 peptide promoted improved control of silica precipitation resulting in a full coverage of the film surface in a small size range of silica particles, approx. 400 nm.[15] Computational simulation studies showed that the location of the charged biomineralization domain had only a minor effect on protein folding and did not alter the surface exposure of charged amino acids, in agreement with experimental data.[16] Moreover, cell compatibility and the ability to promote hMSC differentiation were demonstrated for variants of these fusion proteins.[15]
In the present study, the goal was to reveal the mechanism(s) by which the silk-silica biomaterials stimulate osteogenesis. The aim was to identify key intracellular events that occur after the initial adhesion of hMSCs to the scaffolds to identify modes to optimize the enhancement of osteoblast function.
Integrins, the most important family of cell adhesion receptors, are heterodimeric transmembrane proteins consisting of associated α and β subunits, with a large extracellular domain and a short cytoplasmic tail.[18] Integrins interact with extracellular matrix (ECM) proteins, triggering activation of intracellular pathways, such as Mitogen-Activated Protein Kinase (MAPK), mediating cell migration and adhesion, which are important processes for embryogenesis, tissue development, angiogenesis, and immune systems.[19-24] Integrins αVβ3 and α5β1 are key mediators of cell adhesion and differentiation, and their role in the differentiation of MSCs is of interest in the development of cell instructive biomaterials.[25, 26] The crystal structure of the extracellular segment of αvβ3 integrin in the absence of ligand, showed a bent conformation that represented the inactive and regulatable form of the integrin.[27] Shortly after this first structure was published, the crystal structure of the extracellular segment of αvβ3 integrin in the presence of a high affinity ligand was also published, revealing tertiary and quaternary changes.[28] Additionally, the use of electron microscopy showed that the addition of a high affinity ligand mimetic peptide resulted in a switchblade-like opening to yield an active and extended structure.[29,30] Computational studies using molecular dynamic (MD) simulations, offer tools to explain the change in folding, and therefore, on the activation state of the integrins.
The MAPK cascades that include ERK (extracellular signal-regulated protein kinases), p38 and JNK (c-Jun N-terminal kinase), have been extensively documented to link cytoplasmic signaling molecules with nuclear proteins through a phosphorylation cascade, altering the expression of transcription factors which play a role in affecting osteoblast activity.[31-37] The activated kinase translocates to the nucleus where it activates AP-1 immediate-early genes c-Jun and c-Fos, ultimately resulting in the modification of Runt-related Trancription Factor 2 (Runx2), which regulates proliferation and differentiation of bone cells.[37-40]
Previous studies analyzing the activation of integrins and intracellular components by different inorganic materials showed a diversity of responses.[25,41-43] Consil® bioactive glass particles, modulated selective cell signaling pathways including αV integrin, the ERK and p38 MAPKs, and the immediate-early gene c-Jun.[25] Beta-tricalcium phosphate (β-TCP) exerted osteoconductivity through the α2β1 integrin and downstream ERK signaling pathway.[41] Studies using calcium silicate cements with different Si/Ca molar ratios demonstrated that Si-rich cement induced α2β1 integrin expression and activation of ERK and p38 signaling pathways more effectively than the Ca component did, while Ca-rich cement induced αvβ3 integrin expression.[42] Finally, Biphasic calcium phosphate (BCP) ceramics significantly up-regulated integrin α2 and α3 genes, as well as down-stream ERK and p38 MAPK pathways.[43]
Here we analyzed the organic-inorganic interface generated with recombinant silk-silica chimeras through an integrated modeling and experimental approach with the aim to provide insight into sequence–structure–function relationships for control of mineralized protein biomaterial structures.
2. Results and Discussion
2.1. Recombinant production of silk-silica fusion proteins and biomineralization
The designed protein sequences and their successful expression/purification are shown in Figure 1. The controls included: nh-15mer with His-tag positioned at N-terminal and 15mer-ch with His-tag at C-terminal. The recombinant silk-silica variants that were successfully generated and expressed included: silk-silica fusion proteins carrying the silica binding peptide R5 either at N- or C-terminus of the spider silk 15mer (R5-15mer-ch, nh-15mer-R5) and the His-tag positioned on the opposite terminus (Figure 1).
Figure 1.
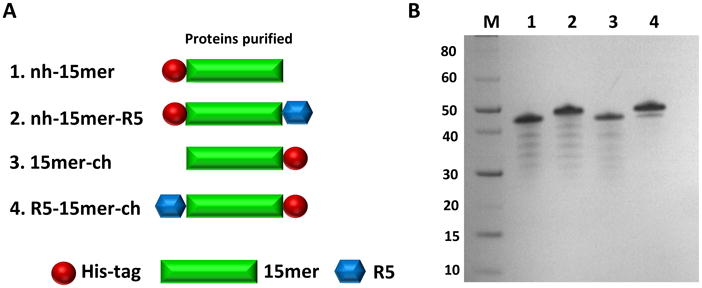
A) Schematic representation of silk-silica fusion proteins design strategy; His-tag (red block) has been added to spider silk 15mer (green block) at N-terminal end of nh-15mer and nh-15mer-R5 constructs, and C-terminal end of 15mer-ch and R5-15mer-ch constructs; R5 domain (blue block) has been added to the C-terminal of nh-15mer-R5 and N-terminal of R5-15mer-ch. B) SDS-PAGE of purified recombinant silk-silica chimeric proteins nh-15mer (∼40 kDa, 1), nh-15mer-R5 (∼43 kDa, 2), 15mer-ch (∼40 kDa, 3) and R5-15mer-ch (∼43 kDa, 4), were run on the 4%-12% Bis-Tris acrylamide gel stained with Simple Blue dye. Marker (M) sizes are indicated on the left.
2.2. Characterization of silk films
As a first approach for the material characterization, the topography and surface deposition of silica in the films were analyzed. Figure 2Ai-iii shows AFM images for the R5-15mer-ch silk chimera; preannealed, annealed and silicified, respectively. Each process results in further roughening of the surface as the protein film undergoes structural changes when annealed and then when silica is deposited during mineralization. AFM analysis showed that the R5-15mer-ch films exhibited a uniform surface of peaks due to the the uniform presence of silica particles (Figure 2Aiii), while the nh-15mer-R5 surfaces had two populations of peak sizes (Figure 2Bi). These results supported previous findings of reduced control of silicification for the R5 located at the C-terminus,[15] while the 15mer-ch control sample showed no uniform surface structures after silicification (Figure 2Bii).
Figure 2.
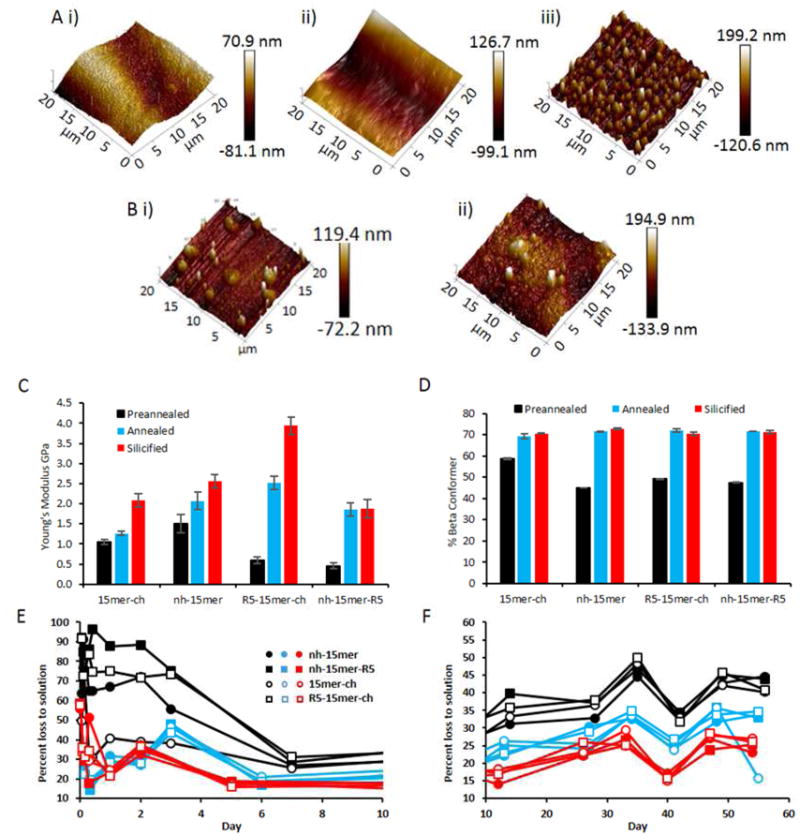
R5-15mer-ch constructions allows the best control over silicification and the deposition of silica particles aid in stiffening the material. A) AFM images for the R5-15mer-ch silk film i) pre-annealed ii) annealed and iii) silicified. B) Silicified films i) nh-15mer-R5 ii) 15mer-ch. C) Young's modulus measurements for the silk fusion proteins with an assumed Poisson's ratio of 0.3, N=20. D) Beta sheet content of pre-annealed, annealed and silicified silk chimeras and controls, N=3. E) and F) Protein concentration of PBS supernatant in the presence of 0.6mg silk films; preannealed (black), annealed (blue) and silicified (red) over time.
The secondary protein structure of each chimeric silk film was also quantified by applying peak fitting[44] to FTIR-ATR spectra over the amide I and amide II regions (Figure S1). The profile of the amide I peak depends largely on the stretching vibrations of the C=O group. Figure 2C shows the Young's modulus for the pre-annealed, annealed and silicified silk films. The addition of the R5 binding domain lowered the stiffness of the raw silk films, however, once annealed the R5 bound chimeras rivaled the moduli of the controls in the study. Further, a substantially larger increase was seen in Young's modulus after silicification for the R5-15mer-ch sample compared with the control and nh-15mer-R5 samples. The R5-15mer-ch was previously been shown to have the best control over silicification,[11] confirming that the binding of silica particles to produce silk composites aids in stiffening the material, particularly as there is no change in protein structure during the silicification process. As seen previously,[15] the annealing of silk films resulted in increased β-conformer content, an increase of around 30%, with no significant difference between R5 bound silk films and their control counterparts, Figure 2D. Silicification carried out on annealed films had no effect on the protein structure with respect to the percentage of β-conformer content, which remained at 70%, suggesting that binding of silica particles did not affect the protein structure of these samples.
Estimation of in vivo lifetime of biomaterials and the effect of sample processing on this life time is critical information. Silk composites are intended for temporary use in the body, as the material is designed to aid bone regeneration and then naturally and harmlessly degrade over a designated time frame. Figures 2E and 2F show the in vitro degradation of silk films under conditions that mimic in vivo conditions. The black lines represent preannealed films which are comparatively more soluble (for all samples) in PBS than the annealed films (blue lines), showing that the biodegradability of silk biomaterials can be tailored via the annealing process. Silicification provided a slight gain in resilience to degradation, and previous data suggested that silica particle sizes were bio-absorbable.[15] Table 1 summarizes the mechanical properties for the silicified chimeras and control silk samples. There was a direct correlation between the increased percentage of β-conformer and Young's modulus of the samples, which is reflected in the heightened tolerance towards dissolution in PBS (Figure 2E).
Table 1.
Wettability, percent beta conformer and Young's modulus data collected for films fabricated from the 15mer-ch, nh-15mer, R5-15mer-ch and nh-15mer-R5 genetic constructs. Contact angle: N=20, surface energies: N=3, Young's modulus N=20.
| 15mer-ch | nh-15mer | R5-15mer-ch | nh-15mer-R5 | |
|---|---|---|---|---|
| Contact Angle θ: | ||||
| Preannealed | 56.4 ± 0.6 | 46.5 ± 1.7 | 43.4 ± 0.7 | 55.0 ± 1.2 |
| Annealed | 84.2 ± 0.02 | 115.7 ± 0.02 | 90.9 ± 0.03 | 74.6 ± 0.003 |
| Surface Energy Annealed* | 30.3 ± 0.5 | 33.9 ± 0.8 | 26.4 ± 0.9 | 25.8 ± 2.8 |
| Percent Beta Structure: | ||||
| Preannealed | 58.59 ± 0.42 | 44.87 ± 0.04 | 49.11 ± 0.11 | 47.36 ± 0.16 |
| Annealed | 69.41 ± 1.17 | 71.56 ± 0.15 | 72.06 ± 0.83 | 71.55 ± 0.08 |
| Silicified | 70.52 ± 0.18 | 72.70 ± 0.43 | 70.32 ± 0.85 | 71.16 ± 0.85 |
| Young's Modulus GPa: | ||||
| Preannealed | 1.04 ± 0.06 | 1.50 ± 0.23 | 0.60 ± 0.08 | 0.45 ± 0.08 |
| Annealed | 1.26 ± 0.05 | 2.07 ± 0.22 | 2.52 ± 0.17 | 1.86 ± 0.16 |
| Silicified | 2.08 ± 0.17 | 2.56 ± 0.16 | 3.94 ± 0.21 | 1.87 ± 0.23 |
2.3. αVβ3 Integrin was induced and activated by silk-silica films
To analyze the activation of intracellular pathways in the presence and the absence of silica surfaces, 15mer-ch and R5-15mer-ch proteins were selected, based on previous and current results showing that the nh-15mer control induced same level of silica precipitation as the R5 chimeras, while the 15mer-ch induced low silica precipitation.[16] In the present work, R5-15mer-ch generated a uniform silica particle presence compared to nh-15mer-R5 (Figure 2B). As a first approach, we aimed to determine how the silk-silica films promoted the osteogenesis of hMSCs. hMSCs were seeded on 15mer-ch and R5-15mer-ch films, with or without silicification, and on tissue culture plastic (TCP) for 1 day. Gene expression analyses were monitored by qPCR in order to compare levels of gene expression of a set of genes involved in osteogenesis: if the fold induction or ratio vs control expression was higher than 2, the gene was induced; while if the fold induction was lower than 0.5, the gene was not induced. When compared to TCP, cells seeded on non-silicified films showed no difference in expression of integrin subunits (Figure 3A). Meanwhile, the cells seeded on the silicified films showed increased gene expression of α5, αV and β3 integrin subunits, but not the β1 integrin subunit (Figure 3A). It is worth noting that the induction observed was 10-fold higher for α5 and between 5- and 10-fold higher than TCP for αV for the 15mer-ch and R5-15mer-ch, respectively (Figure 3A). For the β3 integrin subunit this increase was even higher, 8-log fold (Figure 3A).
Figure 3.
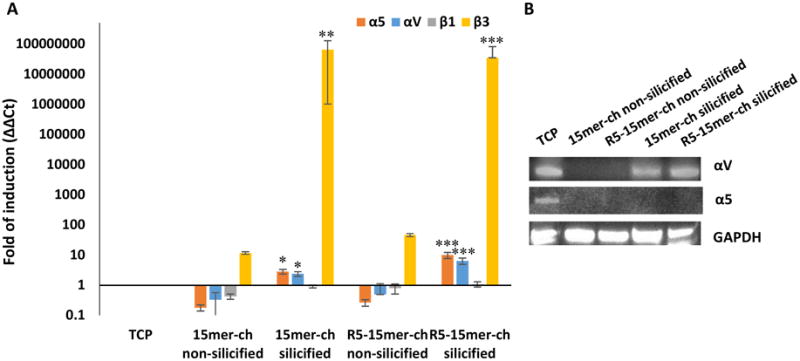
αVβ3 integrin was induced in contact with the silica surface. A) Gene expression of α5 (orange bars), αV (blue bars), β1 (gray bars) and β3 (yellow bars) subunits of hMSCs seeded on tissue culture plastic (TPC), 15mer-ch and R5-15mer-ch films non-silicified and silicified. B) Immunoblotting analysis of αV and α5 integrin subunits. Data represents mean ± SD (n=3) *: p<0.05; **: p <0.01; ***: p <0.001.
We then investigated the presence of the proteins in these samples by immunoblotting to gain an understanding on integrin expressions in response to the material features. Neither of the subunits increased on cells seeded on the non-silicified films (Figure 3B). In contrast, there was an increase in αV integrin subunits on cells seeded on both silicified the 15mer-ch and R5-15mer-ch films, where the increase was higher for the R5-15mer-ch chimera. However, there was no α5 integrin subunit detected (Figure 3B).
To further analyze these results, we performed the computational modeling studies. Molecular dynamic (MD) simulations offer a tool to explain the change in folding of the integrins associated with their activation, due to their interactions with silicified or non-silicified (silk-chimera protein) surfaces. For each integrin, simulation of the folding of integrin in solution was used as a control with respect to the integrin in contact with silicified surface. The head piece opening has been used as a sign of activation of integrin.[30] To quantify the opening, the distance between the center of mass of the β propeller domain from the α leg of the integrin (residues α250–438) and the hybrid domain from β leg of the integrin (residues β55-106 and β356–434) was calculated using simulations from the integrin subunit in solution (Figure 4A), in contact with the silica surface (Figure 4B), and in contact with the silk-chimera protein surface (Figure 4C).For each condition, 10 ns replica exchange molecular dynamics of the system in implicit solvent followed by 20 ns regular explicit solvent MD simulations of representative structures from REMD were performed to sample the most probable folding of the integrin protein. Figure 5A-B describes equilibration of the αVβ3 integrin (Figure 5A) and α5β1 integrin (Figure 5B) proteins in explicit solvent by the decreasing rate of change in the root-mean-square deviation (RMSD). Convergence of up to more than 85% of the final RMSD value in each case, based on the fitted function (Equation S1, Table S1), was considered sufficient to start sampling protein conformation. The head piece openings of the proteins are reported by averaging the results over the last 5 ns of simulations. Only αVβ3 integrin was activated in contact with the silicified surfaces, since the head piece opens up with respect to the integrin in solution (Figure 5C, E), while there was a decrease in head piece distance in the α5β1 integrin (Figure 5D, F). Moreover, silicification of the surface was essential for the activation of integrin αVβ3, as the integrin did not open up in contact with silk chimera protein (Figure 5C, E). In addition, key amino acids involved in the interaction of αVβ3 integrin with silicified surfaces were determined. Thr136 and Thr182 in the β subunit and Met1 18 in the α subunit were crucial in the interaction of αVβ3 integrin (Figure S2A), as their mutation in silico to Ala did not result in the opening of the head piece (Figure S2B-C). These results demonstrate that the silica surface, not the protein silk-chimera surface, induced an increase in αVβ3 integrin gene expression and that this interaction activated the protein as observed by computational modeling. The involvement of this integrin in in vitro osteoblast differentiation has also been reported for Consil bioactive glass particles and Ca-rich cements.[25,42]
Figure 4.
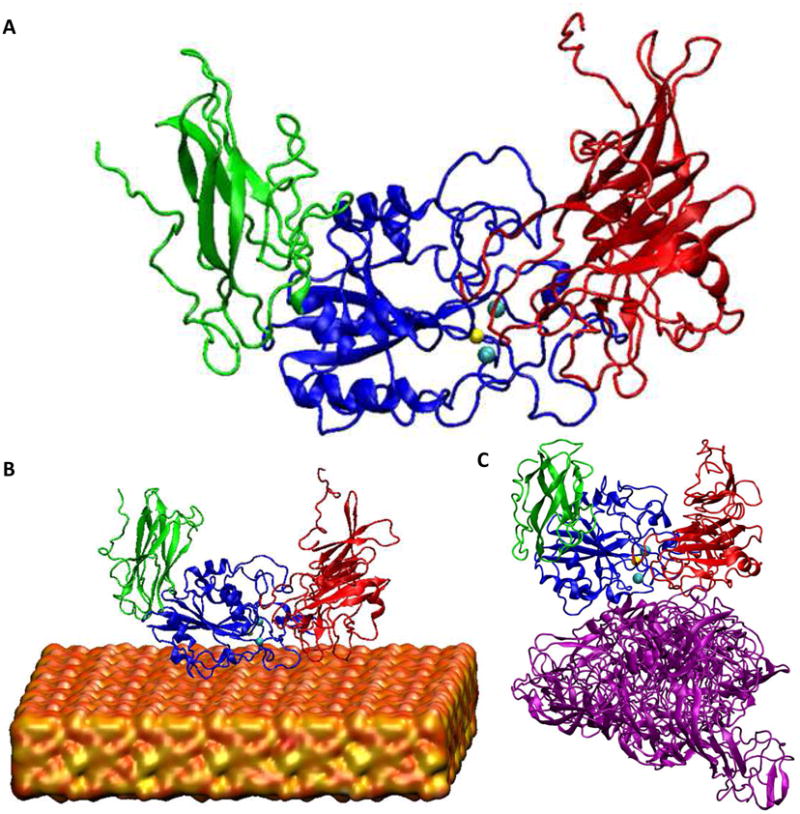
Simulated head piece domain of the integrin, based on molecular dynamics modeling. A) Integrin in solution. B) Integrin in contact with silica surface, modeled as having 4.7 silanol groups per nm2 and 0.45 siloxide groups per nm2.[51] C) Integrin in contact with silk-chimera protein surface. Green: Hybrid domain of the β leg; Blue: βA domain of the β leg; Red: propeller domain of the α leg; Purple: silk-chimera protein; Orange: silica surface; Yellow: Mg2+ cation; Cyan: Ca2+ cation. Water molecules are not shown for clarity.
Figure 5.
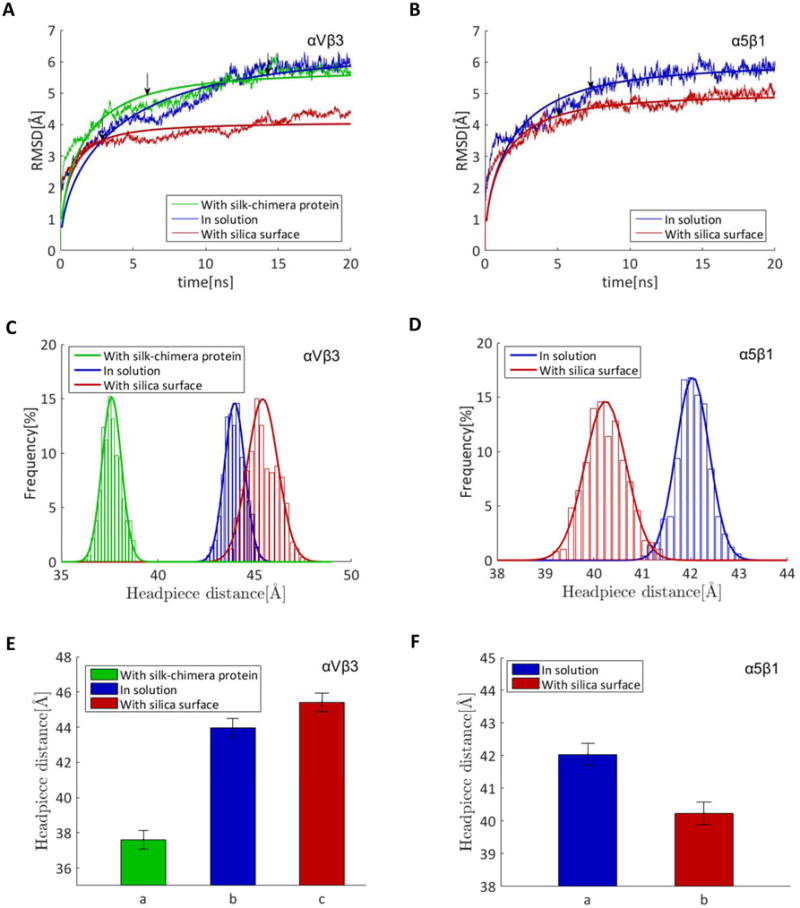
αVβ3 integrin and not α5β1 integrin is activated in the presence of silica in atomistic simulations. A, B) Root-mean-square deviation (RMSD) of the αVβ3 (A) and α5β1 (B) structures. Arrows represent the time of converging to 85% of the final RMSD values based on the fitted function (Supplementary Information part A) reported by averaging over the last 5 ns of the simulation. C-F) Activation of integrins measured as distribution of head piece distance (C and D) and average of head piece opening (E and F) compared to integrin in solution. Figure C and E represent simulations for αVβ3 integrin. Figure D and F represent simulations for α5β1 integrin.
2.4. Silk-silica films promote hMSCs differentiation via αVβ3 integrin activation
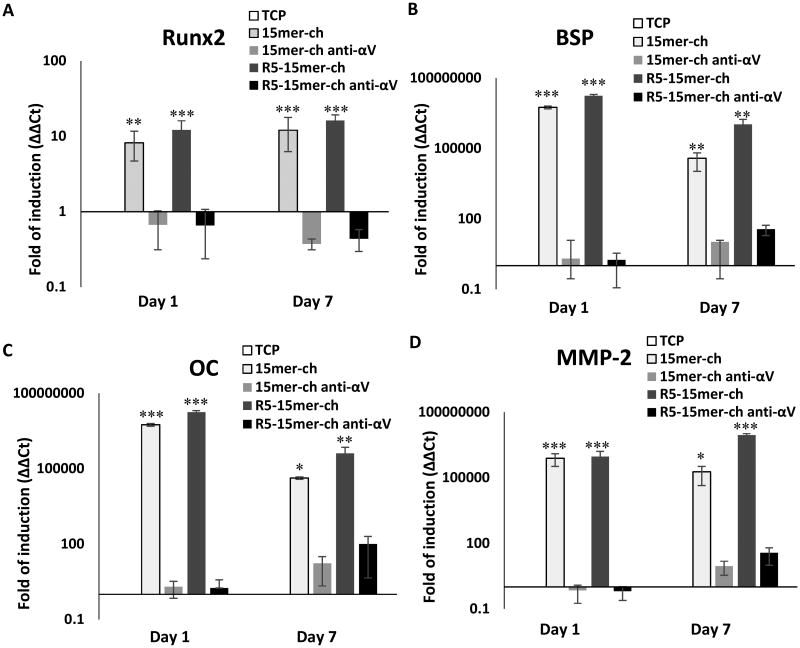
To determine the ability of silk-silica materials to induce osteogenesis, hMSCs were seeded on silicified films and on TCP for 1 and 7 days. First, we observed as for the integrin subunits, that the cells growing on non-silicified films showed no induction or repression of Runx2 transcription factor and osteogenic markers (Figure S3). Meanwhile, at day 1 hMSCs seeded on both 15mer-ch and R5-15mer-ch silicified films, showed an 8- and 12-fold increase in the levels of Runx2 transcription factor (Figure 6A), respectively. All early osteogenic markers Bone Sialoprotein (BSP; Figure 6B), Osteocalcin (OC; Figure 6C) and Matrix Metalloproteinase-2 (MMP-2; Figure 6D), increased by 5 log-fold for both silicified films. This expression pattern was maintained for the 7 days of culture (Figure 6). Interestingly, the induction was slightly higher, on average by 15-20%, in the R5-15mer-ch films compared to the films without R5 (Figure 6). This result can be explained by the fact that the R5 chimera films had significant silica formation and deposition, while the 15mer-ch constructions had a lower silica deposition.[15,16] This allowed us to correlate gene expression to silica content in the film.
Figure 6.
Runx2 transcription factor and osteogenesis markers induced in cells seeded on silk-silica films, while the use of a blocking antibody against integrin αVβ3 abolished the induction. Gene expression of Runx2 transcription factor (A), and bone extracellular matrix proteins Bone Sialoprotein (BSP) (B), osteocalcin (OC) (C) and Matrix Metalloproteinase-2 (MMP-2) (D), was monitored from cells growing on tissue culture plastic (TCP; white bars), 15mer-ch (light gray bars), 15mer-ch in the presence of blocking antibody (15mer-ch anti-αV; dark gray bars), R5-15mer-ch (light black bars), and R5 chimera films in the presence of blocking antibody (R5-15mer-ch anti-αV; black bars) silicified films. Data represents mean ± SD (n=3) *: p<0.05; **: p <0.01; ***: p <0.001.
To further analyze if the induction was mediated via αVβ3 integrin, osteogenic gene expression was monitored after a neutralizing αVβ3 integrin antibody was added to specifically block αVβ3 integrin signaling in hMSCs. Interestingly, in both 15mer-ch and R5-15mer-ch films, the treatment completely abolished the induction previously observed for Runx2 and the bone extracellular matrix proteins (Fig. 6).
Together, these results demonstrate that silica promoted the differentiation of hMSCs into osteoblasts in a silica-dependent manner. This process requires the sensing and binding of αVβ3 integrin to the silica surface. αVβ3 integrin is activated upon binding, triggering a signal that leads to the induction of Runx2 transcription factor which ultimately induces the expression of the bone extracellular matrix proteins for osteogenesis.
2.5. MAPK pathways are involved in the induction of osteogenic gene expression upon activation of αVβ3 integrin
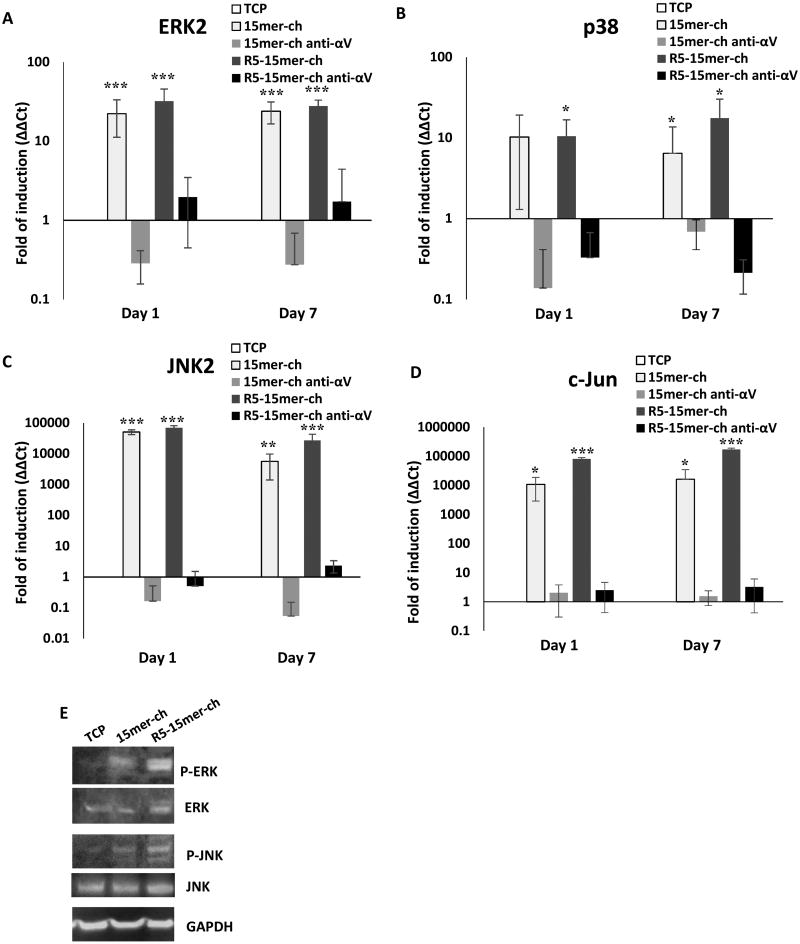
To further verify whether the MAPK pathways (ERK, p38 and JNK) were involved in the cascade that leads to osteogenesis in hMSCs, a component from the three MAPK pathways and the c-Jun component were analyzed. Again, cells seeded on non-silicified films showed no change or even repression in the gene expression level compared to TCP (Figure S4). As observed for the osteogenic markers, hMSCs seeded on both 15mer-ch and R5-15mer-ch silicified films showed higher levels of all 4 genes analyzed, where the expression on average was 12-15% higher in R5-15mer-ch films (Figure 7). Importantly, the induction of the JNK2 gene (Figure 7C) showed a 5 log-fold induction for both films. ERK2, showed a 20- and 30-fold induction, for the 15mer-ch and R5-15mer-ch films, respectively (Figure 7A). The induction for p38 was 10- and 12-fold for 15mer-ch and R5-15mer-ch, respectively (Figure 7B). The induction observed for c-Jun gene was 4 and 5 log-fold higher than TCP for the 15me-ch and R5-15mer-ch films, respectively (Figure 7D). The induction of gene expression was also sustained after 7 days of culture (Figure 7). Additionally, immunoblotting was used to determine that the silicified films induced phosphorylation of ERK and JNK kinases, thus demonstrating the activation of both kinases, after 1 day of culture, with phosphorylation being higher for the R5-15mer-ch films (Figure 7E).
Figure 7.
The three MAPK pathways and c-Jun were induced and activated in cells seeded on silk-silica films. The treatment with a neutralizing αVβ3 antibody abrogates the induction. Gene expression of MAPK ERK2 (A), p38 (B), JNK2 (C) and c-Jun (D), was monitored from cells growing on tissue culture plastic (TCP; white bars), 15mer-ch (light gray bars), 15mer-ch in the presence of blocking antibody (15mer-ch anti-αV; dark gray bars), R5-15mer-ch (light black bars), and R5 chimera films in the presence of blocking antibody (R5-15mer-ch anti-αV; black bars) silicified films. E) Immunoblotting analysis of ERK, and JNK proteins, and its phosphorylated versions P-ERK and P-JNK proteins. GAPDH is used as load control. Data represents mean ± SD (n=3) *: p<0.05; **: p <0.01; ***: p <0.001.
Finally, to further confirm that the induction was mediated via the αVβ3 integrin, a neutralizing antibody against this integrin eliminated the induction of all MAPK components monitored at 1 and 7 days (Figure 7).
These results suggest that all three MAPK pathways were necessary for osteoblast induction by silica surfaces activated by the αVβ3 integrin, ultimately inducing osteogenic genes, as summarized in Figure 8. However, it is important to note that the JNK pathway was the main pathway in this process, as reflected by the different levels of gene expression.
Figure 8.
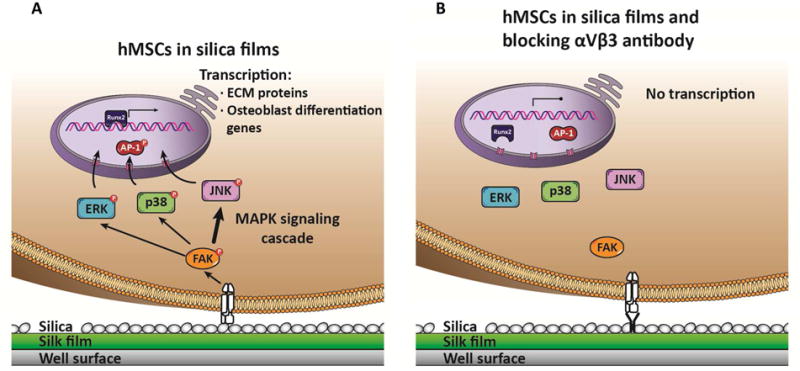
Proposed mechanism for hMSCs osteogenesis induction on silica surfaces. The binding of integrin αVβ3 to the silica surface promotes its activation, that triggers an activation cascade that involves the three MAPK pathways, ERK, p38, but mainly JNK (reflected as wider arrow), which promotes AP-1 activation and translocation to the nucleus to activate Runx2 transcription factor. Runx2 is the finally responsible for the induction of bone extracellular matrix proteins and other osteoblast differentiation genes. In the presence of a neutralizing antibody against αVβ3, there is no activation and induction of MAPK cascades, thus no induction of bone extracellular matrix genes and hence, no differentiation.
This is the first study reporting that silica activates osteogenesis mainly via the JNK cascade. Different inorganic materials including Consil bioactive glass, β-Tricalcium Phosphate (β-TCP), Si/Ca cements or Biphasic Calcium Phosphate ceramics (BCP ceramics), show that ERK and/or p38 MAPK were related to this process.[25,41-43]
3. Conclusions
The present work demonstrates a link between silica-based biomaterials and key intracellular pathways leading to osteogenesis. The results were attained experimentally, and guided by molecular-level modeling; an integrated approach that provides insight into key interactions for control of osteogenesis and efficient biomaterial designs. Based on the results, the proposed mechanism for the induction of osteogenesis in hMSCs starts with the binding of integrin αVβ3 to the silica surface, thus triggering a signal that activates a phosphorylation cascade through the three MAPK pathways, with the JNK MAPK cascade as the main pathway. The last member of the MAPK pathway then activates the transcription factor Runx2, which is responsible for the induction of osteoblast differentiation genes. In the absence of the silica surface (non-silicified) or in the presence of a neutralizing antibody against αVβ3 integrin, there was no activation of the MAPK cascades, thus no induction of bone extracellular matrix genes and therefore no differentiation. An important outcome was the correlation between the amount of silica deposited in the films and the level of induction. This insight is critical for future design optimization of fusion proteins to generate mineralized biomaterials.
4. Experimental Section
Recombinant production of silk and silk-silica fusion proteins
Spider silk fusion proteins used in this study were constructed by assembling spider silk based domains and silica binding peptide R5. The spider silk domain consists of 15 repeating units of (SGRGGLGGQGAGAAAAAGGAGQGGYGGLGSQGT) based on the sequence of the MaSp I protein of N. clavipes. The R5 domain (SSKKSGSYSGSKGSKRRIL) was either fused to the N- or C-terminal domain of the silk sequence, whereas the histidine tag is placed on the opposite terminus. Using these motifs, the following constructs were synthesized: 15mer-ch, nh-15mer, R5-15mer-ch and nh-15mer-R5 (Figure 1A).[15] All genetic constructs were cloned into commercially available pET30a(+) vector (Novagen, San Diego, CA, USA) as described previously.[45] Constructs ware expressed in Escherichia coli strain BL21 Star (DE3) (Invitrogen, Grand Island, NY, USA) and purified as described previously.[45] Briefly, for large-scale expression the recombinant strains were grown overnight at 37°C in Lysogeny Broth (LB) medium. Afterwards, a seeding culture was transferred to yeast extract medium and cultured at 37°C pH 6.8 using a New Brunswick BioFlo 3000 bioreactor (New Brunswick Scientific, Edison, NJ, USA). Gene expression was induced with 1 mM isopropyl-β-D-thiogalactopyranoside (IPTG) (Sigma-Aldrich, St. Louis, MO, USA) when the optical density OD600 reached approximately 0.8.[46] Purification was performed using immobilized metal affinity chromatography following a previously described procedure.[45] The proteins were dialyzed against water using a Slide-A-Lyzer cassettes (Pierce, Rockford, IL, USA) with a molecular weight cut-off of 2,000 Da and the protein solution is then lyophilized. The purity of expressed proteins is verified by sodium dodecyl sulfate polyacrylamide gel electrophoresis (SDS-PAGE) followed by Colloidal Blue staining.
Preparation of silk-chimera films
Lyophilized recombinant silk-silica fusion proteins (nh-15mer, 15mer-ch, nh-15mer-R5, R5-15mer-ch) were dissolved at a concentration of 2% (w/v) in ultrapure water. The proteins were allowed to dissolve overnight at 4°C. For material testing analysis, polydimethylsulfoxide (PDMS) (Sylgard 184 PDMS, Mlsolar, Campbell, CA, USA) disks (R=6 mm) were used as substrates on which 30 μL aliquots of each protein solution was deposited. For cell culture, 400 μL of each protein solution was deposited onto the well of a 6-well plate. Films were air-dried overnight in a fume hood and subsequently subjected to water vapor annealing using an isotemp vacuum oven for 24 h at room temperature,[14,15] to induce formation of β-sheets. Afterwards, films were air-dried overnight at room temperature.
Biosilicification reaction on recombinant fusion protein films
To induce silica precipitation, protein films (nh-15mer, 15mer-ch, nh-15mer-R5, R5-15mer-ch) were treated with pre-hydrolyzed tetraethyl orthosilicate (TEOS) in 100 mM bis-tris propane/citric acid buffer at pH 7.0 according to protocols previously described.[14] Briefly, a total of 4 mL of 30 mM TEOS is added into each well of a 6-well plate to cover the film formed in the well for 1 h at room temperature. The films are then washed once with distilled water and air-dried overnight.
Fourier Transform Infrared Attenuated Total Reflectance Spectroscopy (FTIR-ATR)
Protein conformation was assessed using FTIR-ATR (Frontier, PerkinElmer, Coventry, UK), with an average of 40 scans over the range 1750-1450 cm-1. Thermo Grams A1 software v8.0 was used for curve fitting (including peak deconvolution), including baseline corrections. Eight points were chosen from the amide I band (1700-1580 cm-1); 4 points corresponding to β conformers: 1693, 1680, 1633 and 1615 cm-1, 2 points for non-β conformers at 1656 and 1644 cm-1, and 2 at 1712 and 1592 cm-1 to allow for peak shifting and amide II band overlap respectively. An iteration was carried out forcing all peaks to have a positive area with a linear baseline. This was carried out for 1,000 iterations before curve fitting. The sum of the areas under the peaks was found and each conformer expressed as a percentage of the total.
Wettability and surface energy measurements
The wettability and surface energy of each sample was measured using a Theta Attension Instrument with OneAttention v 1.7 software (Biolin Scientific, Staffordshire, UK). A silk film mounted on a PDMS substrate was placed on the stand, and using a syringe, a 10 μL droplet of water, dimethyl formamide (DMF) or ethylene glycol was placed on the surface and the contact angle at each side of the droplet measured ten times and an average taken. It was not possible to measure contact angles of the non-annealed films with DMF and ethylene glycol as the proteins dissolved in the solvents.[15]
Atomic Force Microscopy
A Bruker Dimension Icon (Banner Lane, Coventry, UK) with ScanAsyst was used to perform all imaging and nanoquantum mapping. Data were collected in PeakForce Tapping mode and processed using Nanoscope Analysis software. Young's modulus values are stated as an average of 20 measurements taken across a 20 μm2 area with an assumed Poisson's ratio of 0.3.[47]
Biodegradability/Solubility assay
Chimeric silk films prepared as above were submerged in 2mL 100mM PBS pH 7.4 at 37°C, degradation was measured at 0, 2, 4, 6, 8 hrs, 1, 2, 3, 4 days, and 1, 2, 3, 4, 5, 6 7 weeks, taking 10 μL aliquots of the PBS supernatant and measuring protein concentration by adding 90 μL Coomassie stock solution (200mg Brilliant blue dye (Sigma-Aldrich, Dorset, UK), 100 mL methanol, 20 mL 85% orthophosphoric acid, 200 mL dd water), then measuring the absorbance ratio at a wavelengths 590nm and 450 nm.[48]
Cell culture and film seeding
Human mesenchymal stem cells (hMSCs) were isolated from fresh bone marrow aspirates (Lonza, Basel, Switzerland), cultured in Dulbecco's Modified Eagle Medium (supplemented with 10% fetal bovine serum, 0.1 mM non-essential amino acids, 1 ng/mL bFGF, 1% antibiotic/antimycotic) and seeded at passage 2, as previously described.[49] For seeding, recombinant silk-silica films were prepared as described above and sterilized in ethylene oxide for 16 h at 4°C,[50] and stored aseptically until seeding. Cells were seeded at a density of 5,000 cells per cm2, and allowed to adhere for 30 min prior to flooding with media. All cell culture was performed in an incubator maintained at 37°C and 5% CO2. The cells were cultured in hMSC medium for 3 h, and then the medium was changed to osteogenic medium StemPro Osteogenesis Differentiation Kit (Gibco, Life Technologies, Grand Island, NY, USA). The medium was changed every 3-4 days. For the blocking antibody treatment, cells were preincubated for 30 min in the presence of 10 μg of αVβ3 blocking antibody (Anti-Integrin αVβ3 antibody [27.1 (VNR-1)], Abcam, Branford, CT, USA) and then seeded on the wells in the presence of the antibody; blocking antibody was also added to the medium in every medium change. Cell growth and shape were monitored using a phase-contrast light microscope (Carl Zeiss, Jena, Germany).
RNA isolation and quantitative reverse transcriptase real-time polymerase chain reaction (qRT-PCR)
Total RNA, DNA and proteins were extracted from 1 and 7 days cultures using SurePrep RNA/DNA/Protein Purification kit (Thermo Scientific, Carlsbad, CA, USA). RNA samples were DNase I-treated according to the manufacturer's instructions (Ambion, Carlsbad, CA, USA). The concentration and purity of the RNA samples were assessed using a NanodropTM 2000 (Thermo Scientific, Carlsbad, CA, USA). Synthesis of total cDNA was performed by using the Transcriptor First Strand cDNA Synthesis kit (Roche, Indianapolis, IN, USA) in 20-μL reactions containing 100 ng of total RNA, 1 μM concentration of each dNTP, 10 units of reverse transcriptase, 20 units of Protector RNase Inhibitor, and 60 μM random hexamers, provided by the manufacturer. The RNA and hexamers were initially heated at 65°C for 10 min and following the addition of the rest of the components, samples were incubated at 25°C for 10 min and then at 55°C for 30 min. Reactions were terminated by incubation at 85°C for 5 min. Real-time PCR assays were performed in Stratagene Mx3000 qPCR system (Agilent, Santa Clara, CA, USA). The cDNA samples were analyzed for gene expression relative to the GAPDH housekeeping gene using LightCycler® 480 SYBR Green I Master (Roche, Indianapolis, IN, USA). PCR amplifications were carried out with one denaturation cycle (95°C for 10 min), followed by 50 cycles of amplification (95°C for 10 s, 60°C for 10 s, and 72°C for 10 s). After amplification, melting curves were generated to confirm amplification of a single product. All primers used to amplify transcripts from target genes, are listed in Table 2. Expression of these genes was compared with control samples cultured on tissue culture plastic (TCP). For each sample, the Ct value was defined as the cycle number at which the amplification of each target gene was in the linear range of the reaction. Relative expression levels for each gene were calculated by normalizing to the Ct value of GAPDH housekeeping gene and to the normalized level of the control sample (2-ΔΔCt).[51] The analysis was performed in two technical replicates from three biological samples.
Table 2.
Primers used for Real-Time quantitative PCR. GAPDH, glyceraldehyde 3-phosphate dehydrogenase; MAPK1, Mitogen-activated protein kinase 1 (ERK2); MAPK9, Mitogen-activated protein kinase 9 (JNK2); MAPK14, Mitogen-activated protein kinase 14 (p38); c-Jun, AP-1 transcription factor OC, osteocalcin; BSP, Bone Sialoprotein; MMP2, Matrix metalloproteinase-2.
| Primer | Sequence (5′-3′) | Tm (°C) |
|---|---|---|
| GAPDH | F- ACCCAGAAGACTGTGGATGG | 60 |
| R- CAGTGAGCTTCCCGTTCAG | ||
| Integrin αV | F- AATCTTCCAATTGAGGATATCAC | 60 |
| R- AAAACAGCCAGTAGCAACAAT | ||
| Integrin β3 | F- CCGTGACGAGATTGAGTCA | 60 |
| R- AGGATGGACTTTCCACTAGAA | ||
| MAPK1 | F- CTGGGTATTCTTGGATCTCC | 60 |
| R- GCCTGTTCAACTTCAATCCT | ||
| MAPK9 | F- ATGGGAGCAGGTGAGACG | 60 |
| R- TGTTTCAGACACGGACTTGG | ||
| MAPK14 | F- GGTTACGTGTGGCAGTGAAG | 60 |
| R- AACGTCCAACAGACCAATCA | ||
| c-Jun | F- GCATGAGGAAACGCATCGCTGCCTCCAAGT | 60 |
| R- GCGACCAAGTCCTTCCCACTCGTGCACACT | ||
| Runx-2 | F- ATGCTTCATTCGCCTCAC | 60 |
| R- ACTGCTTGCAGCCTTAAAT | ||
| OC | F- ATGAGAGCCCTCACACTCCTCG | 60 |
| R- GTCAGCCAACTCGTCACAGTCC | ||
| BSP | F- ATGGCCTGTGCTTTCTCAATG | 60 |
| R- GGATAAAAGTAGGCATGCTTG | ||
| MMP2 | F- AGATCTTCTTCTTCAAGGACCGGTT | 60 |
| R- GGCTGGTCAGTGGCTTGGGGTA |
Immunoblotting
Samples from protein isolation using SurePrep RNA/DNA/Protein Purification kit (Thermo Scientific, Carlsbad, CA, USA) were quantified using the Pierce™ BCA Protein Assay Kit (Thermo Scientific, Carlsbad, CA, USA). Equal amounts of protein lysates were resolved in SDS-PAGE and transferred to PVDF membranes (iBlot transfer stack, Thermo Scientific, Carlsbad, CA, USA) using the iBlot Dry Blotting system (Thermo Fisher Scientific, Carlsbad, CA, USA). The primary antibodies used were anti-GAPDH, anti-integrin αV, anti-integrin α5, anti-ERK2, anti-ERK1(pT202/pY204)+ERK2 (pT185/pY187), anti-JNK2, and anti-JNK1+JNK2+JNK3 (phospho T183+T183+T221) all purchased from Abcam (Branford, CT, USA), at a 1:10000 concentration. These membranes were analyzed using the primary antibodies indicated above and the appropriate peroxidase-conjugated secondary antibodies. Proteins were detected by enhanced chemiluminescence (GE Healthcare, Wauwatosa, WI, USA).
Computational methods
The crystal structures of extracellular portion of integrins αVβ3 and α5β1 were taken from the RCSB protein data bank, with PDB IDs 1L5G and 3VI3, respectively. [28,52] The βA domains of the integrins β3 and β1 contain divalent metal cations, and the metal ion dependent adhesion site (MIDAS) was coordinated with Mg2+ and the other two cation binding sites that are mapped to opposite sides of MIDAS are coordinated with Ca2+. Only the α propeller, β hybrid, and βA domains were simulated. Molecular dynamics simulations were performed using GROMACS version 5.0.1,[53] and the CHARMM force field.[54] The amorphous ionized silica surface (Q3) with 4.7 silanol groups per nm2 and 0.45 siloxide groups per nm2 and its force field parameters were taken from the work of Emami et al.[55] In all cases, three-dimensional periodic boundary conditions were applied. The atomic structures were visualized using Visual Molecular Dynamics (VMD) graphics software.[56] For each simulated system, the procedure starts with replica exchange molecular dynamics (REMD) to create an ensemble of energy minimized models in implicit water (with dielectric coefficient ξ = 80). Implicit solvation calculations are carried out using the generalized Born-formalism and the OBC model for calculating the Born radii.[57] The long-range electrostatic Coulombic interactions are calculated using the reaction field method with a cutoff radius of 10 Å.[58] The same cutoff radius is used for short-range interactions. Each replica is simulated for 10 ns with integration time step of 1 fs. The distribution of temperatures covering 3000 k to 500 k are determined by using temperature generator for REMD simulation proposed by Patriksson and van der Spoel.[59] The exchange attempts are made every 5 ps. All the REMD simulations are performed in the canonical (NVT) ensemble using the Nose-Hoover thermostat for the system.[60,61] The simulation trajectories are saved every 5 ps for subsequent analyses. For each case, the last 2.5 ns ensembles (from 7.5 to 10 ns) are analyzed from the lowest temperature replica (i.e., 300 K) to select the most probable representative structure. The single linkage clustering algorithm based on root-mean-square deviations (RMSDs) with 1 Å cutoff is used to cluster conformations. In this algorithm two samples belong to the same cluster if their minimum distance is less than the cutoff value. For each case, the structure with the smallest average distance from the other structures in the most populated cluster is chosen as the representative structure for the next step. The representative structure is solvated in explicit SPC water molecules. Each system is energy-minimized using steepest descent algorithm and a 50 ps NVT simulation followed by another 50 ps NPT simulation to prepare the system for a longer NPT simulation of 20 ns. All the simulations are performed at pressure of 1 atm and temperature of 300 K. In all explicit solvent simulations, the equations of motions are integrated with an integration time step of 1 fs. The long-range electrostatic Coulombic interactions are calculated using particle mesh ewald summation.[62] The Nose-Hoover thermostat and Parrinello-Rahman barostat,[63] are used to control temperature and pressure in the system. The properties of the systems are reported by averaging over the last 5 ns trajectories of the simulations. There are two more steps for the simulation of silk-chimera protein and αVβ3 integrin. The initial structure of the silk-chimera for R5-silk-ch was prepared using three parallel chains with reverse orientation and folded in REMD simulation. Moreover, the most probable interaction state of the αVβ3 integrin with silk-chimera protein was selected using ClusPro algorithm,[64] for protein-protein docking and then the system was solvated in explicit water for further refinement of the structures.
Statistical analysis
Statistical analyses were performed by analysis of variance (ANOVA) to determine significant differences between means. The Student–Newman–Keuls (SNK) test was used to assess significant differences between constructions. All data was analyzed using SigmaPlot software. Statistical significance was evaluated at P<0.001 (***), P<0.01 (**) and P<0.05 (*).
Supplementary Material
Figure S1. IR spectra with peak fitting applied for the R5-15mer-ch chimeric film sample A) Preannealed B) Annealed C) Silicified. Coloured peaks respond to β sheet (red), β turn (purple), random coil (blue) and α helix (green).
Figure S2. Key amino acids in the interaction of αVβ3 integrin with silicified surface were identified, their mutation results in no activation of αVβ3 integrin. A) Molecular simulation of interaction of αVβ3 integrin showing key amino acids (Thr136 and Thr182 in β subunit and Met118 in α subunit). B-C) Activation of mutated αVβ3 integrin measured as head piece opening. Key amino acids were mutated to Ala. Green: Hybrid domain of the β leg; Blue: βA domain of the β leg; Red: propeller domain of α leg.
Figure S3. Runx2 transcription factor and osteogenesis markers are not induced, or even repressed, in cells seeded on non-silicified films. Gene expression of Runx2 transcription factor, and bone extracellular matrix proteins Bone Sialoprotein (BSP), osteocalcin (OC) and Matrix Metalloproteinase-2 (MMP-2), was monitored from cells growing on tissue culture plastic (TCP; white bars), control 15mer-ch (gray bars), and R5-15mer-ch (black bars) non-silicified films for 1 and 7 days. Data represents mean ± SD (n=3).
Figure S4. The three MAPK pathways and c-Jun are not induced, or even repressed, in cells seeded on non-silicified films. Gene expression of Gene expression of MAPK ERK2, p38, JNK2 and c-Jun, was monitored from cells growing on tissue culture plastic (TCP; white bars), control 15mer-ch (gray bars), and R5-15mer-ch (black bars) non-silicified films for 1 and 7 days. Data represents mean ± SD (n=3).
Table S1. Parameter values of the fitted function for different simulations.
Acknowledgments
We acknowledge the NIH (U01EB014976, R01DE017207, R01AR068048, R01DE016525) for support of this work. The computational resources used for this project were provided by the National Science Foundation through the Extreme Science and Engineering Discovery Environment (XSEDE) and the Texas Advanced Computing Center under Grant Numbers TG-DMR140101 and TG-MSS090007.
Footnotes
Supporting Information: Supporting Information is available from the Wiley Online Library or from the author.
Contributor Information
Dr. Zaira Martín-Moldes, Department of Biomedical Engineering, Tufts University, Medford, MA, 02155, USA
Dr. Davoud Ebrahimi, Department of Civil and Environmental Engineering, Massachusetts Institute of Technology, Cambridge, MA, 02139, USA
Robyn Plowright, Biomolecular and Materials Interface Research Group, Interdisciplinary Biomedical Research Centre, School of Science and Technology, Nottingham Trent University, Clifton Lane, Nottingham NG11 8NS, UK.
Dr. Nina Dinjaski, Department of Biomedical Engineering, Tufts University, Medford, MA, 02155, USA; Department of Civil and Environmental Engineering, Massachusetts Institute of Technology, Cambridge, MA, 02139, USA
Prof. Carole C. Perry, Biomolecular and Materials Interface Research Group, Interdisciplinary Biomedical Research Centre, School of Science and Technology, Nottingham Trent University, Clifton Lane, Nottingham NG11 8NS, UK
Prof. Markus J. Buehler, Department of Civil and Environmental Engineering, Massachusetts Institute of Technology, Cambridge, MA, 02139, USA
Prof. David L. Kaplan, Department of Biomedical Engineering, Tufts University, Medford, MA, 02155, USA
References
- 1.Bryksin AV, Brown AC, Baksh MM, Finn MG, Barker TH. Acta Biomater. 2014;10(4):1761. doi: 10.1016/j.actbio.2014.01.019. [DOI] [PMC free article] [PubMed] [Google Scholar]
- 2.Hardy JG, Scheibel TR. Biochem Soc Trans. 2009;37(4):677. doi: 10.1042/BST0370677. [DOI] [PubMed] [Google Scholar]
- 3.Fu C, Shao Z, Fritz V. Chem Commun. 2009;43:6515. doi: 10.1039/b911049f. [DOI] [PubMed] [Google Scholar]
- 4.Mobini S, Solati-Hashjin M, Peirovi H, Abu Osman NA, Gholipourmalekabadi M, Barati M, Samadikuchaksaraei A. J Med Biol Eng. 2013;33:207. [Google Scholar]
- 5.Spiess K, Lammel A, Scheibel T. Macromol Biosci. 2010;10:998. doi: 10.1002/mabi.201000071. [DOI] [PubMed] [Google Scholar]
- 6.Tokareva OS, Lin S, Jacobsen MM, Huang W, Rizzo D, Li D, Simon M, Staii C, Cebe P, Wong JY, Buehler MJ, Kaplan DL. J Struct Biol. 2014;186(3):412. doi: 10.1016/j.jsb.2014.03.004. [DOI] [PMC free article] [PubMed] [Google Scholar]
- 7.Ebrahimi D, Tokareva O, Rim NG, Wong JY, Kaplan DL, Buehler MJ. ACS Biomater Sci Eng. 2015;1(10):864. doi: 10.1021/acsbiomaterials.5b00152. [DOI] [PMC free article] [PubMed] [Google Scholar]
- 8.Wong Po Foo C, Patwardhan SV, Belton DJ, Kitchel B, Anastasiades D, Huang J, Naik RR, Perry CC, Kaplan DL. Proc Natl Acad Sci U S A. 2006;103(25):9428. doi: 10.1073/pnas.0601096103. [DOI] [PMC free article] [PubMed] [Google Scholar]
- 9.Gomes SC, Leonor IB, Mano JF, Reis RL, Kaplan DL. Biomaterials. 2011;32:4255. doi: 10.1016/j.biomaterials.2011.02.040. [DOI] [PMC free article] [PubMed] [Google Scholar]
- 10.Numata K, Subramanian B, Currie HA, Kaplan DL. Biomaterials. 2009;30:5775. doi: 10.1016/j.biomaterials.2009.06.028. [DOI] [PMC free article] [PubMed] [Google Scholar]
- 11.An B, Tang-Schomer MD, Huang W, He J, Jones JA, Lewis RV, Kaplan DL. Biomaterials. 2015;48:137. doi: 10.1016/j.biomaterials.2015.01.044. [DOI] [PMC free article] [PubMed] [Google Scholar]
- 12.Canabady-Rochelle LLS, Belton DJ, Deschaume O, Currie HA, Kaplan DL, Perry CC. Biomacromolecules. 2012;13:683. doi: 10.1021/bm201555c. [DOI] [PMC free article] [PubMed] [Google Scholar]
- 13.Belton DJ, Mieszawska AJ, Currie HA, Kaplan DL, Perry CC. Langmuir. 2012;28:4373. doi: 10.1021/la205084z. [DOI] [PMC free article] [PubMed] [Google Scholar]
- 14.Zhou S, Huang W, Belton DJ, Simmons LO, Perry CC, Wang W, Kaplan DL. Acta Biomater. 2015;15:173. doi: 10.1016/j.actbio.2014.10.040. [DOI] [PMC free article] [PubMed] [Google Scholar]
- 15.Plowright R, Dinjaski N, Zhou S, Belton DJ, Kaplan DL, Perry CC. RSC Adv. 2016;6(26):21776. doi: 10.1039/C6RA03706B. [DOI] [PMC free article] [PubMed] [Google Scholar]
- 16.Dinjaski N, Ebrahimi D, Ling S, Shah S, Buehler MJ, Kaplan DL. ACS Biomater Sci Eng. 2016 doi: 10.1021/acsbiomaterials.6b00236. [DOI] [PubMed] [Google Scholar]
- 17.Knecht MR, Wright DW. Chem Commun. 2003;24:3038. doi: 10.1039/b309074d. [DOI] [PubMed] [Google Scholar]
- 18.Humphries MJ. Biochem Soc Trans. 2000;28:311. [PubMed] [Google Scholar]
- 19.Docheva D, Popov C, Mutschler W, Schieker M. J Cell Mol Med. 2007;11(1):21. doi: 10.1111/j.1582-4934.2007.00001.x. [DOI] [PMC free article] [PubMed] [Google Scholar]
- 20.Xiong JP, Mahalingham B, Alonso JL, Borrelli LA, Rui X, Anand S, Hyman BT, Rysiok T, Muller-Pompalla D, Goodman SL, Arnaout MA. J Cell Biol. 2009;186:589. doi: 10.1083/jcb.200905085. [DOI] [PMC free article] [PubMed] [Google Scholar]
- 21.Dong XC, Mi LZ, Zhu JH, Wang W, Hu P, Luo BH, Springer TA. Biochemistry. 2012;51:8814. doi: 10.1021/bi300734n. [DOI] [PMC free article] [PubMed] [Google Scholar]
- 22.Silva R, D'Amico G, Hodivala-Dilke KM, Reynolds LE. Arterioscler Thromb Vasc Biol. 2008;28:1703. doi: 10.1161/ATVBAHA.108.172015. [DOI] [PubMed] [Google Scholar]
- 23.Avraamides CJ, Garmy-Susini B, Varner J. Nat Rev Cancer. 2008;8:604. doi: 10.1038/nrc2353. [DOI] [PMC free article] [PubMed] [Google Scholar]
- 24.Smith-Garvin JE, Koretzky GA, Jordan MS. Ann Rev Immunol. 2009;27:591. doi: 10.1146/annurev.immunol.021908.132706. [DOI] [PMC free article] [PubMed] [Google Scholar]
- 25.Au AY, Au RY, Demko JL, McLaughlin RM, Eves BE, Frondoza CG. J Biomed Mater Res A. 2010;94(2):380. doi: 10.1002/jbm.a.32668. [DOI] [PubMed] [Google Scholar]
- 26.Mas-Moruno C, Fraioli R, Rechenmacher F, Neubauer S, Kapp TG, Kessler H. Angew Chem Int Ed. 2016;55:7048. doi: 10.1002/anie.201509782. [DOI] [PubMed] [Google Scholar]
- 27.Xiong JP, Stehle T, Diefenbach B, Zhang R, Dunker R, Scott DL, Joachimiak A, Goodman SL, Arnaout MA. Science. 2001;294:339. doi: 10.1126/science.1064535. [DOI] [PMC free article] [PubMed] [Google Scholar]
- 28.Xiong JP, Stehle T, Zhang R, Joachimiak A, Frech M, Goodman SL, Arnaout MA. Science. 2002;296(5565):151. doi: 10.1126/science.1069040. [DOI] [PubMed] [Google Scholar]
- 29.Takagi J, Petre BM, Walz T, Springer TA. Cell. 2002;110:599. doi: 10.1016/s0092-8674(02)00935-2. [DOI] [PubMed] [Google Scholar]
- 30.Paradise RK, Lauffenburger DA, Van Vliet KJ. PloS one. 2011;6(1):e15746. doi: 10.1371/journal.pone.0015746. [DOI] [PMC free article] [PubMed] [Google Scholar]
- 31.Plow E, Haas T, Zhang L, Loftus J, Smith J. J Biol Chem. 2000;275:21785. doi: 10.1074/jbc.R000003200. [DOI] [PubMed] [Google Scholar]
- 32.Coppolino M, Dedhar S. Int J Biochem Cell Biol. 2000;32:171. doi: 10.1016/s1357-2725(99)00043-6. [DOI] [PubMed] [Google Scholar]
- 33.Schneider GB, Zaharias R, Stanford C. J Dent Res. 2001;80:1540. doi: 10.1177/00220345010800061201. [DOI] [PubMed] [Google Scholar]
- 34.Clover J, Dodds RA, Gowen M. J Cell Sci. 1992;103:267. doi: 10.1242/jcs.103.1.267. [DOI] [PubMed] [Google Scholar]
- 35.Cowles EA, Brailey LL, Gronowicz GA. J Biomed Mater Res A. 2000;52:725. doi: 10.1002/1097-4636(20001215)52:4<725::aid-jbm18>3.0.co;2-o. [DOI] [PubMed] [Google Scholar]
- 36.Seger R, Krebs EG. FASEB. 1995;9:726. [PubMed] [Google Scholar]
- 37.Hipskind RA, Bilbe G. Front Biosci. 1998;3:d804. doi: 10.2741/a323. [DOI] [PubMed] [Google Scholar]
- 38.Ge C, Xiao G, Jiang D, Francesch RT. J Cell Biol. 2007;176:709. doi: 10.1083/jcb.200610046. [DOI] [PMC free article] [PubMed] [Google Scholar]
- 39.Salasznyk RM, Klees RF, Williams WA, Boskey A, Plopper GE. Exp Cell Res. 2007;3:1322. doi: 10.1016/j.yexcr.2006.09.013. [DOI] [PMC free article] [PubMed] [Google Scholar]
- 40.Jaiswal RK, Jaiswal N, Bruder SP, Mbalaviele G, Marshak DR, Pittenger MF. J Biol Chem. 2000;275:9645. doi: 10.1074/jbc.275.13.9645. [DOI] [PubMed] [Google Scholar]
- 41.Lu Z, Zreiqat H. Biochem Biophys Res Commun. 2010;394(2):323. doi: 10.1016/j.bbrc.2010.02.178. [DOI] [PubMed] [Google Scholar]
- 42.Shie MY, Ding SJ. Biomaterials. 2013;34(28):6589. doi: 10.1016/j.biomaterials.2013.05.075. [DOI] [PubMed] [Google Scholar]
- 43.Chen X, Wang J, Chen Y, Cai H, Yang X, Zhu X, Fan Y, Zhang X. J Mater Chem B. 2016;4:2280. doi: 10.1039/c6tb00349d. [DOI] [PubMed] [Google Scholar]
- 44.Belton DJ, Plowright R, Kaplan DL, Perry CC. Biomacromolecules. in preparation. [Google Scholar]
- 45.Rabotyagova OS, Cebe P, Kaplan DL. Microb Biotechnol. 2009;6:22. [Google Scholar]
- 46.Teulé F, Cooper AR, Furin WA, Bittencourt D, Rech EL, Brooks A, Lewis RV. Nat Protoc. 2009;4:341. doi: 10.1038/nprot.2008.250. [DOI] [PMC free article] [PubMed] [Google Scholar]
- 47.Derjaguin BV, Muller VM, Toporov YP. Progress in surface science. 1994;45:131. [Google Scholar]
- 48.Noble JE, Bailey MJA. In: Guide to Protein Purification. 2nd. Burgess RR, Deutscher MP, editors. Ch 11 Academic Press; San Diego, USA: 2009. [Google Scholar]
- 49.Altman GH, Horan RL, Lu HH, Moreau J, Martin I, Richmond JC, Kaplan DL. Biomaterials. 2002;23:4131. doi: 10.1016/s0142-9612(02)00156-4. [DOI] [PubMed] [Google Scholar]
- 50.Mauney JR, Blumberg J, Pirun M, Volloch V, Vunjak-Novakovic G, Kaplan DL. Tissue Eng. 2004;10:81. doi: 10.1089/107632704322791727. [DOI] [PubMed] [Google Scholar]
- 51.Livak KJ, Schmittgen TD. Methods. 2001;25(4):402. doi: 10.1006/meth.2001.1262. [DOI] [PubMed] [Google Scholar]
- 52.Nagae M, Re S, Mihara E, Nogi T, Sugita Y, Takagi J. J Cell Biol. 2012;197(1):131. doi: 10.1083/jcb.201111077. [DOI] [PMC free article] [PubMed] [Google Scholar]
- 53.Abraham MJ, Murtola T, Schulz R, Páll S, Smith JC, Hess B, Lindahl E. SoftwareX. 2015;1:19. [Google Scholar]
- 54.MacKerell AD, Bashford D, Bellott M, Dunbrack RL, Evanseck JD, Field MJ, Fischer S, Gao J, Guo H, Ha S, Joseph-McCarthy D, Kuchnir L, Kuczera K, Lau FT, Mattos C, Michnick S, Ngo T, Nguyen DT, Prodhom B, Reiher WE, Roux B, Schlenkrich M, Smith JC, Stote R, Straub J, Watanabe M, Wiórkiewicz-Kuczera J, Yin D, Karplus M. J Phys Chem B. 1998;102(18):3586. doi: 10.1021/jp973084f. [DOI] [PubMed] [Google Scholar]
- 55.Emami FS, Puddu V, Berry RJ, Varshney V, Patwardhan SV, Perry CC, Heinz H. Chem Mater. 2014;26(8):2647. [Google Scholar]
- 56.Humphrey W, Dalke A, Schulten K. J Mol Graph. 1996;14(1):33. doi: 10.1016/0263-7855(96)00018-5. [DOI] [PubMed] [Google Scholar]
- 57.Onufriev A, Bashford D, Case DA. Proteins. 2004;55(2):383. doi: 10.1002/prot.20033. [DOI] [PubMed] [Google Scholar]
- 58.Tironi IG, Sperb R, Smith PE, Van Gunsteren WF. J Chem Phys. 1995;102(13):5451. [Google Scholar]
- 59.Patriksson A, van der Spoel DA. Phys Chem Chem Phys. 2008;10(15):2073. doi: 10.1039/b716554d. [DOI] [PubMed] [Google Scholar]
- 60.Nose S. J Chem Phys. 1984;81(1):511. [Google Scholar]
- 61.Hoover W. Phys Rev A: At, Mol, Opt Phys. 1985;31(3):1695. doi: 10.1103/physreva.31.1695. [DOI] [PubMed] [Google Scholar]
- 62.Essmann U, Perera L, Berkowitz ML, Darden T, Lee H, Pedersen LG. J Chem Phys. 1995;10(19):8577. [Google Scholar]
- 63.Parrinello M. J Appl Phys. 1981;52(12):7182. [Google Scholar]
- 64.Kozakov D, Hall DR, Xia B, Porter KA, Padhorny D, Yueh C, Beglov D, Vajda S. Nature Protocols. 2017;12(2):255. doi: 10.1038/nprot.2016.169. [DOI] [PMC free article] [PubMed] [Google Scholar]
Associated Data
This section collects any data citations, data availability statements, or supplementary materials included in this article.
Supplementary Materials
Figure S1. IR spectra with peak fitting applied for the R5-15mer-ch chimeric film sample A) Preannealed B) Annealed C) Silicified. Coloured peaks respond to β sheet (red), β turn (purple), random coil (blue) and α helix (green).
Figure S2. Key amino acids in the interaction of αVβ3 integrin with silicified surface were identified, their mutation results in no activation of αVβ3 integrin. A) Molecular simulation of interaction of αVβ3 integrin showing key amino acids (Thr136 and Thr182 in β subunit and Met118 in α subunit). B-C) Activation of mutated αVβ3 integrin measured as head piece opening. Key amino acids were mutated to Ala. Green: Hybrid domain of the β leg; Blue: βA domain of the β leg; Red: propeller domain of α leg.
Figure S3. Runx2 transcription factor and osteogenesis markers are not induced, or even repressed, in cells seeded on non-silicified films. Gene expression of Runx2 transcription factor, and bone extracellular matrix proteins Bone Sialoprotein (BSP), osteocalcin (OC) and Matrix Metalloproteinase-2 (MMP-2), was monitored from cells growing on tissue culture plastic (TCP; white bars), control 15mer-ch (gray bars), and R5-15mer-ch (black bars) non-silicified films for 1 and 7 days. Data represents mean ± SD (n=3).
Figure S4. The three MAPK pathways and c-Jun are not induced, or even repressed, in cells seeded on non-silicified films. Gene expression of Gene expression of MAPK ERK2, p38, JNK2 and c-Jun, was monitored from cells growing on tissue culture plastic (TCP; white bars), control 15mer-ch (gray bars), and R5-15mer-ch (black bars) non-silicified films for 1 and 7 days. Data represents mean ± SD (n=3).
Table S1. Parameter values of the fitted function for different simulations.


