. 2018 Aug 10;7:e35786. doi: 10.7554/eLife.35786

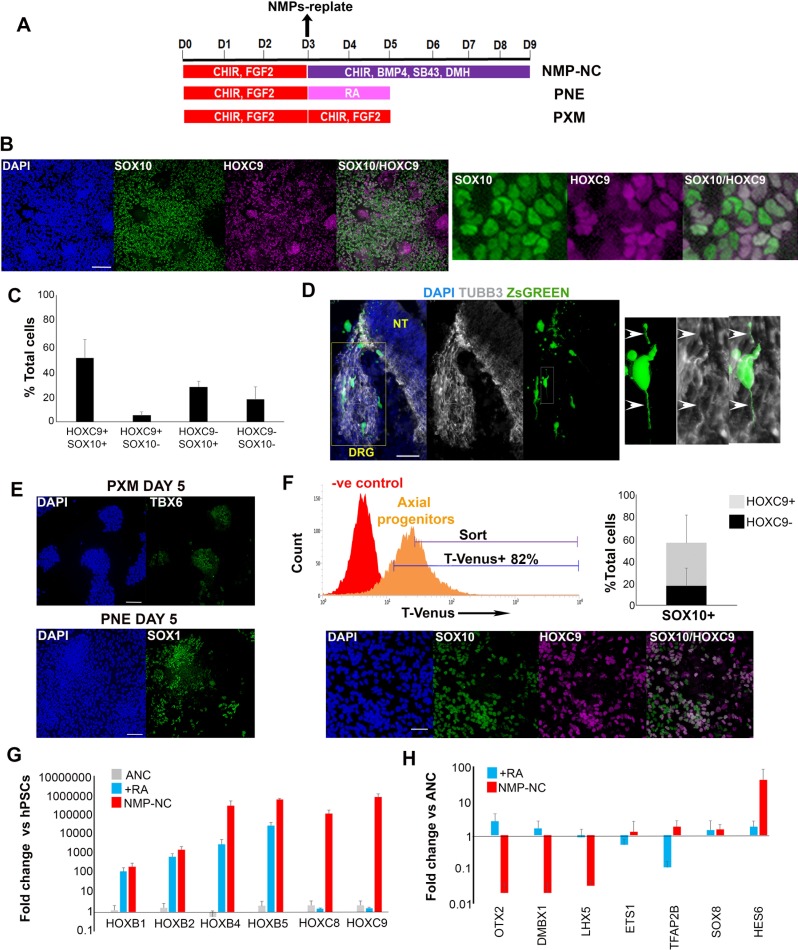
Figure 3. In vitro-derived axial progenitors generate trunk neural crest efficiently.

(A) Diagram depicting the culture conditions employed to direct trunk NC, posterior neurectoderm (PNE) and paraxial mesoderm (PXM) differentiation from hPSC-derived axial progenitors. (B) Immunofluorescence analysis of the expression of the definitive NC marker SOX10 and the thoracic/trunk marker HOXC9 in trunk NC cells derived from axial progenitors after 8 days of differentiation (NMP-NC, see Figure 3A). A magnified region corresponding to the inset is also shown. Scale bar = 100 µm. (C) Quantification of cells marked by different combinations of HOXC9 and SOX10 expression in day eight trunk NC cultures derived from axial progenitors following image analysis. The data in the graph were obtained after scoring three random fields per experiment (two independent replicates) that is a total of 6 fields for two experiments and the error bars/standard deviation represent the variation across all 6 fields and two experiments. Total number of cells scored = 5366, average number of cells/field = 894, error bars = s.d. (D) Immunofluorescence analysis of ZsGREEN and TUBB3 expression in a section of a chick embryo grafted with ZsGREEN+ human axial progenitor-derived trunk NC cells. The DRG region is marked by a yellow box. The images on the right are magnifications of the region marked by the white inset within the DRG region. Arrowheads mark co-localisation of the ZsGREEN and TUBB3 proteins in a donor cell derived, DRG-localised neurite. V, ventral neural tube. Scale bar = 100 µm. (E) Immunofluorescence analysis of TBX6 (left) or SOX1 (right) expression in axial progenitors treated with CHIR-FGF2 (pro-PXM conditions) and RA (pro-PNE conditions) respectively. Scale bar = 100 µm. (F) Top left: Representative FACS histogram indicating the gated T-VENUS +hPSC derived axial progenitors as well as its flow-sorted fraction (‘sort’) which was subsequently plated in NC-inducing conditions. Top right: Average percentage of SOX10+ cells (in relation to HOXC9 expression) following 5 day differentiation of sorted T-VENUS+ axial progenitors in NC-inducing conditions, immunostaining and image analysis. The data in the graph were obtained after scoring 8–10 random fields per experiment (N = 5). The error bars/standard deviation represent the variation across all fields and five experiments. Error bars = s.d. Bottom: A representative field depicting immunofluorescence analysis of SOX10 and HOXC9 expression in NC cells derived from sorted T-VENUS+ axial progenitors. Scale bar = 100 µm. (G) qPCR expression analysis of indicated HOX genes in hPSC-derived anterior cranial (ANC), retinoic acid (RA)-treated NC (+RA), and axial progenitor-derived NC cells (NMP-NC) relative to hPSCs. Error bars = S.E.M. (n = 3). (H) qPCR expression analysis of indicated NC markers in +RA and axial progenitor-derived NC cells relative to untreated anterior cranial NC cells. Error bars = S.E.M. (n = 3).

Figure 3—source data 1. Raw data for Figure 3.
DOI: 10.7554/eLife.35786.015

Figure 3.

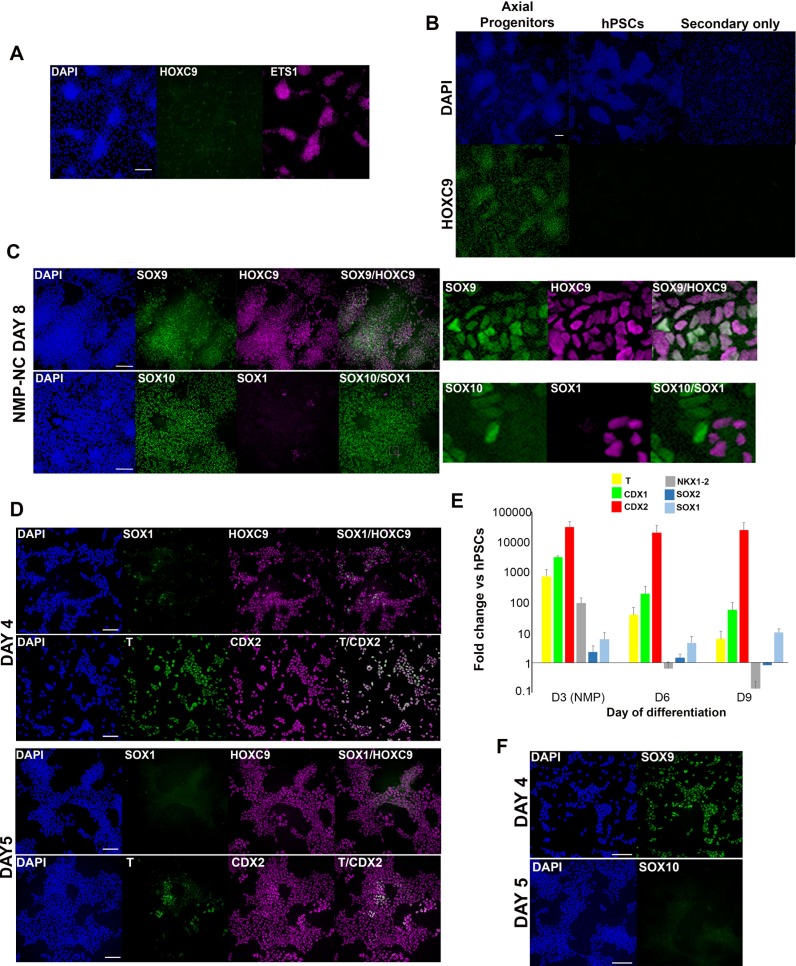
Figure 3—figure supplement 1. Dynamics of trunk neural crest differentiation from axial progenitors.

Figure 3—figure supplement 1.

(A) Immunofluorescence analysis of HOXC9 and ETS1 expression in cranial NC cells generated from hPSCs as described in (Hackland et al., 2017). Scale bar = 100 µm. (B) Immunofluorescence analysis of HOXC9 expression in day 3 hPSC-derived axial progenitors (=positive control, see Figure 1C, Figure 1—figure supplement 1), undifferentiated hPSCs and differentiated hPSCs incubated only with the corresponding secondary antibody. Scale bar = 100 µm. (C) Immunofluorescence analysis of the expression of the NC markers SOX10/SOX9, neural marker SOX1 and the thoracic/trunk marker HOXC9 in trunk NC cells derived from axial progenitors after 8 days of differentiation. Magnified regions corresponding to the insets are also shown. Note that the SOX10/SOX1 image set and the HOXC9/SOX10 set in Figure 3B correspond to the same cells. Scale bar = 100 µm. (D) Immunofluorescence analysis of indicated markers one (day 4 of differentiation) or two (day 5 of differentiation) days after re-plating axial progenitors into NC inducing conditions. Scale bar = 100 µm. (E) qPCR expression analysis of indicated axial progenitor (NMP) and neural markers during differentiation toward TNC. Error bars = s.e.m. (n = 3) (F) Immunofluorescence analysis of indicated NC markers one (day 4 of differentiation) or two (day 5 of differentiation) days after re-plating axial progenitors into NC inducing conditions. Scale bar = 100 µm.
Figure 3—figure supplement 1—source data 1. Raw data for Figure 3—figure supplement 1.
DOI: 10.7554/eLife.35786.010
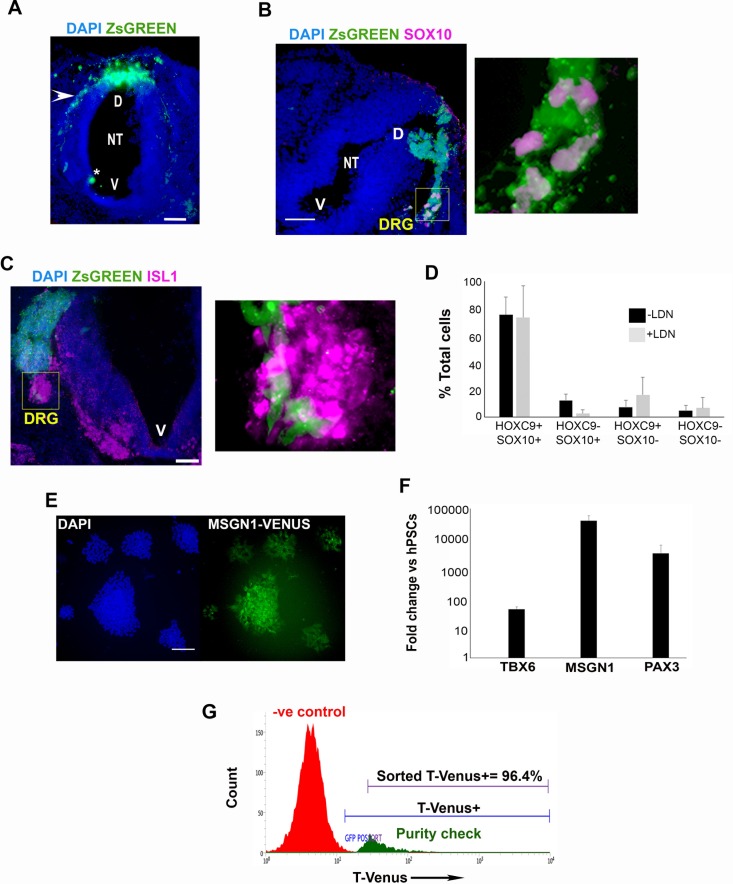
Figure 3—figure supplement 2. Characterisation of hPSC- derived axial progenitor differentiation products.

Figure 3—figure supplement 2.

(A) Representative section of a chick embryo grafted with ZsGREEN+ human axial progenitor-derived trunk NC cells. The arrowhead indicates a migratory stream of donor human trunk NC cells emerging from the graft site on the dorsal neural tube. Nuclei were counterstained with DAPI. The asterisk marks debris. NT, neural tube; D, dorsal; V, ventral. (B) Immunofluorescence analysis of ZsGREEN and SOX10 expression in a section of a chick embryo grafted with ZsGREEN+ human axial progenitor-derived trunk NC cells. The image on the right is a magnification of the DRG region marked by the box. Note that the anti-SOX10 antibody used detects specifically the human SOX10 protein. V, ventral neural tube. Scale bar = 100 µm. (C) Immunofluorescence analysis of ZsGREEN and ISL1 expression in a section of a chick embryo grafted with ZsGREEN+ human axial progenitor-derived trunk NC cells. The image on the right is a magnification of the DRG region marked by the box. V, ventral neural tube. Scale bar = 100 µm. (D) Quantification of cells marked by different combinations of HOXC9 and SOX10 expression in day eight trunk NC cultures derived from axial progenitors cultured in the presence or absence of LDN during their induction from hPSCs. The data in the graph were obtained after scoring 8–10 random fields per experiment (three independent replicates). The error bars/standard deviation represent the variation across all fields and three experiments. Error bars = s.d. (E) Immunofluorescence analysis of MSGN1-VENUS expression in human axial progenitor-derived PXM cells. Scale bar = 100 µm. (F) qPCR expression analysis of indicated paraxial mesoderm (PXM) markers following differentiation of human axial progenitors toward PXM as indicated in Figure 3A. Error bars = s.d. (n = 2). (G) Representative purity check of sorted T-VENUS+ axial progenitors.
Figure 3—figure supplement 2—source data 1. Raw data for Figure 3—figure supplement 2.
DOI: 10.7554/eLife.35786.012
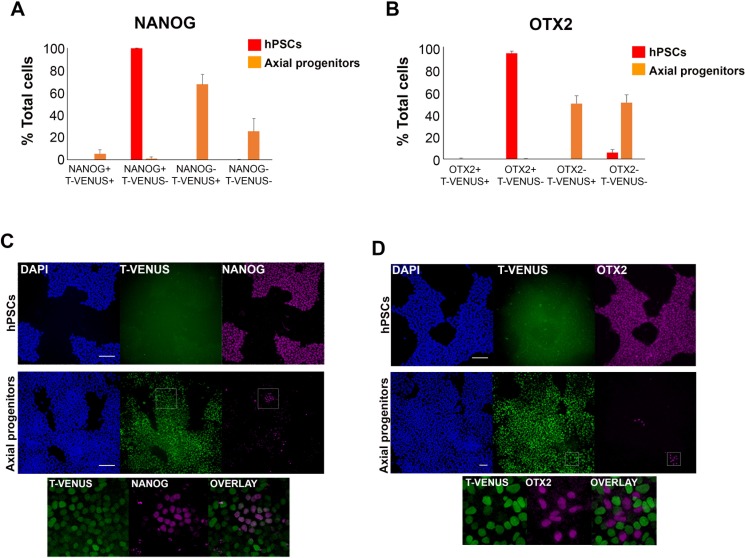
Figure 3—figure supplement 3. Quantification of pluripotency marker expression in hPSC-derived axial progenitors.

Figure 3—figure supplement 3.

Quantification of cells marked by different combinations of NANOG(A) or OTX2 (B) and T-VENUS expression in undifferentiated hPSCs and axial progenitors. The data in the graph were obtained after scoring 8–10 random fields per experiment (three independent replicates). The error bars/standard deviation represent the variation across all fields and three experiments. Error bars = s.d. (C-D) Images showing rare NANOG+ (C) and OTX2+ (D) cells present in axial progenitor cultures expressing low levels or no T-VENUS respectively. Magnified regions corresponding to the insets are also shown. Scale bar = 100 µm.
Figure 3—figure supplement 3—source data 1. Raw data for Figure 3—figure supplement 3.
DOI: 10.7554/eLife.35786.014