Abstract
Ancient cartilaginous vertebrates, such as sharks, skates, and rays, possess specialized electrosensory organs that detect weak electric fields and relay this information to the central nervous system1–4. Sharks exploit this sensory modality for predation, whereas skates may also use it to detect signals from conspecifics5. Here we analyze shark and skate electrosensory cells to ask if discrete physiological properties could contribute to behaviorally-relevant sensory tuning. We show that sharks and skates use a similar low threshold voltage-gated calcium channel to initiate cellular activity but employ distinct potassium channels to modulate this activity. Electrosensory cells from sharks express specially adapted voltage-gated potassium channels that support large, repetitive membrane voltage spikes capable of driving near-maximal vesicular release from elaborate ribbon synapses. In contrast, skates use a calcium-activated potassium channel to produce small, tunable membrane voltage oscillations that elicit stimulus-dependent vesicular release. We propose that these sensory adaptations support amplified indiscriminate signal detection in sharks versus selective frequency detection in skates, potentially reflecting the electroreceptive requirements of these elasmobranch species. Our findings demonstrate how sensory systems adapt to suit an animal’s lifestyle or environmental niche through discrete molecular and biophysical modifications.
Electrosensory cells from little skate (Leucoraja erinacea) express specialized low threshold CaV1.3 voltage-gated calcium (Ca2+) channels and big-conductance potassium (K+, BK) channels that functionally couple to produce cellular membrane voltage oscillations6,7. In electrosensory cells from the catshark (Scyliorhinus retifer, Fig. 1a), we similarly observed voltage-activated inward calcium currents (ICaV) that were sensitive to L-type voltage-gated Ca2+ channel (CaV) modulators, had a low voltage threshold for activation, steep voltage-dependence, and a slow inactivation profile that contributed to a large window current across physiological membrane voltages (Extended Data Fig. 1a–d, f). As with skates, the pore-forming alpha subunit of CaV1.3 was the predominant CaV channel subtype expressed in shark electrosensory (ampullary) organs (Extended Data Fig. 1e). Furthermore, both skate and shark orthologues contain a charged motif within the S2–S3 region of the IV repeat domain that confers low voltage threshold to skate CaV1.3 (Extended Data Fig. 1g)6. Shark ampullary organs also expressed several CaV auxiliary subunits and exhibited similar ICaV current density and activation threshold compared with skate electrosensory cells (Extended Data Fig. 1h, i). Thus, our results suggest that CaV1.3 mediates the major depolarizing current in both skate and shark electrosensory cells.
Figure 1. Major K+ current in shark electrosensory cells.
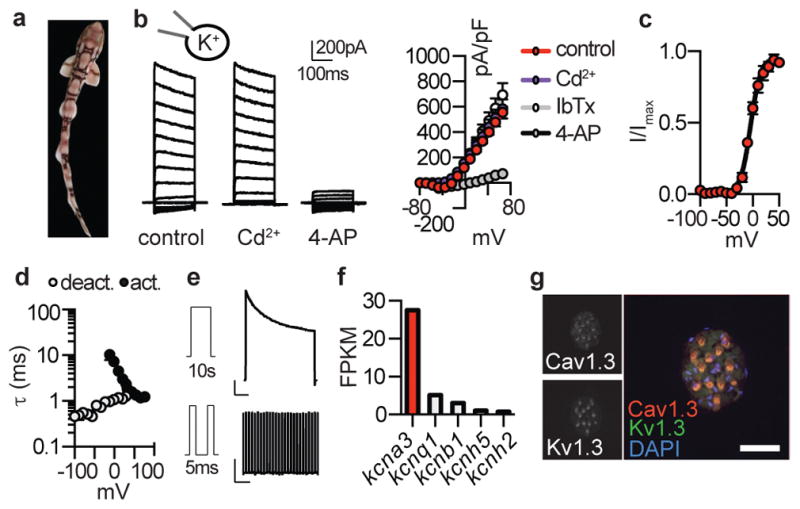
a. Profile of chain catshark (Scyliorhinus retifer).
b. Representative IKv currents elicited by increasing voltage pulses from −100mV were inhibited by the KV blocker 4-AP, but not the ICaV blocker Cd2+. Average I–V relationship from peak currents. n = 5, p < 0.0001 for outward control currents versus 4-AP, two-way ANOVA with post hoc Tukey test. The BK channel antagonist IbTx did not affect currents.
c. G–V relationships exhibited a half-maximal activation voltage (Va1/2) of −4.1 ± 0.8mV with a slope factor (Ka) of 9.5 ± 0.7mV. n = 11.
d. IKv activation and deactivation kinetics. τ values from single exponential fits of activation in response to the indicated voltage pulses (10mV increments from −100mV) or deactivation at the indicated voltages following an activating prepulse of 40mV. n = 6.
e. IKv inactivation over a 10s 40mV pulse (Top, 57 ± 4% current remained) and cumulative inactivation properties in response to repetitive 40mV pulses delivered in 5ms intervals (Bottom, 99 ± 2% current remained). Scale bars (Top) 500pA, 1s (Bottom) 500pA, 500ms. n = 8.
f. Voltage-gated K+ channel α-subunit mRNA expression in shark ampullary organs.
g. Co-localization of CaV1.3 (red) and KV1.3 (green) transcripts within catshark ampullary organs. Nuclei were stained with DAPI (blue). Scale bar, 100μm. Representative of n = 4.
All data represented as mean ± s.e.m.
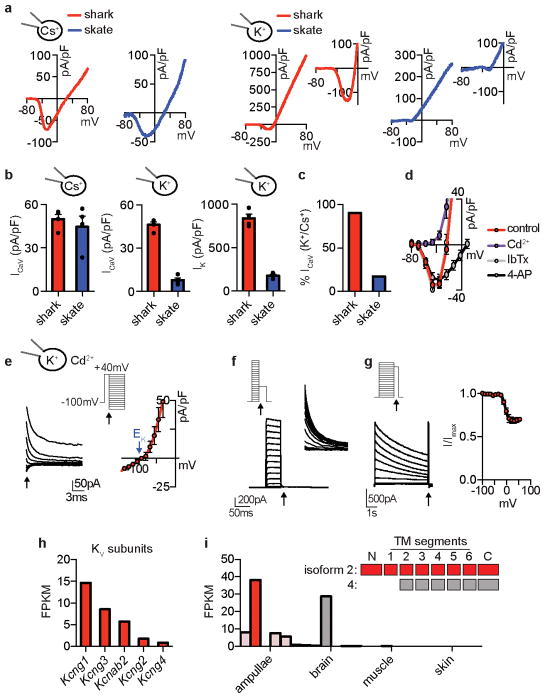
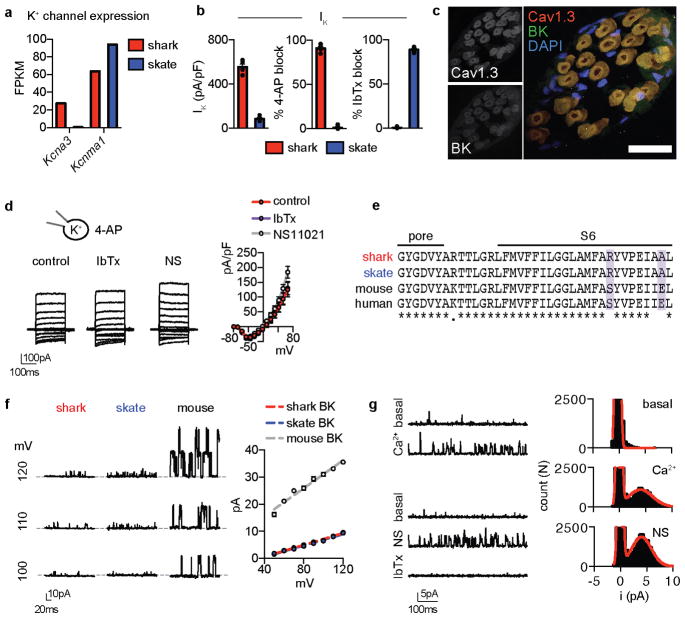
In skate electrosensory cells, Ca2+ influx activated outward K+ currents at relatively negative potentials to occlude inward Ca2+ currents (Extended Data Fig. 2a–c)6. In shark cells, however, we observed large K+ currents that were activated at more positive voltages and did not affect inward current amplitude, suggesting reduced functional interaction between Ca2+ and K+ currents (Extended Data Fig. 2a–c). Indeed, K+ currents were not affected by a ICaV blocker or BK antagonist (Fig. 1b, Extended Data Fig. 2d). Instead, the voltage-gated KV channel inhibitor, 4-aminopyridine (4-AP), blocked outward currents from shark electrosensory cells (IKV, Fig. 1b). IKV was K+ selective and exhibited a relatively high voltage activation threshold (Fig. 1c and Extended Data Fig. 2e, f). Furthermore, we observed fast activation and deactivation kinetics, whereas voltage-dependent inactivation (similar to desensitization) in response to prolonged voltage pulses was weak and slow, resulting in a K+ conductance of undiminished current amplitude even after repeated activation-deactivation cycles (Fig. 1d, e and Extended Data Fig. 2g). Among voltage-gated K+ channels, transcripts encoding the pore-forming subunit of KV1.3 predominated in shark ampullary organs (together with several KV auxiliary subunits) and co-localized with CaV1.3 in electrosensory cells (Fig. 1f, g, Extended Data Fig. 2h). Outside of ampullary organs, only a truncated form of KV1.3 lacking an essential N-terminal tetramerization domain was observed in the brain (Extended Data Fig. 2i). KV1.3 expression was not detected in skate ampullary organs and only shark electrosensory cells expressed 4-AP sensitive voltage-gated K+ currents (Extended Data Fig. 3a–b). Furthermore, both shark and skate electrosensory cells expressed BK transcripts which, when heterologously expressed, produced channels with similar properties; however, functional BK currents were observed only in the latter (Extended Data Fig. 3). Thus, BK channels do not contribute appreciably to the major K+ conductance in shark electrosensory cells, at least not under developmental or physiological conditions examined here. In summary, shark electrosensory cells express a specific IKV with voltage-dependent properties that support repetitive stimulation.
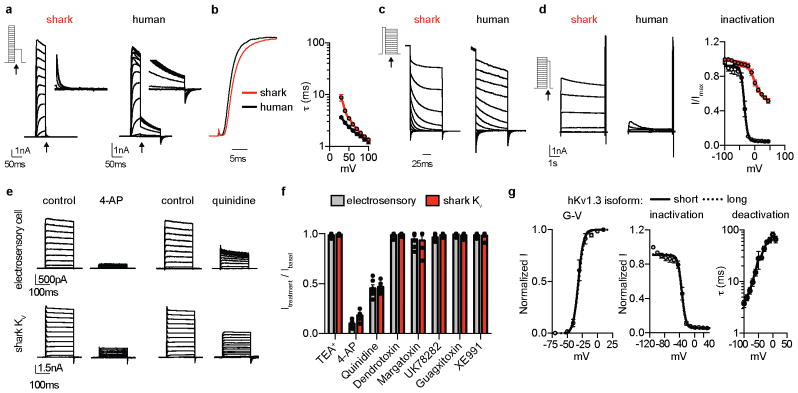
Shark KV1.3 is 80% identical to the human orthologue, but its voltage threshold for activation was shifted to more depolarized values compared with human KV1.3 (Fig. 2a, Extended Data Fig. 4a). Furthermore, shark KV1.3 activated at slightly slower rates and deactivated with rapid kinetics, requiring substantially less negative voltage to return to resting state compared with the human channel (Fig. 2b, c and Extended Data Fig. 4b, c). Shark KV1.3 inactivation was slow and only weakly voltage-dependent compared to human KV1.3 (Fig. 2d, Extended Data Fig. 4d). Consequently, shark KV1.3 produced a conductance that could be repetitively stimulated with undiminished amplitude, whereas human KV1.3, quickly inactivated with repetitive voltage pulses (Fig. 2e). These biophysical properties resemble those of native shark IKV, which also exhibited a comparable pharmacological profile (Extended Data Fig. 4e, f). One notable difference is that deactivation kinetics of native IKV were faster than those of the cloned channel, particularly at positive voltages. Thus, while KV1.3 forms the predominant K+ conductance in shark electrosensory cells, auxiliary subunits, signaling cascades, or structural proteins may provide additional regulatory mechanisms to further enhance rapid deactivation.
Figure 2. Shark KV properties.
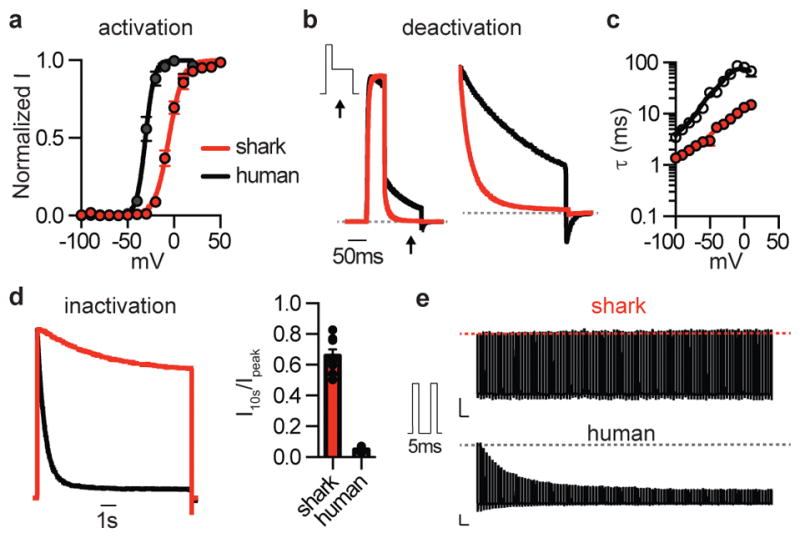
a. Average G–V relationships from currents measured at −30mV following activating pulses at the indicated voltage. Shark KV1.3 Va1/2 was −5.4 ± 0.4mV, Ka = 7.6 ± 0.4mV, and human KV1.3 Va1/2 was −30.7 ± 0.5mV, Ka = 4.7 ± 0.5mV. n = 10, p < 0.0001 for Va1/2, two-tailed Student’s t-test.
b. Deactivation kinetics of KV currents at −30mV normalized to maximal amplitude elicited at 40mV. Arrows indicate when deactivation rates were measured. (Right) Expanded view.
c. Deactivation properties of shark (red) and human (black) KV1.3 channels. τ values from single exponential fits of deactivation at the indicated voltages following an activating prepulse of 40mV (Right). n = 6, p < 0.0001 for comparison of orthologues across voltage pulses, two-way ANOVA with post hoc Bonferroni test.
d. Normalized currents showing inactivation in response to a 10s 40mV pulse. Average current remaining at the end of 10s step. n = 8, p < 0.0001, two-tailed Student’s t-test.
e. Currents demonstrating differences in cumulative inactivation in shark (red) and human (black) KV1.3 channels in response to 40mV pulses from −100mV delivered in 5ms intervals. Representative of n = 12.
All data represented as mean ± s.e.m.
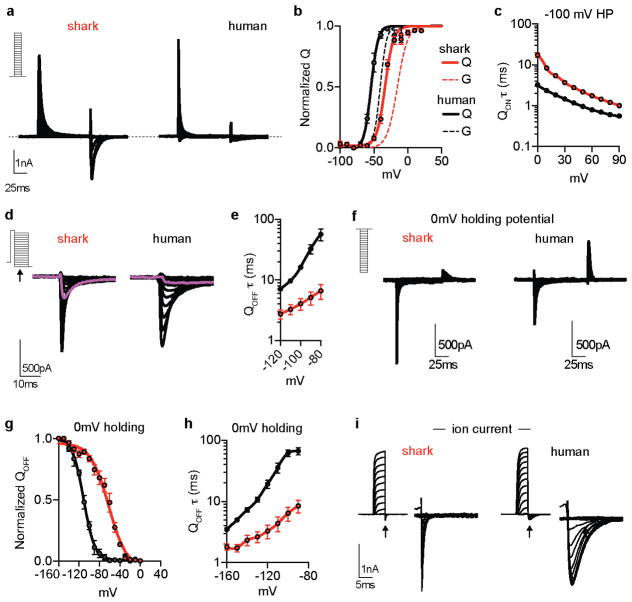
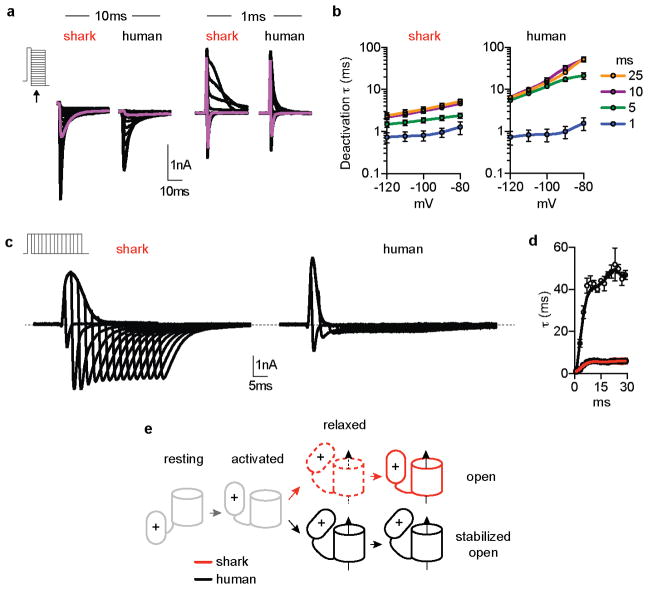
The voltage-dependent properties of shark KV1.3 likely derive from altered voltage sensor domain movements, which we verified by comparing gating currents from modified nonconductive shark and human KV1.3. For these experiments, we analyzed a human isoform exhibiting increased surface expression and thus enhanced gating current amplitude (Extended Data Fig. 4g)8. Similar to ion (permeating) currents, upward/activating voltage sensor movements (represented as ON gating charge, QON) for shark KV1.3 exhibited a higher voltage activation threshold and slower kinetics compared with human KV1.3 (Extended Data 5a–c). Moreover, shark KV1.3 gating current deactivation (QOFF; return of voltage sensors to resting state following depolarizing pulses) required less negative voltage and was accelerated (Extended Data Fig. 5d–h). Consequently, ion tail current deactivation, representing channel pore closure, was faster in shark KV1.3 (Extended Data Fig. 5i). Why does shark KV1.3 favor the resting state? When we recorded QOFF following a series of depolarizing voltage pulses of varying lengths, human KV1.3 deactivation kinetics markedly slowed following pulses longer than 1 ms, while shark channel deactivation rates remained relatively rapid and constant with increasing pulse lengths (Extended Data Fig. 6a–d). This slowing in deactivation is characteristic of voltage sensor domain ‘relaxation’, which has been proposed to slow KV channel closure9. We therefore hypothesize that reduced voltage sensor relaxation in shark KV1.3 results in decreased open state stability; as such, much less negative voltage is required to return channels to a resting state and mediate fast channel closure (depicted in our model, Extended Data Fig. 6e).
We analyzed shark-human KV1.3 chimeras to see if specific domains specify relevant biophysical attributes. Replacement of the S1–S6 region of human KV1.3 with that of shark recapitulated the high voltage activation threshold, rapid deactivation kinetics, and weak inactivation of wild type shark KV1.3 channels, and the converse chimera also altered channel properties (Extended Data Fig. 7a, b). We next substituted just the voltage sensor domain region (S1–S4) and found that activation threshold and deactivation kinetics were greatly affected, while inactivation remained similar (Extended Data Fig. 7a, b). In contrast, only inactivation was affected by replacing S5–S6 (Extended Data Fig. 7c–e), consistent with a role for the outer pore in C-type inactivation10. Thus, specific structural adaptations in the KV1.3 transmembrane core specify physiologically relevant biophysical properties.
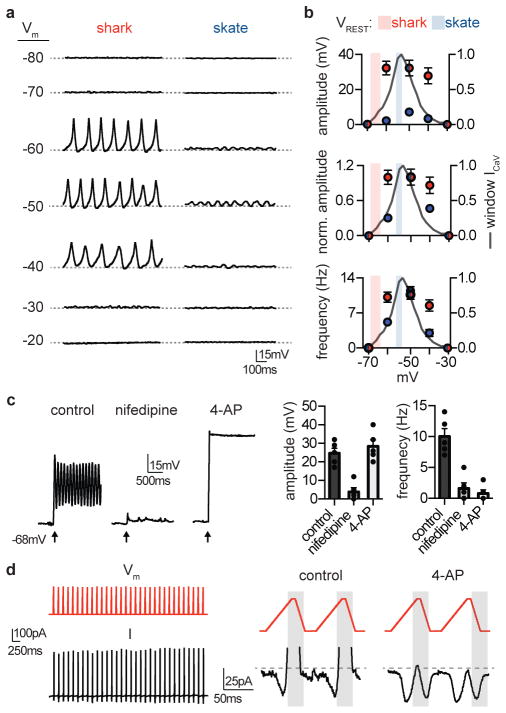
Membrane voltage (Vm) oscillations within ampullae control neurotransmitter release from electrosensory cells onto afferent nerves, thereby sculpting signals to the central nervous system2,3. In skate electrosensory cells, functional coupling of CaV1.3 and BK mediates Vm oscillations that are tuned to low frequencies, such as those detected by behaving animals6. Consistent with our previous results, skate electrosensory cells had a resting Vm of −54 mV, near the peak of the ICaV window current where cells exhibited spontaneous voltage oscillations (Fig. 3a, b). Injecting current to bring skate cell Vm to various potentials modulated oscillatory behavior, greatly changing both frequency and amplitude across physiological membrane potentials (Fig. 3a, b). In contrast, shark electrosensory cells had an average resting Vm of −66 mV, on the cusp of the ICaV window current where cells were relatively quiet (Fig. 3a, b). Injecting current to bring Vm within the range of ICaV threshold and window current elicited robust repetitive Vm spiking that lasted the duration of recordings. Spiking only slightly decreased in amplitude and frequency at more positive voltages (Fig. 3a, b), since spike amplitude is likely determined by the voltage threshold of IKV. Indeed, the ICaV inhibitor nifedipine blocked evoked depolarization and 4-AP prevented or greatly slowed repolarization (Fig. 3c). Thus, in both shark and skate, activity is limited to membrane voltages in which ICaV window current is observed, but dynamics are drastically different, behaving more as an all-or-none ON/OFF switch in sharks compared to a more tunable system in skates.
Figure 3. Voltage dynamics in electrosensory cells.
a. Membrane voltage (Vm)-dependent spiking in shark electrosensory cells and smaller voltage oscillations from skate cells at the indicated membrane potentials (Vm, dotted lines) achieved by fixed current injection.
b. Average voltage oscillation amplitude, normalized amplitude, and frequency at various membrane voltages for shark (red) and skate (blue) electrosensory cells. Values for oscillations from skate were significantly different at voltages where activity was observed, while shark cell activity changed only slightly at more depolarized voltages. n = 5, p < 0.01 for skate at −40, −50, −60mV versus all other voltages, two-way ANOVA with post hoc Tukey test. The mean ± s.e.m. for resting membrane voltages (VREST) for shark (red, −66.2 ± 2.7mV) and skate (blue, −54 ± 1.8mV) are indicated as bars on each graph. n = 5 for skate and 10 for shark, p < 0.01 two-tailed Student’s t-test.
c. Brief current injection (2pA, 5ms, at arrow) from −68mV elicited repetitive spiking that was inhibited by nifedipine. Brief injection elicited sustained depolarization in the presence of 4-AP. n = 5, p < 0.001 for amplitude of control versus nifedipine and for control versus nifedipine or 4-AP for frequency, one-way ANOVA.
d. (Left) Simulated repetitive spiking voltage-clamp protocol (Vm, −65mV to −15mV) elicited currents that do not inactivate (I). (Right) Depolarizing voltage increased inward currents until a voltage threshold was reached that activated a large outward current (shaded grey area), which rapidly deactivated with hyperpolarizing voltage. The cycle repeats in the next simulated spike protocol. The outward current was blocked by 4-AP, revealing a resurgent inward current in the hyperpolarizing phase. Representative of n = 4.
All data represented as mean ± s.e.m.
To further assess how ICaV and IKV kinetics and voltage dependence contribute to Vm spiking dynamics, we recorded currents in response to simulated Vm spikes in voltage-clamp. Repetitive simulated spikes induced inward and subsequent outward currents that rapidly activated and deactivated but did not inactivate (Fig. 3d). Inward ICaV was small at a resting potential of −65 mV and increased with positive voltage until a high voltage threshold, which triggered an outward current that rapidly deactivated when voltage was returned to rest (Fig. 3d). 4-AP blocked this outward current, implicating IKV, while also revealing a resurgent ICaV upon hyperpolarization that could contribute to initiating the following voltage spike (Fig. 3d). Thus, the low voltage threshold and inactivation properties of ICaV, coupled with the high voltage threshold, rapid deactivation, and weak inactivation of IKV are suited to cooperatively mediate Vm spiking in shark electrosensory cells. Interestingly, transcripts for Ca2+ binding proteins and pumps were enriched in shark ampullary organs, which may help facilitate repetitive Ca2+ influx (Extended Data Fig. 8a). Together, these cellular properties could support robust repetitive activity in shark electrosensory cells to amplify responses to incoming electrical signals. In contrast, skate cells exhibit low-level tonic activity at rest that could be retimed or modulated in response to particular incoming electrical frequencies to alter neurotransmitter release.
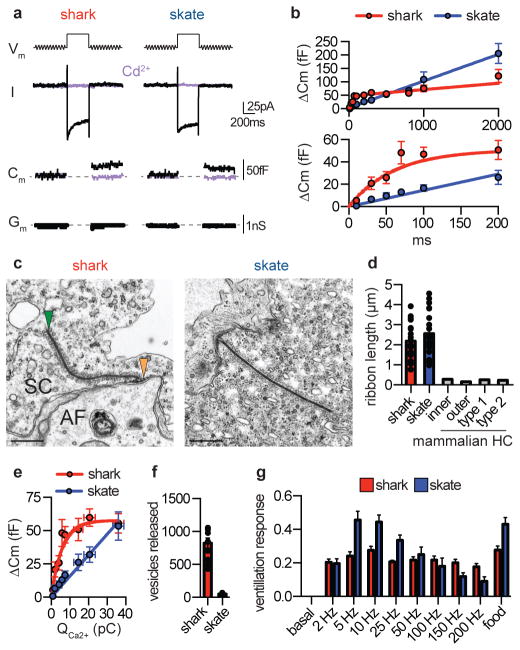
To determine how synaptic vesicle release is affected by differences in Vm activity, we monitored membrane capacitance (Cm) to measure vesicle fusion in response to electrical stimuli. Depolarization of shark or skate electrosensory cells elicited inward currents and capacitance changes that were blocked by Cd2+, indicating that ICaV is required for vesicular release (Fig. 4a). Increasing stimulus duration increased Cm changes (Fig. 4b, Extended Data Fig. 9a), but with distinct dynamics in shark versus skate electrosensory cells: brief voltage stimuli induced larger changes in shark cell Cm that saturated in response to longer stimuli, while skate cells exhibited Cm changes that increased linearly with stimulus duration (Fig. 4b).
Figure 4. Tuning of electrosensory cell vesicular release and electrosensation.
a. Representative capacitance measurements. (Vm) A sine wave was applied before and after a 200ms −20mV pulse to activate ICaV in shark (red) or skate (blue) electrosensory cells. (I) ICaV and (Cm) capacitance changes were blocked by Cd2+ (purple). (Gm) Membrane conductance was constant in all quantified data. Representative of n = 4.
b. (Top) Average capacitance changes in response to various durations of voltage stimuli. The response relationship from shark electrosensory cells (red) saturated in response to prolonged stimuli, while capacitance changes in skate cells (blue) increased in a nearly linear fashion with increasing voltage stimulus duration. (Bottom) Brief stimuli elicited larger capacitance changes in shark electrosensory cells compared with skate cells. Shark cell capacitance-duration relationship was best fit by an exponential relationship that plateaued at 51fF with a time constant of 42ms, while the relationship in skate cells was linear with a slope of 0.15 ± 0.01fF/ms. n = 6.
c. Micrographs showing shark and skate ribbon synapses. The electrosensory cell (SC), afferent nerve (AF), synapse (orange arrowhead), and synaptic ribbon (green arrowhead) are indicated. Scale bars, 500nm.
d. Average ribbon length was similar in shark (red) and skate (blue) electrosensory cells, which was much longer than those from homologous mammalian hair cells13. n = 21.
e. Average capacitance change elicited by integrated ICaV (QCa2+) revealed that less QCa2+ is required to elicit large capacitance changes in shark electrosensory cells (red) compared with skate cells (blue). Capacitance-QCa2+ relationship was exponential for shark and linear for skate. n = 6.
f. Average number of calculated vesicles released per spike or oscillation based on capacitance-QCa2+ relationship and simulated voltage oscillation-induced QCa2+. n = 6, p < 0.0001, two-tailed Student’s t-test.
g. Normalized ventilatory responses elicited from live sharks or skates in response to 50μV electric stimuli at indicated frequencies. Food odorants were used as a positive control. Shark responses to electrical frequencies were largely comparable, regardless of stimulus frequency. Skate peak responses to low frequencies were significantly different from those at other frequencies but were comparable to odorant-elicited responses (n = 10, p < 0.0001 for 5, 10, 25Hz versus other frequencies, one-way ANOVA with multiple comparisons).
All data represented as mean ± s.e.m.
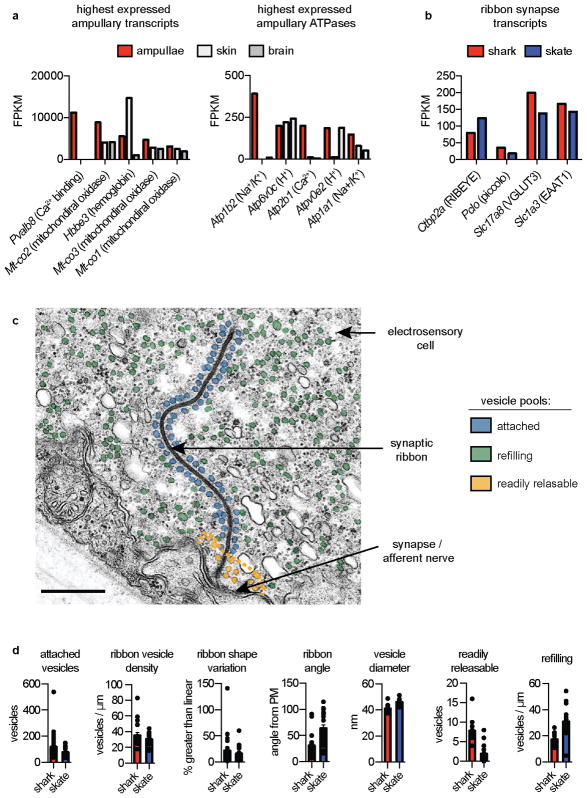
Differences in synaptic vesicle number or distribution could account for these distinct vesicle release dynamics. Skate electrosensory cells contain large synaptic ribbons that tether numerous vesicles for release onto postsynaptic afferents11,12. Indeed, shark and skate ampullae expressed transcripts associated with ribbon synapses, and ultrastructural analysis of electrosensory cells revealed that both contain remarkably long synaptic ribbons compared to those from mammalian hair cells (Fig. 4c, d and Extended Data Fig. 8b, c)13. Moreover, shark and skate ribbons were similarly shaped and tethered an equivalent number of vesicles of comparable diameter. However, shark electrosensory cells had a larger “readily releasable” vesicle pool (Extended Data Fig. 8d), which facilitates rapid and efficient exocytosis in other systems14,15 and might account for our observation that short voltage stimuli induce larger changes in Cm in electrosensory cells from shark. Skate electrosensory cells, on the other hand, contained more free cytosolic vesicles, which by analogy with other systems14 may represent a larger “refilling pool” of recently generated vesicles available for tethering and release (Extended Data Fig. 8d). Thus, skate cells may be better equipped to continuously supply vesicles for tonic release, reflected by the non-saturating, linear change in Cm in response to increasing voltage stimuli.
To determine the magnitude of Cm change induced by a single Vm spike or oscillation, we first integrated ICaV (QCa2+) elicited by stimuli of varying duration, thereby establishing a relationship between QCa2+ and Cm (Fig. 4e). Shark and skate cells responded equally to identical voltage stimuli, further suggesting that ICaV is similar in both cell types and that K+ channel identity dictates the oscillation phenotype and resulting ICaV amplitude (Extended Data Fig. 9b–d). We next fit QCa2+ induced by simulated Vm spikes or oscillations to QCa2+-Cm relationships and used the specific capacitance for a pure lipid membrane of electrosensory cell vesicle diameter to estimate fusion events from measured Cm changes16. Strikingly, our calculations suggest that shark cells released at least 10X more vesicles in response to one Vm spike compared to skate cells subjected to a single oscillation event (Fig. 4f). Furthermore, as with other ribbon synapses, the large storage pool could facilitate sustained release of vesicles in response to repetitive Vm spiking, further amplifying signals14. Taken together, these properties should render sharks acutely sensitive to incoming signals by greatly amplifying vesicular release to even very brief stimuli. In contrast, skate cells may better encode stimulus variation with tunable voltage oscillations and more graded vesicle release.
How do differences in Vm oscillations and vesicle release at the cellular level contribute to sensation at the organismal level? Elasmobranchs preferentially respond to low frequency electrical signals produced by their prey, but direct comparison of frequency selectivity between species is confounded by behavioral and physiological differences5. We therefore measured changes in ventilatory rate as a basic, time-locked physiologic metric that is well-validated in electroreceptive elasmobranch species and readily observed in response to sensory cues, such as weak electrical stimuli or odorants17,18 (Supplementary videos 1 and 2). When presented with electrical stimuli of identical strength, sharks increased ventilation rates similarly at all stimulus frequencies (Fig. 4g). In contrast, skates maximally increased ventilation at low frequencies resembling voltage oscillations in their electrosensory cells or those emitted by their electric organ (Fig. 4g). In both species, maximal electrically-induced ventilatory responses were similar to those evoked by food odorants as a comparative control (Fig. 4g). Thus, shark electroreception may act as a threshold detector for broad frequencies, potentially reflecting its role in predation, whereas skate sensation appears more specifically tuned to particular frequencies in the range of conspecific electric organ discharges5.
Electroreception has independently evolved in many taxa to facilitate particular behaviors ranging from predation to communication. By analyzing related species that use electroreception for distinct purposes, we found that subtle molecular variations significantly alter cellular properties that could ultimately mediate differences in behavior. Our results suggest that molecular tuning of electrosensory cell Vm oscillations is important for initial detection and discrimination of salient electrical signals, although anatomical characteristics and processing by the central nervous system likely contribute to additional signal filtering (Extended Data Fig. 10)19. This observation is reminiscent of other sensory modalities in which sensory cells or their receptors are modified to mediate detection of relevant stimuli. For example, expression and regulation of ion channels enable hair cells, which are developmentally related to electrosensory cells, to produce Vm oscillations of various amplitudes and frequencies to mediate detection of particular auditory signals20,21. While it is not known how broadly voltage oscillation tuning mechanisms apply to electroreception, paddlefish electrosensory organs also express transcripts for CaV and K+ channels, suggesting that similar mechanisms may produce Vm oscillations in these systems22,23. Furthermore, weakly electric fish use oscillating or spiking electrosensory organs to facilitate conspecific communication24. Our results demonstrate one mechanism by which K+ channel modification shapes electrosensory cell activity, but regulation of other transduction components could provide alternative tuning mechanisms in distinct species or under specific developmental or physiological states to facilitate dynamic electroreceptive behaviors5,25,26.
Methods
Animals and cells
Male and female chain catsharks (Scyliorhinus retifer) and little skates (Leucoraja erinacea) were provided by the Marine Biological Laboratory (Woods Hole, MA) and their use was approved by the UCSF Animal Care and Use Committee. Animals were euthanized with tricaine methanesulfonate (MS222, 1g/L). Ampullary organs were removed from the hyoid cluster (skates) or buccal and supraorbital clusters (sharks) on ice and further dissected by removing most of the canals and afferent nerve fibers. Ampullae were treated with papain for <5 mins and then electrosensory cells were mechanically dissociated over the recording chamber. Isolated electrosensory cells were identified by the presence of their single kinocilium. HEK293T cells (ATCC) were grown in DMEM, 10% fetal calf serum, and 1% penicillin/streptomycin at 37°C, 5% CO2. Cells were transfected with Lipofectamine 2000 (Invitrogen/Life Technologies) according to manufacturer’s protocol. 100 ng of KV1.3 or 1 μg of nonconducting KV1.3 or BK constructs were co-expressed with 0.3 μg GFP. Mock transfection experiments (0.3 μg GFP) were performed as controls, in which minimal voltage-activated outward current was observed.
Whole mount preparations
Juvenile fish were euthanized with an overdose of MS-222 in artificial seawater and fixed in 4% paraformaldehyde for at least 24 hours. The cartilage matrix and electroreceptor tubules were stained using Alcian Blue (20 mg Alcian Blue 8GX in 30 mL glacial acetic acid and 70 mL 100% ethanol) and bone was stained using Alizarin Red following previously published methods27.
Molecular biology
Kcna3 and kcnma1 from shark ampullary organs were synthesized by Genscript (Piscataway, NJ). Human Kcna3 was from Genscript, skate BK was from the Julius lab, and mouse kcnma1 was a gift from Larry Salkoff (Addgene plasmid 16195). Chimera synthesis and mutagenesis were carried out and verified by Genscript (Piscataway, NJ) or by the QuikChange Lightning site-directed mutagenesis kit (Agilent Genomics).
Electrophysiology
Recordings were carried out at room temperature using a MultiClamp 700B amplifier (Axon Instruments) and digitized using a Digidata 1322A (Axon Instruments) interface and pClamp software (Axon Instruments). Capacitance and associated ion current measurements were amplified and digitized with an EPC10 amplifier in lock-in mode (HEKA) and Patchmaster software (HEKA). Unless stated otherwise whole cell data were filtered at 1 kHz and sampled at 10 kHz, and single-channel data were filtered at 5 kHz and sampled at 50 kHz. Data were leak subtracted online using a P/4 protocol, except for data obtained using voltage ramp protocols, and membrane potentials were corrected for liquid junction potentials. Electrosensory cell recordings were made using borosilicate glass pipettes polished to 8 – 10 MΩ. For heterologous expression experiments in HEK293, recordings were made using pipettes polished to 2 – 3 MΩ.
The extracellular solution was a modified ‘elasmobranch Ringer’s solution’ containing (mM): 250 NaCl, 6 KCl, 4 CaCl2, 1 MgCl2, 10 glucose, 5 HEPES, 360 urea, pH 7.6. When analyzing native K+ current properties, 500 μM Cd2+ was included to block ICaV. Four intracellular solutions were used: for recording ICav (mM): 250 CsMeSO3, 1 MgCl2, 11 Cs-EGTA, 10 HEPES, 30 sucrose, 360 urea, pH 7.6. For recording IK (mM): 250 K-gluconate, 1 MgCl2, 11 K-EGTA, 10 HEPES, 30 sucrose, 360 urea, pH 7.6. For recording membrane potential (mM): 250 K-gluconate, 1 MgCl2, 1 K-EGTA, 10 HEPES, 20 sucrose, 2 MgATP, 360 urea, pH 7.6. For recording capacitance changes (mM): 250 CsMeSO3, 1 MgCl2, 1 Cs-EGTA, 2 MgATP, 10 HEPES, 20 sucrose, 360 urea, pH 7.6. For recording heterologous KV1.3 ionic current, intracellular solution contained (mM): 145 K-gluconate, 5 KCl, 1 MgCl2, 5 K-EGTA, 10 HEPES, 10 sucrose, pH 7.2. Extracellular solution contained (mM): 150 NaCl, 5 KCl, 2 CaCl2, 2 MgCl2, 10 HEPES, 10 glucose, pH 7.4. For measuring KV1.3 gating currents, intracellular solution contained (mM): 150 NMDGMeSO3, 1 MgCl2, 10 Cs-EGTA, 10 HEPES, 10 sucrose, pH 7.3. Extracellular solution contained (mM): 150 TEACl, 1 CaCl2, 1 MgCl2, 10 HEPES, 10 glucose, pH 7.3. For gating current measurements, we used nonconducting shark (W407F) and human (W436F) KV1.3 channels28,29. A short isoform of human KV1.3, which exhibits identical gating properties but increased surface expression8, was used to increase gating current amplitude, while the long isoform was used for most ion current studies. For BK single-channel recordings, intracellular solution contained (mM): 136 K-gluconate, 4 KCl, 1 K-EGTA, 1 HEDTA, 10 HEPES, 10 glucose, pH 7.3. Extracellular solution contained (mM): 136 K-gluconate, 4 KCl, 1 MgCl2, 10 HEPES, 10 glucose, pH 7.3. Calculated concentrations of buffered Ca2+ added to intracellular solution were made using MaxChelator (C. Patton, Stanford University).
The pharmacological inhibitors or agonists Bay K, nifedipine, mibefradil, 4-aminopyridine (4-AP), XE991, NS11021, and quinidine were from Tocris. Iberiotoxin, α-dendrotoxin, margatoxin, UK78282, and Guangxitoxin-1E were from Alamone Labs. Compounds were dissolved in <1% vehicle (DMSO or water), which was used for a control. Ionic pore blockers stocks were made in standard extracellular solution and diluted before use. Unless stated otherwise, the following concentrations were used: 100 or 500 μM Cd2+, 1 μM Bay K, 10 μM nifedipine, 5 μM mibefradil, 1 mM 4-AP, 100 nM iberiotoxin, 10 mM TEA+, 10 μM NS11021, 100 μM quinidine, 25 nM α-dendrotoxin, 10 nM margatoxin, 1 μM UK78282, 25 nM Guangxitoxin-1E, 20 μM XE991. Pharmacological effects were quantified by differences in normalized peak current from the same cell following bath application of the drug (Itreatment / Icontrol).
Unless stated otherwise, ICaV was measured in response to 200 ms voltage pulses in 10 mV increments from a −100 mV holding potential. G–V relationships were derived from I–V curves by calculating G: G = ICa / (Vm−Erev) and fit with a Boltzman equation. Voltage-dependent inactivation was measured during −20 mV voltage pulses following a series of 2 s prepulses ranging from −100 to 60 mV in 10 mV increments. Voltage-dependent inactivation was quantified as I / Imax, with Imax occurring at the activating voltage pulse following a −100 mV prepulse. IK was measured in response to 200 ms voltage pulses in 10 mV increments from a −100 mV holding potential. G–V relationships were established from normalized tail currents measured at −30 mV following 50 ms voltage pulses in 10 mV increments from a −100 mV holding potential. Voltage-dependent inactivation was measured during 40 mV voltage pulses following a series of 5 s prepulses ranging from −100 to 60 mV in 10 mV increments. Cumulative inactivation was measured in response to 50 ms 40 mV pulses every 5 ms. Activation kinetics were determined by fitting the initial rising phase of currents activated by various voltages with single exponentials. Deactivation kinetics were fit with a single exponential upon repolarization to various voltages in 10 mV increments from 40 mV to −100 mV following 40 mV prepulses are indicated durations. The reversal potential for IKV was measured by plotting tail current-voltage relationships using a similar protocol that stepped in 10 mV increments from 40 mV to −120 mV. Single channel currents were measured from the middle of the noise band between closed and open states or calculated from the difference between Gaussian-fitted closed and open peaks on all-points amplitude histograms for each excised patch record. Conductance was calculated from the linear slope of I–V relationships. In current clamp, current injection was used to bring membrane potential to various values and then was fixed. In this case, membrane potential was defined as the base of the spiking or oscillating activity. Alternatively, brief current injection was delivered to determine the effects of pharmacological inhibitors on spiking activity.
QON and QOFF represents the integral of nonlinear gating current measured during and following voltage pulses from holding potentials of −100 or 0 mV. QON was only quantified from cells with no ionic current. ON gating current kinetics were quantified by single exponential fits of the slope of decreasing outward current elicited by voltage pulses in 10 mV increments from a −100 mV holding potential. OFF gating current kinetics were calculated by single exponential fits of the slope of increasing negative current elicited by voltage pulses in 10 mV increments from 0 mV holding potential. Voltage dependence of deactivation was also assessed by single exponential fits of currents upon repolarization to various voltages in 10 mV increments from 20 mV to −100 mV following 40 mV prepulses of indicated durations. Deactivation of gating currents was also measured at −100 mV with exponential fits following a series of 40 mV voltage pulses of varying duration from 0.5 ms to 30 ms.
Capacitance measurements were made using a 15 mV, 1.5 kHz sinusoidal stimulation protocol applied from −90 mV before and after depolarization pulses of various lengths to acquire pre- and post-stimulus capacitance values. Cells were discarded when series resistance (Rs) changed and exceeded membrane resistance (Rm) or if membrane conductance (Gm) varied greatly following depolarizing voltage pulses. Whole-cell ion currents were filtered at 1 kHz and sampled at 10 kHz. Gating currents and capacitance measurements were filtered at 1 kHz and sampled at 20 kHz. Capacitance records were filtered at 100 Hz during offline analyses. Changes in capacitance were measured by averaging capacitance over 200 ms after the depolarizing voltage step and subtracting the averaged capacitance prior to depolarization. Intracellular ATP was included in all experiments and 100 nM iberiotoxin, 1 mM 4-AP, and intracellular Cs+ were used to block K+ currents. The integral of ICaV (QCa2+) was used to account for variability in ICaV kinetics. To calculate vesicle release, we fit QCa2+ induced by simulated spike- or oscillation voltage protocols to QCa2+-Cm relationships. When identical voltage protocols were used to elicit ICaV, QCa2+ was the same from skate and shark electrosensory cells, consistent with similar ICaV in these cells.
Transcriptional sequencing and analysis
Poly A+ RNA was extracted from ampullary electrosensory cells, non-electroreceptor covered skin, muscle, and forebrain of an adult chain catshark then was reverse transcribed using SuperScript III kit (Invitrogen/Life Sciences). Sequencing libraries were prepared using the Illumina TruSeq Stranded mRNA Library Prep Kit according to the manufacturer’s instructions. Libraries were sequenced on the Illumina Hi-Seq 4000 (V. C. Genomics Sequencing Lab, University of California, Berkeley) using 150 cycles of paired end reads, producing 30 to 40 million inserts for each sample.
Transcriptomes for each sample were assembled de novo using the Trinity suite (version 2.1.0). Sequences were aligned to the zebrafish protein database (NCBI assembly GRCz10) using the blastx tool from NCBI blast (version 2.2.31) using a maximum E value of 1×10⁻⁵. Reciprocal blastx alignments (using zebrafish protein sequences that aligned to catshark sequences) were performed to the human protein database. Estimates of relative abundance for differential expression comparisons were performed using the RSEM software package within Trinity. These values are reported as fragments per kilobase of exon per million fragments mapped (FPKM).
In situ hybridization histochemistry
Adult chain catsharks were euthanized with an overdose of MS-222 in artificial seawater and trans-cardially perfused with PBS followed by 4% PFA. Buccal and supraorbital clusters of alveolae the ampullary organs, were dissected and cryo-protected in 30% sucrose in PBS overnight. Cryostat sections (15 μm thick) were probed with digoxigenin-labeled cRNA for shark CaV1.3 and fluorescein-labeled cRNA for shark BK and KV1.3 receptors. Probes were generated by T7/T3 in vitro transcription reactions using a 500 nucleotide fragment of CaV1.3 cDNA (nucleotides 3700 to 4200), a 325 nucleotide fragment of BK cDNA (nucleotides 636 to 961), and a 470 nucleotide fragment of KV1.3 cDNA (nucleotides 670 to 1140). Hybridization was developed using anti-digoxigenin and anti-fluorescein Fab fragments, followed by incubation with Fast Red and streptavidin conjugated Dylight 488 (to probe for BK) according to published methods30. Following hybridization and detection, sections were coverslipped and co-stained with DAPI as a nuclear marker (Prolong Gold Antifade Mountant with DAPI; Invitrogen).
Transmission electron microscopy
Tissue samples from the catshark and skate hyoid capsule with electrosensory cells were fixed in 2% glutaraldehyde, 1% paraformaldehyde in 0.1M sodium cacodylate buffer pH 7.4, post fixed in 2% osmium tetroxide in the same buffer, en bloc stained with 2% aqueous uranyl acetate, dehydrated in acetone, infiltrated, and embedded in LX-112 resin (Ladd Research Industries, Burlington, VT). Toluidine blue stained semi-thin sections were made to orient and locate the area of interest. Samples were ultrathin sectioned (typically 100 nm) on a Reichert Ultracut S ultramicrotome and counter-stained with 0.8% lead citrate. Grids were examined on a JEOL JEM-1230 transmission electron microscope (JEOL USA, Inc., Peabody, MA) and imaged with the Gatan Ultrascan 1000 digital camera (Gatan Inc., Warrendale, PA). All measurements were performed in Image J (National Institutes of Health, Bethesda, MD) on electron micrographs adjusted for brightness and contrast (Photoshop CS6, Adobe Systems, San Jose, CA). Measurements of vesicles followed published methods31, with populations attached to the ribbon structure (“attached”), in proximity to the synapse (“readily releasable”), and freely filling cytosolic space (“refilling”).
To measure ribbon shape variation, the difference between the traced distance of the ribbon and the distance of a line drawn from start to end of the ribbon was divided by the distance of that line. All values represent a positive difference (increase in length) from this straight line. The angle of the ribbon to the surface of the plasma membrane (“angle from PM”) was measured using the angle tool in ImageJ by selecting 3 points: a point on the ribbon about 150 nm from the synapse, a point at the juncture of the ribbon and the synaptic density on the plasma membrane, and a point located on the plasma membrane about 150 nm from the juncture with the ribbon, producing an acute angle.
Behavioral analysis
In an isolated location and with normal lighting conditions, individual juvenile skates (n = 6) and sharks (n = 5) were allowed to freely move and habituate for 20 minutes in an ambient temperature, seawater-filled cylindrical acrylic tank (diameter = 28 cm). A sinusoidal electrical stimulus (100 μA over 5 mm), generated by threading positive and negative ends of tin-plated copper wire (300 VH, 22 gauge, NTE Electronics, Inc.) into seawater filled Tygon tubing powered by a function generator (Tone Generator Pro, Performance Audio, Salt Lake City, UT) was randomly positioned and obscured by sand substrate in one of four circles (diameter = 5.5 cm), all equally spaced from the center of the tank. Following an initial recording of baseline ventilation frequency, individual fish were stimulated at 2, 5, 10, 25, 50, 100, 150, and 200 Hz for 5 minutes, in randomized order. Each frequency was tested 10 times. All skates were exposed to a plume of Mysis shrimp odorant, and sharks were presented with squid odorant in order to measure responses to natural food stimuli. To prevent habituation to the stimuli, an interval of 20 minutes without electrical stimuli was used between each trial. A digital video camera (Panasonic HC-V770) was positioned above the tank was used and measure ventilatory responses, as characterized by cyclical movement of spiracles or gills. Measurements were made blind to stimulation conditions.
Statistical analysis
Data were analyzed with Clampfit (Axon Instruments), Patchmaster (HEKA), or Prism (Graphpad). Data are represented as mean ± s.e.m. and n represents independent experiments for the number of cells in electrophysiology, quantified structures from histological analysis, or behavioral trails. Data were considered significant if p < 0.05 using paired or unpaired two-tailed Student’s t-tests or one- or two-way ANOVAs. All significance tests were justified considering the experimental design and we assumed normal distribution and variance, as is common for similar experiments. Sample sizes were chosen based on the number of independent experiments required for statistical significance and technical feasibility.
Data Availability
Deep sequencing data are archived under GEO accession number GSE103977. The GenBank accession numbers for the α subunit are: CaV1.3 MF959522, KV1.3 MF959523, and BK MF959524. Other data are available from the authors upon request.
Extended Data
Extended Data Figure 1. Shark ICaV properties.
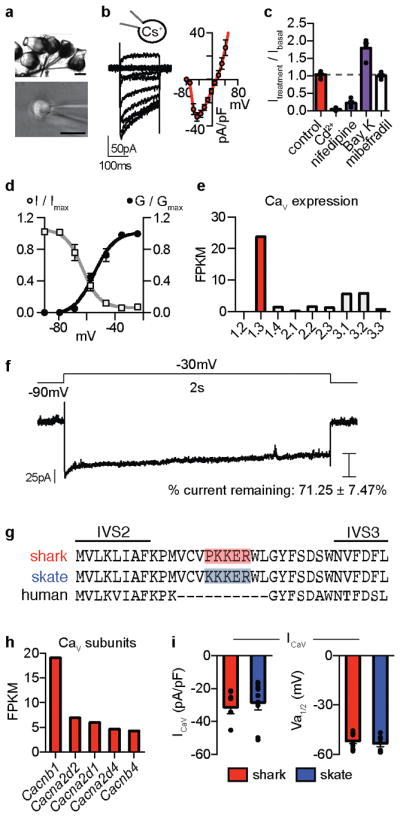
a. Isolated shark ampullary organs with attached canals and nerve fibers (Top, scale 100μm) and a representative electrosensory cell patch clamp experiment (Bottom, scale 10μm).
b. ICav currents elicited by increasing voltage pulses from −100mV (Left) and average current–voltage (I–V) relationship (Right, n = 7).
c. ICav exhibited an L-type CaV pharmacological profile: Peak currents were regulated by Bay K (agonist), Cd2+ (blocker), nifedipine (antagonist), but not mibefradil (T-type antagonist). n = 4. p < 0.0001 for control versus all treatments except mibefradil, one-way ANOVA with post hoc Bonferroni test.
d. ICav conductance–voltage (G–V) relationship (black) with half-maximal activation voltage (Va1/2) of −54.6 ± 1.2mV. Inactivation-voltage relationship (grey) with half-inactivation potential (Vh1/2) of −62.9 ± 1.4mV. A large window current was observed between −70 and −40mV. G–V relationships were established from current measurements during voltage pulses delivered in 10mV increments from −100mV. Inactivation was measured at −20mV test pulse following a series of voltage prepulses. n = 7.
e. Cav α-subunit mRNA expression in shark ampullary organs. Bars represent fragments per kilobase of exon per million fragments mapped (FPKM).
f. ICaV elicited by a 2s depolarizing voltage step to −30mV exhibits little inactivation. Representative of n = 5.
g. CaV1.3 alignment revealed the IVS2–S3 motif that confers low voltage threshold in skate CaV1.3 is conserved in the shark orthologue.
h. Expression of CaV auxiliary subunits in shark ampullary organs. Bars represent fragments per kilobase of exon per million fragments mapped (FPKM).
i. Average ICaV current density and voltage activation threshold was similar in shark and skate electrosensory cells. n = 6.
All data represented as mean ± s.e.m.
Extended Data Figure 2. Shark IKV properties.
a. Currents elicited by 500ms voltage ramps in shark (red) or skate (blue) electrosensory cells in the presence of intracellular Cs+ (Left) or K+ (Right). Inset (Right): Inward ICaV in the presence of intracellular K+.
b. Average ICaV current density elicited by voltage ramps was similar in the presence of intracellular Cs+ but larger in shark cells in the presence of intracellular K+. Outward K+ current density was significantly larger in shark cells. n = 5, p < 0.0001 for shark versus skate ICaV or IK with intracellular K+, two-tailed Student’s t-test.
c. The % of ICaV remaining in the presence of K+ compared with Cs+ is markedly greater in shark cells compared with those from skate.
d. Inward currents elicited by increasing voltage pulses from −100mV were not affected by IbTx or 4-AP, but were blocked by Cd2+ n = 5, p < 0.0001 for inward control currents versus Cd2+, two-way ANOVA with post hoc Tukey test. Peak inward currents were not affected by IbTx or 4-AP.
e. Reversal potential for IKV in shark electrosensory cells is near the reversal potential for selective K+ permeation (EK, blue arrow on I–V plot). n = 5. Arrows indicate when currents were measured at the indicated voltages following an activating prepulse of 40mV (also shown in expanded view). Extracellular Cd2+ was included to block ICaV for IKV biophysical studies.
f. IKv currents elicited by a voltage protocol for obtaining G–V relationship. Arrows indicate when tail currents were measured at −30mV following voltage steps that increased in 10mV increments from −100mV (expanded view within Inset). Representative of n = 11.
g. IKv voltage dependent inactivation properties. Arrow indicates when inactivation was measured during 40mV pulses following a series of prepulses that increased in 10mV increments from −100mV. Vh1/2 was −5.5 ± 1.7mV and inactivation was incomplete, n = 6.
h. mRNA expression of the KV channel auxiliary subunits in shark ampullary organs. Bars represent fragments per kilobase of exon per million fragments mapped (FPKM).
i. mRNA expression of Kcna3 isoforms. The major isoform studied is indicated in red. Other low expression ampullary isoforms were similar. The only isoform appreciably expressed outside of ampullae was truncated and found in the brain (grey).
All data represented as mean ± s.e.m.
Extended Data Figure 3. Shark BK properties.
a. mRNA expression of major K+ channel α subunits (Kcna3, KV1.3) and (Kcnma1, BK) in shark and skate electrosensory cells.
b. Average K+ current density, 4-AP-sensitive current (IKV), and IbTx-sensitive current (IBK) in shark and skate electrosensory cells. n = 5, p < 0.0001 for shark versus skate cells for all comparisons, two-tailed Student’s t-test.
c. Co-localization of CaV1.3 (red) and BK (green) transcripts within shark ampullary organs. Nuclei were stained with DAPI (blue). Scale bar, 100 μm. Representative of n = 4.
d. In the presence of 4-AP, a relatively small outward current remained that was insensitive to IbTx and slightly increased by NS11021 at very positive voltages. n = 5, p < 0.05 for control versus NS at 70 or 80mV, two-way ANOVA with post hoc Tukey test.
e. BK alignment revealed that residues found to reduce conductance in skate BK are conserved in the shark orthologue.
f. Heterologously expressed shark and skate BK had relatively small single-channel conductance compared with mouse BK. Shark BK = 109 ± 4pS, skate BK = 105 ± 5pS, mouse BK = 259 ± 12pS n = 5, p < 0.0001 for mouse versus shark or skate BK, two-way ANOVA with post hoc Tukey test.
g. 1μM Ca2+ increased open probability in shark BK expressed in excised inside-out patches and 10μM NS11021 increased open probability of channels in excised outside-out patches. NS11021 modulation was blocked by 100nM IbTx. Holding voltage was 80mV. NPo: basal, 0.0061 ± 0.0014; Ca2+, 0.11 ± 0.011, NS = 0.24 ± 0.026, n = 5, p < 0.0001 for basal versus Ca2+ or NS, two-tailed Student’s t-test. All data represented as mean ± s.e.m.
Extended Data Figure 4. Shark KV properties.
a. Voltage-activated currents recorded in HEK293 cells expressing shark (red) or human (black) KV1.3. Inset: Arrows indicate when currents were measured at −30mV following voltage pulses that increased in 10mV increments from −100mV.
b. (Left) Normalized currents elicited by a 40mV voltage pulse demonstrated that expressed shark KV channels open more slowly compared with human orthologues. (Right) Average activation kinetics were slower for shark KV compared with human KV in response to voltages from 20mV to 50mV. n = 6, p < 0.0001 for contribution of orthologue identity to series variance, two-way ANOVA with post hoc Bonferroni test.
c. Deactivation kinetics of normalized currents from shark and human KV channels at various repolarizing voltages following an activating prepulse of 40mV. Arrow indicates when current properties were measured during voltage protocol.
d. Inactivation properties (Left) and average inactivation–voltage relationships of shark (red, Vh1/2 = 0.1 ± 2.8mV) and human (black, Vh1/2 = −30.6 ± 0.9mV) KV1.3 channels. Arrow indicates when inactivation was measured during 40mV pulses following a series of prepulses that increased in 10 mV increments from −100mV. n = 9, p < 0.0001 for Vh1/2, two-tailed Student’s t-test.
e. IKV was reduced by 4-AP or quinidine in native shark electrosensory cells or heterologously expressed shark KV1.3. Currents were elicited by increasing voltage pulses from −90mV (native) or −100mV (heterologous).
f. Pharmacological profile of shark electrosensory cell IKV and heterologously expressed shark KV1.3. Currents measured at peak amplitude were reduced by 4-AP or quinidine, but not other treatments. Pharmacological modulation of native IKV and shark KV1.3 was similar. All data represented as mean ± s.e.m.
g. The short human isoform of KV1.3 (short N-terminal truncation) was used to study gating currents because of enhanced expression, but channel properties are identical15. Similarly, we found that activation threshold and G–V relationship, voltage-dependent inactivation, and deactivation were similar between long and short isoforms. n = 6.
Extended Data Figure 5. Shark KV gating currents.
a. Gating currents recorded in HEK293 cells expressing nonconductive shark (red) or human (black) KV1.3 elicited by increasing voltage pulses in 10mV increments from a −100mV holding potential.
b. Average charge (Q)-V relationships. Shark KV1.3 Va1/2 was −33.4 ± 0.5mV, Ka = 6.1 ± 0.5mV and human KV1.3 Va1/2 was −54.25 ± 0.7mV, Ka = 5.2 ± 0.6mV. n = 9, p < 0.0001 for Va1/2 two-tailed Student’s t-test. Dotted lines indicate associated G–V relationships.
c. QON kinetics following voltage sensor activation from a holding potential of −100 mV were significantly slower in shark (red) compared with human (black). n = 7, p < 0.0001 for contribution of orthologue identity to series variance, two-way ANOVA with post hoc Bonferroni test.
d. Representative OFF gating current (QOFF) kinetics during repolarization in 10mV increments following a 40mV prepulse. Arrow indicates when deactivation rates were measured and purple traces show deactivation at −50 mV.
e. QOFF kinetics were significantly faster in shark (red) compared with human (black). n = 11, p < 0.0001 for contribution of orthologue identity to series variance, two-way ANOVA with post hoc Bonferroni test.
f. Gating currents recorded in HEK293 cells expressing nonconductive shark (red) or human (black) KV1.3 following decreasing voltage pulses in increments of 10mV from a holding potential of 0 mV. Scale bars, 500 pA, 25 ms.
g. Average charge (Q)-V relationships of downward voltage sensor movement (QOFF) in response to decreasing voltage pulses from a holding potential of 0 mV. Shark KV1.3 Va1/2 was −61.6 ± 1.9 mV and human KV1.3 Va1/2 was −110.9 ± 1.01 mV. n = 7, p < 0.0001 for contribution of orthologue identity to series variance, two-way ANOVA with post hoc Bonferroni test.
h. QOFF kinetics of voltage sensor deactivation from a holding potential of 0 mV were significantly faster in shark (red) compared with human (black). n = 7, p < 0.0001 for contribution of orthologue identity to series variance, two-way ANOVA with post hoc Bonferroni test.
All data represented as mean ± s.e.m.
i. Ion tail currents (indicating channel closure) deactivated faster in shark (red) compared with human (black) KV1.3. Tail currents were measured at −100mV following a series of activating voltage pulses that increased in 10mV increments. Inset: Arrows indicate when tail currents were measured following activating voltage pulses. Representative of n = 10. τ for deactivation from 60 mV pulse: shark = 1.5 ± 0.1ms, human = 5.5 ± 0.4ms. p < 0.0001, two-tailed Student’s t-test.
Extended Data Figure 6. Shark KV voltage sensor domain relaxation.
a. QOFF kinetics following either 10 ms or 1 ms 40 mV activating prepulses. Purple traces indicate deactivation at −50 mV. Arrow indicates when current properties were measured during voltage protocol.
b. Average QOFF kinetics were faster in shark (red) compared with human (black) during deactivation following 40mV prepulses of 25, 10, or 5 ms duration, but were of similar rates following 1ms activating prepulses. Kinetics were measured at voltages that decreased in 10mV increments from 40mV. n = 9, p < 0.0001 for contribution of orthologue identity to series variance at 25, 10, or 5 ms, but no significant difference was observed at 1 ms, two-way ANOVA with post hoc Bonferroni test.
c. Shark KV1.3 QOFF kinetics were relatively unaffected by activating voltage pulse duration while human KV1.3 entered a proposed ‘relaxed’ state resulting in slowing of QOFF with increasing pulse length. Deactivation was measured at −100 mV following a series of 40 mV voltage pulses of varying duration from 0.5 ms to 30 ms.
d. Average QOFF kinetics in response to indicated voltage pulse lengths. n = 6, p < 0.0001 for comparison of orthologue QOFF kinetics following a 30ms voltage pulse.
e. Hypothetical model of shark and human KV1.3. Compared with its human orthologue, shark KV1.3 exhibits reduced voltage sensor domain relaxation, which stabilizes pore opening in human KV1.3. Reduced voltage sensor relaxation is indicated by dotted lines to suggest that this state(s) may occur to a lesser extent in the shark orthologue. Thus, compared with human KV1.3, the shark orthologue requires relatively less repolarizing voltage to more quickly return to a resting/closed state.
All data represented as mean ± s.e.m.
Extended Data Figure 7. Shark-human KV chimeric analyses.
a. Chimeric shark-human KV1.3 channels reveal that Shark KV S1–S6 confers differences in activation voltage threshold, deactivation kinetics, and inactivation. (Top) Chimera constructs analyzed (shark in red, human in black). (Middle) Arrow indicates when voltage activated currents were measured at −30mV following a series of voltage pulses that increased in 10mV increments from −100mV. (Bottom) Arrow indicates when inactivation was measured during 40mV pulses following a series of prepulses that increased in 10 mV increments from −100mV.
b. Compared with WT human KV, average G–V relationships for WT shark, shark (s)S1–S6, and sS1–S4 channels were similarly shifted to positive voltages with more gradual slopes and deactivation kinetics were faster. Va1/2 (mV) for WT human = −30.7 ± 0.5mV, slope factor (Ka) = 4.7 ± 0.5mV; WT shark Va1/2 = −5.4 ± 0.5mV, Ka = 7.6 ± 0.4mV; sS1S6 Va1/2 = −9.7 ± 0.7mV, Ka = 8.1 ± 0.6mV; sS1S4 Va1/2 = −6.5 ± 0.7mV, Ka = 10.7 ± 1.2mV. Average deactivation kinetics of WT shark, sS1–S6, and sS1–S4 KV channels were faster than WT human channels. Substitution of human (h)S1–S6 or hS1–S4 into the shark KV channel also partially shifted activation threshold and deactivation kinetics. Channels containing hS5–S6 exhibited the strongest voltage-dependent inactivation, nearly as efficient as WT human KV, while channels containing sS5–S6 displayed weaker inactivation. sS1–S4 had a smaller effect on inactivation. Vh1/2 for WT human = −34.6 ± 0.9mV, WT shark = 0.1 ± 2.8mV, hS1S6 = −18.3 ± 0.4mV, hS1S4 = −12.3 ± 1.2mV, sS1S6 = −9.2 ± 0.8mV, sS1S4 = −16.0 ± 0.9mV. n = 9 WT shark, 9 WT human, 9 hS1S6, 9 hS1S4, 9 sS1S6, 7 sS1S4.
c. Currents elicited from the indicated S5–S6 chimeric channels in response to voltage protocols to access voltage-dependence for activation and inactivation.
d. sS5–S6 reduces voltage-dependent inactivation and hS5–S6 partially confers strong voltage-dependent inactivation in shark channels. n = 6. p < 0.0001 for hS5S6 versus sS5S6 or WT shark, sS5S6 versus hS5S6 or WT human, two-way ANOVA with post hoc Tukey test.
e. (Top) S5–S6 substitution did not greatly affect voltage-dependent activation. n = 6 hS5S6, 7 sS5S6. (Bottom) S5–S6 substitution did not affect deactivation kinetics. n = 7 hS5S6, 9 sS5S6.
All data represented as mean ± s.e.m.
Extended Data Figure 8. Electrosensory cell ribbon synapse characteristics.
a. (Left) Five highest expressed transcripts in shark ampullae. The Ca2+-binding protein parvalbumin 8 is the most highly expressed and is enriched in ampullae compared with other examined tissues. (Right) Five highest expressed ATPase transcripts in shark ampullae. A plasma membrane Ca2+ ATPase is highly expressed and enriched in ampullae. Bars represent fragments per kilobase of exon per million fragments mapped (FPKM).
b. Expression of transcripts associated with ribbon synapses in shark and skate ampullae. Expression of vGluT3 and EAAT1 suggests that the synapse could be glutamatergic.
c. Transmission electron micrograph of skate ribbon synapse with arrows indicating electrosensory cell, synaptic ribbon, and afferent nerve terminal. Distinct vesicular pools are colored: attached to ribbon (blue), refilling (green), readily releasable (yellow). An orange dotted line indicates the 150nm region in which the readily releasable pool was quantified. Scale bar 500nm.
d. Quantification of attached vesicles, ribbon vesicle density, ribbon shape variation, and vesicle diameter was similar between shark and skate electrosensory cells. The readily releasable pool, quantified by number of vesicles 150nm from the synapse, was significantly larger in shark versus skate electrosensory cells. n = 18, p < 0.0001, two-tailed Student’s t-test. The refilling pool density, quantified as detached cytosolic vesicles, was also significantly larger in shark electrosensory cells. 20 shark and 21 skate, p < 0.0001, two-tailed Mann-Whitney test. Shark ribbons were more parallel to the plasma membrane in comparison to skate ribbons that were often more perpendicular. For angle quantification n = 20 shark and 21 skate ribbons, p < 0.0001, two-tailed Mann-Whitney test.
All data represented as mean ± s.e.m.
Extended Data Figure 9. Shark electrosensory cell vesicular release characteristics.
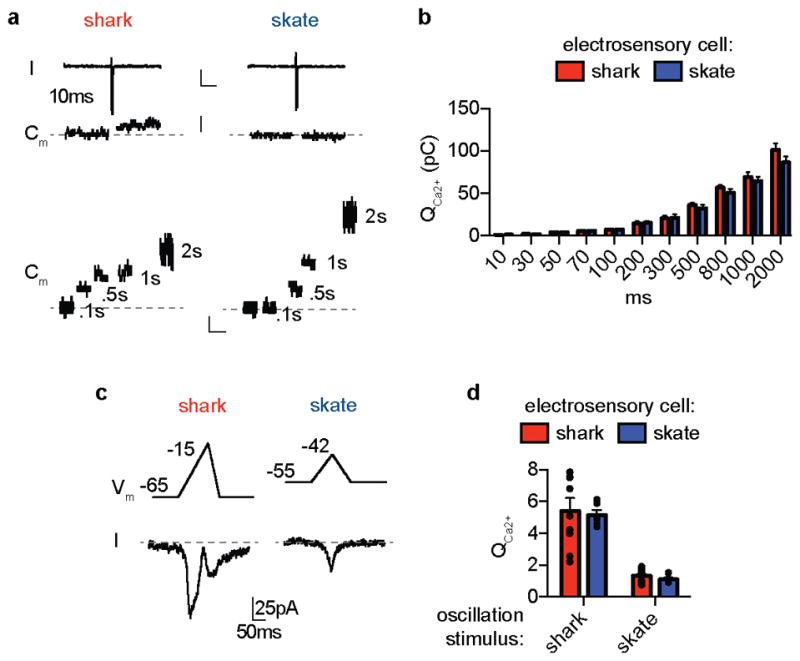
a. (Top) Currents and capacitance changes in response to a 10ms −20mV voltage pulse in shark and skate electrosensory cells. Scale bars, 50pA, 200ms. (Bottom) Representative capacitance changes in response to the indicated durations of a −20mV voltage stimulus. Scale bars, 25fF, 200ms.
b. −20mV voltage pulses of various durations induced similar integrated ICaV (QCa2+) in shark or skate electrosensory cells. n = 6.
c. ICaV elicited by simulated voltage spikes in shark electrosensory cells and smaller voltage oscillations in skate cells. K+ currents were blocked by intracellular Cs+, extracellular 4-AP and IbTx.
d. Voltage-clamp protocols made to simulate shark electrosensory cell spiking induced the same amount of QCa2+ in shark or skate cells. Similarly, voltage protocols that simulated smaller skate electrosensory cell voltage oscillations induced the same amount of QCa2+ in shark or skate cells. QCa2+ elicited by simulated voltage spikes was larger than QCa2+ elicited by simulated oscillations. n = 10 for shark and 5 for skate.
All data represented as mean ± s.e.m.
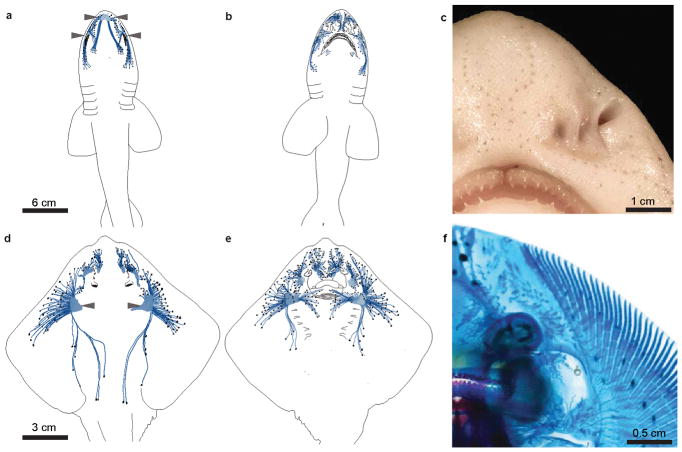
Extended Data Figure 10. Schematic representation of distribution of ampullae of Lorenzini in two elasmobranch species.
a. Chain catshark (S. retifer) dorsal surface, with black dots corresponding to individual ampullary pores and blue lines representing canal structures. The buccal and supraorbital clusters from which electrosensory cells were obtained are indicated with arrowheads. This schematic was prepared based on photographs of 4 individual fish.
b. Ventral surface from catshark.
c. Example photograph of ampullary pores, visible on the ventral rostrum of adult catshark.
d. Little skate (L. erinacea) dorsal surface. The hyoid capsules from which electrosensory cells were obtained are indicated with arrowheads. This schematic was prepared based on photographs of 4 individual fish.
e. Ventral surface from skate.
f. Example photograph of cleared Alcian blue-stained skate, revealing the ampullary canals from the ventral surface of skate.
Supplementary Material
A juvenile catshark (S. retifer) in the behavioral observation tank, showing distinct rhythmic movement of gill slits. The frequency of these movements was recorded in responses to environmental electrical and food odorant stimuli.
A juvenile little skate (L. erinacea) in the behavioral observation tank, showing distinct movement of spiracle, posterior to the eye. The frequency of these movements was recorded in responses to environmental electrical and food odorant stimuli.
Acknowledgments
We thank S. Bennett from the MBL for supplying animals, J. Wong from the Gladstone/UCSF TEM core for performing electron microscopy, A. Zimmerman for help with capacitance measurements, discussion, and critical reading of the manuscript, R. Edwards for helpful discussion, and R. Nicoll for helpful input on the manuscript. This work was supported by a NIH Institutional Research Service Award to the UCSF CVRI (T32HL007731 to NWB), a Howard Hughes Medical Institute Fellowship of the Life Sciences Research Foundation (NWB), a Simons Foundation Postdoctoral Fellowship to the Jane Coffin Childs Memorial Fund (DBL), and grants from the NIH (1K99DC016658 to DBL, K99DK115879 to NWB, and NS055299 and NS105038 to DJ).
Footnotes
Author Contributions: N.W.B. designed and performed electrophysiological studies, D.B.L. designed and performed gene expression, anatomical, and behavioral studies, and N.W.B., D.B.L. and D.J. wrote the manuscript.
The authors declare no competing financial interests.
References
- 1.Josberger EE, et al. Proton conductivity in ampullae of Lorenzini jelly. Sci Adv. 2016;2:e1600112. doi: 10.1126/sciadv.1600112. [DOI] [PMC free article] [PubMed] [Google Scholar]
- 2.Clusin WT, Bennett MV. The oscillatory responses of skate electroreceptors to small voltage stimuli. The Journal of General Physiology. 1979;73:685–702. doi: 10.1085/jgp.73.6.685. [DOI] [PMC free article] [PubMed] [Google Scholar]
- 3.Teeter JH, Bennett MVL. Synaptic Transmission in the Ampullary Electroreceptor of the Transparent Catfish, Kryptopterus. J Comp Physiol. 1981;142:371–377. [Google Scholar]
- 4.Kalmijn AJ. The electric sense of sharks and rays. The Journal of Experimental Biology. 1971;55:371–383. doi: 10.1242/jeb.55.2.371. [DOI] [PubMed] [Google Scholar]
- 5.Sisneros JA, Tricas TC. Neuroethology and life history adaptations of the elasmobranch electric sense. Journal of Physiology, Paris. 2002;96:379–389. doi: 10.1016/S0928-4257(03)00016-0. [DOI] [PubMed] [Google Scholar]
- 6.Bellono NW, Leitch DB, Julius D. Molecular basis of ancestral vertebrate electroreception. Nature. 2017;543:391–396. doi: 10.1038/nature21401. [DOI] [PMC free article] [PubMed] [Google Scholar]
- 7.King BL, Shi LF, Kao P, Clusin WT. Calcium activated K(+) channels in the electroreceptor of the skate confirmed by cloning. Details of subunits and splicing. Gene. 2016;578:63–73. doi: 10.1016/j.gene.2015.12.010. [DOI] [PMC free article] [PubMed] [Google Scholar]
- 8.Kubota T, Correa AM, Bezanilla F. Mechanism of functional interaction between potassium channel Kv1.3 and sodium channel NavBeta1 subunit. Scientific Reports. 2017;7 doi: 10.1038/srep45310. ARTN 45310. [DOI] [PMC free article] [PubMed] [Google Scholar]
- 9.Labro AJ, Lacroix JJ, Villalba-Galea CA, Snyders DJ, Bezanilla F. Molecular mechanism for depolarization-induced modulation of Kv channel closure. Journal of General Physiology. 2012;140:481–493. doi: 10.1085/jgp.201210817. [DOI] [PMC free article] [PubMed] [Google Scholar]
- 10.Hoshi T, Armstrong CM. C-type inactivation of voltage-gated K+ channels: pore constriction or dilation? The Journal of General Physiology. 2013;141:151–160. doi: 10.1085/jgp.201210888. [DOI] [PMC free article] [PubMed] [Google Scholar]
- 11.Sejnowski TJ, Yodlowski ML. A freeze-fracture study of the skate electroreceptor. J Neurocytol. 1982;11:897–912. doi: 10.1007/BF01148307. [DOI] [PubMed] [Google Scholar]
- 12.Fields RD, Ellisman MH. Synaptic morphology and differences in sensitivity. Science. 1985;228:197–199. doi: 10.1126/science.3975637. [DOI] [PubMed] [Google Scholar]
- 13.Nouvian R, Beutner D, Parsons TD, Moser T. Structure and function of the hair cell ribbon synapse. The Journal of Membrane Biology. 2006;209:153–165. doi: 10.1007/s00232-005-0854-4. [DOI] [PMC free article] [PubMed] [Google Scholar]
- 14.Matthews G, Fuchs P. The diverse roles of ribbon synapses in sensory neurotransmission. Nature reviews. Neuroscience. 2010;11:812–822. doi: 10.1038/nrn2924. [DOI] [PMC free article] [PubMed] [Google Scholar]
- 15.Graydon CW, Cho S, Li GL, Kachar B, von Gersdorff H. Sharp Ca2+ Nanodomains beneath the Ribbon Promote Highly Synchronous Multivesicular Release at Hair Cell Synapses. Journal of Neuroscience. 2011;31:16637–16650. doi: 10.1523/Jneurosci.1866-11.2011. [DOI] [PMC free article] [PubMed] [Google Scholar]
- 16.Hille B. Ion channels of excitable membranes. 3. Sinauer; 2001. [Google Scholar]
- 17.Peters RC, Evers HP. Frequency-Selectivity in the Ampullary System of an Elasmobranch Fish (Scyliorhinus-Canicula) Journal of Experimental Biology. 1985;118:99–109. [Google Scholar]
- 18.Kempster RM, Hart NS, Collin SP. Survival of the Stillest: Predator Avoidance in Shark Embryos. PloS One. 2013;8 doi: 10.1371/journal.pone.0052551. ARTN e52551. [DOI] [PMC free article] [PubMed] [Google Scholar]
- 19.Montgomery JC, Bodznick D. Signals and noise in the elasmobranch electrosensory system. Journal of Experimental Biology. 1999;202:1349–1355. doi: 10.1242/jeb.202.10.1349. [DOI] [PubMed] [Google Scholar]
- 20.Fettiplace R, Fuchs PA. Mechanisms of hair cell tuning. Annu Rev Physiol. 1999;61:809–834. doi: 10.1146/annurev.physiol.61.1.809. [DOI] [PubMed] [Google Scholar]
- 21.Rutherford MA, Roberts WM. Spikes and membrane potential oscillations in hair cells generate periodic afferent activity in the frog sacculus. The Journal of Neuroscience. 2009;29:10025–10037. doi: 10.1523/JNEUROSCI.1798-09.2009. [DOI] [PMC free article] [PubMed] [Google Scholar]
- 22.Modrell MS, et al. Insights into electrosensory organ development, physiology and evolution from a lateral line-enriched transcriptome. eLife. 2017;6 doi: 10.7554/eLife.24197. ARTN e24197. [DOI] [PMC free article] [PubMed] [Google Scholar]
- 23.Neiman AB, Russell DF. Two distinct types of noisy oscillators in electroreceptors of paddlefish. J Neurophysiol. 2004;92:492–509. doi: 10.1152/jn.00742.2003. [DOI] [PubMed] [Google Scholar]
- 24.Baker CA, Huck KR, Carlson BA. Peripheral sensory coding through oscillatory synchrony in weakly electric fish. eLife. 2015;4 doi: 10.7554/eLife.08163. ARTN e08163. [DOI] [PMC free article] [PubMed] [Google Scholar]
- 25.Meyer JH, Zakon HH. Androgens alter the tuning of electroreceptors. Science. 1982;217:635–637. doi: 10.1126/science.217.4560.635. [DOI] [PubMed] [Google Scholar]
- 26.Sisneros JA, Tricas TC, Luer CA. Response properties and biological function of the skate electrosensory system during ontogeny. J Comp Physiol A. 1998;183:87–99. doi: 10.1007/s003590050237. [DOI] [PubMed] [Google Scholar]
- 27.Gillis JA, Dahn RD, Shubin NH. Chondrogenesis and homology of the visceral skeleton in the little skate, Leucoraja erinacea (Chondrichthyes: Batoidea) J Morphol. 2009;270:628–643. doi: 10.1002/jmor.10710. [DOI] [PubMed] [Google Scholar]
- 28.Sigg D, Stefani E, Bezanilla F. Gating Current Noise Produced by Elementary Transitions in Shaker Potassium Channels. Science. 1994;264:578–582. doi: 10.1126/science.8160016. [DOI] [PubMed] [Google Scholar]
- 29.Yang YS, Yan YY, Sigworth FJ. How does the W434F mutation block current in Shaker potassium channels? Journal of General Physiology. 1997;109:779–789. doi: 10.1085/jgp.109.6.779. [DOI] [PMC free article] [PubMed] [Google Scholar]
- 30.Ishii T, Omura M, Mombaerts P. Protocols for two- and three-color fluorescent RNA in situ hybridization of the main and accessory olfactory epithelia in mouse. J Neurocytol. 2004;33:657–669. doi: 10.1007/s11068-005-3334-y. [DOI] [PubMed] [Google Scholar]
- 31.Kantardzhieva A, Liberman MC, Sewell WF. Quantitative analysis of ribbons, vesicles, and cisterns at the cat inner hair cell synapse: correlations with spontaneous rate. J Comp Neurol. 2013;521:3260–3271. doi: 10.1002/cne.23345. [DOI] [PMC free article] [PubMed] [Google Scholar]
Associated Data
This section collects any data citations, data availability statements, or supplementary materials included in this article.
Supplementary Materials
A juvenile catshark (S. retifer) in the behavioral observation tank, showing distinct rhythmic movement of gill slits. The frequency of these movements was recorded in responses to environmental electrical and food odorant stimuli.
A juvenile little skate (L. erinacea) in the behavioral observation tank, showing distinct movement of spiracle, posterior to the eye. The frequency of these movements was recorded in responses to environmental electrical and food odorant stimuli.
Data Availability Statement
Deep sequencing data are archived under GEO accession number GSE103977. The GenBank accession numbers for the α subunit are: CaV1.3 MF959522, KV1.3 MF959523, and BK MF959524. Other data are available from the authors upon request.


