

Abstract
In vitro and in vivo pre-clinical screening of novel therapeutic agents are an essential tool in cancer drug discovery. Although human cancer cell lines respond to therapeutic compounds in 2D (dimensional) monolayer cell cultures, 3D culture systems were developed to understand the efficacy of drugs in more physiologically relevant models. In recent years, a paradigm shift was observed in pre-clinical research to validate the potency of new molecules in 3D culture systems, more precisely mimicking the tumor microenvironment. These systems characterize the disease state in a more physiologically relevant manner and help to gain better mechanistic insight and understanding of the pharmacological potency of a given molecule. Moreover, with the current trend in improving in vivo cancer models, zebrafish has emerged as an important vertebrate model to assess in vivo tumor formation and study the effect of therapeutic agents. Here, we investigated the therapeutic efficacy of hydroxycoumarin OT48 alone or in combination with BH3 mimetics in lung cancer cell line A549 by using three different 3D culture systems including colony formation assays (CFA), spheroid formation assay (SFA) and in vivo zebrafish xenografts.
Keywords: Cancer Research, Issue 136, Zebrafish, tumor xenograft, 3D culture system, spheroids, colony formation, cell tracker-stained cancer cell injection
Introduction
Cancer is caused by cellular mutations and as a consequence biochemical signaling pathways are disrupted triggering uncontrolled cell division and resistance to cell death. Tumors interfere with physiological functions of digestive, nervous, circulatory systems and subsequently neighboring tissues1. Despite extensive research efforts, cancer remains the most prevalent life-threatening disease in the world2. Precision medicine has been recognized as the foundation of future cancer therapeutics. New molecular entities are tested routinely in combination with existing drugs to improve clinical outcome.
However, one of the significant limitations associated with the development of new efficient targeted therapies is the failure of commonly used assays to simulate the exact biological outcome of drug exposure3. Cancer drug discovery still mostly relies on testing the efficacy of therapeutic agents in cancer cell lines cultured in 2D monolayer cultures, which are difficult to validate in clinical trials4. Therefore, there is a growing interest to develop better cancer models that better mimic the native features of tumors in vivo5. In recent years, an increasing interest in 3D culture models resulted in the development of improved methodologies to produce 3D tumor models5.
Here, we present an approach with three different 3D cell culture techniques allowing to improve the understanding of the potency of the hydroxycoumarin OT486 in combination with BH3 mimetics before more in depth in vivo assays. Our method consists of combining colony and SFAs with an in vivo tumor formation test based on a zebrafish model to further validate the efficacy of the combination of OT48 and BH3 mimetics in lung cancer cells and monitor cancer progression in a living organism.
Colony formation assays are routinely used to assess efficacy of anticancer agents for both solid as well as hematopoietic cancers. The assay determines the ability of a cell to proliferate indefinitely and form colonies7. The effect of an anticancer agent on the colony forming ability of cells is determined by decrease of the number and/or size of the colonies.
Spheroids represent in vitro tumor models and serve as a low-cost screening platform for anticancer agents. Spheroids are aggregates of cells growing in suspension or embedded in a 3D matrix. This approach is widely used for drug screening and studies of tumor growth, proliferation and immune interaction8.
To fully understand the properties of a new drug, it is essential to conduct in vivo experiments on rodents. However, this conventional method is expensive and time consuming. In recent years, zebrafish (Danio rerio) became a widely studied laboratory organism that is cheaper and faster to raise. Tumors developed in the zebrafish represent a 3D cell culture approach but within the in vivo setting of a vertebrate9.
Altogether, we use here three different 3D culture approaches including CFAs, SFAs and zebrafish in vivo tumor formation to demonstrate the anticancer capacity of hydroxycoumarin OT48 in a lung cancer A549 cell model in combination with BH3 mimetics.
Protocol
1. Colony Formation Assays
Culture A549 cells at a concentration of 20,000 cells/cm2 in 15 mL of RPMI1640 cell culture medium supplemented with 10% FBS (Fetal Bovine Serum) and 1% antibiotics in a 75 cm2 flask in a CO2 incubator at 37 °C and 5% CO2.
On the day of the experiment, determine the cell concentration by using a hemocytometer. Collect 50,000 cells by centrifugation at 400 x g for 7 min in a 1.5 mL microcentrifuge tube and re-suspend cells in 100 µL of 1x sterile PBS (Phosphate Buffered Saline) in 1.5 mL tubes.
Dispense 1.1 mL of semi-solid methylcellulose-based medium (MCBM) in 15 mL tubes with a multipipette. Prepare one tube for each condition.
Add 110 µL of FBS to 1.1 mL of MCBM using a P200 micropipette.
Seeds cells at 1,000 cells/mL. Collect 2.4 µL of cell suspension from the stock solution (50,000 cells in 100 µL of 1x PBS) using a P2 micropipette and add to 1.1 mL of MCBM supplemented with 10% FBS.
After adding the cells, vortex the tubes for 1 min, holding them vertically at the highest speed to mix MCBM and cells well.
Add test compounds (OT48 alone or in combination with A1210477). Prepare a separate tube as a control for the solvent used (here dimethyl sulfoxide (DMSO)). Depending on the concentration of the compounds and the volume added for each condition, the solvent control will include the highest concentration of solvent used for the dilutions of the test compound, to assess for adverse effects caused by the solvent.
Vortex tubes for 1 minute.
For each assay, add 1 mL of the mixture with a P1000 micropipette to the center well of a 12-well cell culture plate.
Fill empty wells with 1 mL of sterile water or 1x PBS to stabilize humidity.
Incubate culture plates for 10 days in an incubator at 37 °C and 5% CO2.
After 10 days of incubation, add 200 µL of an MTT (methylthiazolyldiphenyl-tetrazolium bromide) stock solution (5 mg/mL) to each well to reach a final concentration of 1 mg/mL.
Incubate 10 min in an incubator at 37 °C and 5% CO2. Viable colonies will turn violet.
Capture the image using a digital camera using the white background plate (LAS white dia tray). Use the following settings: Method, digitize; Exposure type, precision; Exposure time, manual, 1 second; Sensitivity/resolution, high resolution. Save the image in tiff format.
Quantify viable colonies by using ImageJ software. Select menu "Image | Type | 8 bit". Select menu "Adjust | Threshold". Set threshold to control and keep constant for all conditions; Select menu "Analyze | Analyze Particles". Save data and analyze with a statistics software for graphical representation.
2. Spheroid Formation Assay
Culture A549 cells at a concentration of 20,000 cells/cm2 in 75 cm2 flasks with 15 mL of RPMI 1640 medium supplemented with 10% FBS and 1% antibiotics.
On the day of the experiment, prepare a 96 well U-bottom plate.
Plate 10,000 cells into a well which already contains the compound of interest (here 50 µM of OT48 and/or 20 µM of A1210477). Adjust the final volume to 100 µL of cell culture medium. The number of cells that form uniform spheroids with an intact outer boundary is considered adequate to form spheroids.
Incubate for 3 days in an incubator at 37 °C and at 5% CO2.
After 3 days of incubation, capture images of the spheroids using a light microscope with 4x magnification.
3. Zebrafish Xenograft Assay
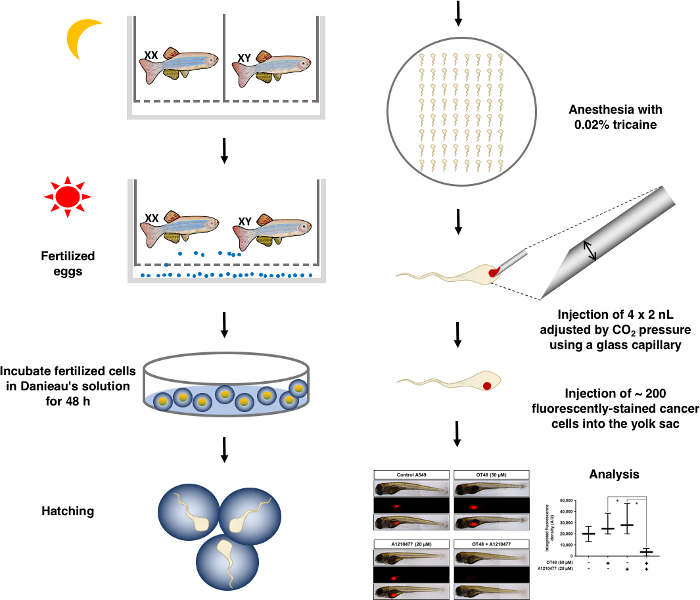
NOTE: This technical approach is visualized as a schematic (Figure 1).
- Preparation of stock reagents
- Prepare 1 L of 30x Danieau’s solution: 1740 mM NaCl, 21 mM KCl, 12 mM MgSO4∙7H2O, 18 mM Ca(NO3)2, and 150 mM HEPES. Adjust to the pH of the buffer to 7.6 using a pH meter.
- Prepare 1% (50x) tricaine solution: Dissolve 20 mg of ethyl 3-aminobenzoate methanesulfonate (tricaine) in 2 mL of distilled water.
- Prepare 1% phenol Red-PBS solution: Add 2 µL of Phenol Red sodium salt solution to 198 µL of sterilized PBS solution in a 1.5 µL tube.
- Prepare 3% methylcellulose: Add 3 g of methylcellulose to 100 mL of 1x Danieau’s solution.
- Zebrafish egg production and incubation
- Separate one female and one male zebrafish in a partition tank filled with UV-sterilized and filtered tap water at 28.5 °C in the dark. After 24 h of separation, mix fish of both genders to initiate mating. Transfer fertilized eggs from the mating tank to a Petri dish containing 5 mL of fresh Danieau’s solution.
- Wash eggs three times with 5 mL of Danieau’s solution. For the washing, carefully aspirate the eggs with a pipette and transfer to 5 mL of fresh solution. Incubate for 8 h at 28.5 °C.
- After 8 h of incubation in Danieau's solution, change to Danieau's solution containing 0.03% 1-phenyl-2-thiourea (PTU) to inhibit pigmentation. Sort out opaque eggs (unfertilized or containing undeveloped embryos) to prevent contamination.
- Embryo dechorionation
- 24 h post fertilization (hpf), dechorionate zebrafish embryos using sharp forceps. Incubate hatching embryos in Danieau’s solution with 0.03% PTU at 28.5 °C until 48 hpf.
- Compound-treated cell preparation
- Seed A549 cells at 20,000 cells/cm2 in 25 cm2 culture flasks. After 24 h of seeding, add compounds (here OT48 at 50 µM and and/or A1210477 at 20 µM) for 24 h in an incubator at 37 °C and 5% CO2. Set up the treatment time for each compound to maintain the viability of the cells but to commit them towards cell death. This time point needs to be individually set up based on cell viability, morphology and molecular markers.
- 2 h before the end of the treatment, stain cells with 4 µM of fluorescent cell tracker dye CM-Dil at 37 °C and 5% CO2. After 2 h of incubation, trypsinize cells with 0.05% trypsin-EDTA, and dilute 106 cells in 50 µL of phenol Red-PBS solution prior to injection.
- Micro-injection of cancer cells for xenograft formation
- Anesthetize zebrafish in a 0.02% tricaine solution for 5 min until they settle down on an agar plate.
- Pull a 1.0 mm (outside diameter (OD) glass capillary) by a micropipette puller (Program settings: P: 300, Heat: 260, Pull: 60, VEL: 50, and Time: 200). Cut the microcapillary with a syringe to produce a sharp edge. Load microcapillaries with 20 µL of cell/phenol Red-PBS solution. Set injection pressure and time to dispense 2 nL per injection.
- Inject 100–200 cells into the yolk sac by injecting 6 to 10 nL via 3 to 5 injections. After injection, allow fish to recover for 10 to 30 min in 5 mL of fresh Danieau’s solution containing PTU solution. Dispatch fish in 24-well plates with 1 mL of Danieau's solution containing PTU solution are and incubate for 72 h at 28.5 °C.
- After 72 h of incubation, anesthetize fish in a 0.02% tricaine solution and immobilize on a glass slide with a drop of 3% methylcellulose. Take 5x pictures by fluorescence microscopy at a wavelength of 620 to 750 nm.
- Quantify the size of fluorescent tumors by ImageJ software. Select menu "Analyze | Measure". Save values corresponding to the fluorescent signal and analyze with a statistics software for graphical representation.
Representative Results
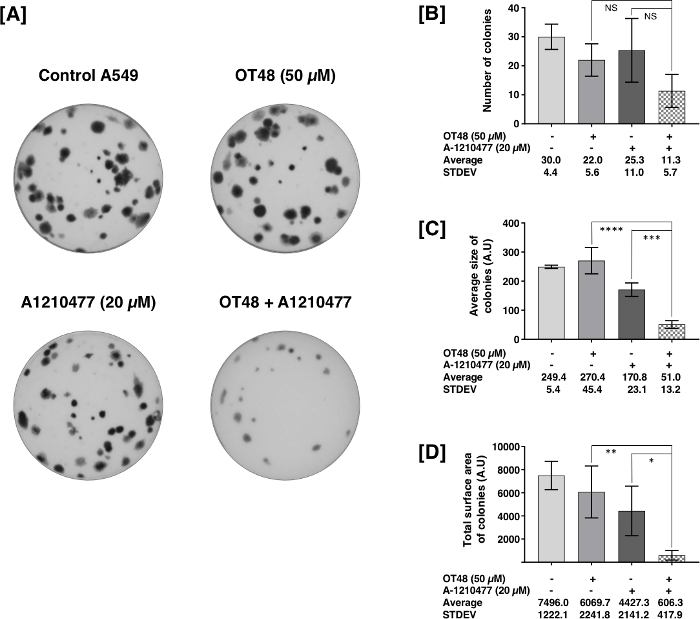
In Figure 2, lung cancer cell line A549 was seeded in MCBM to form colonies after treatment with OT48 alone or in combination with BH3 mimetic A1210477 at the indicated concentrations. The results showed that the combination significantly reduced number, size and total surface area of the colonies after 10 days of incubation.
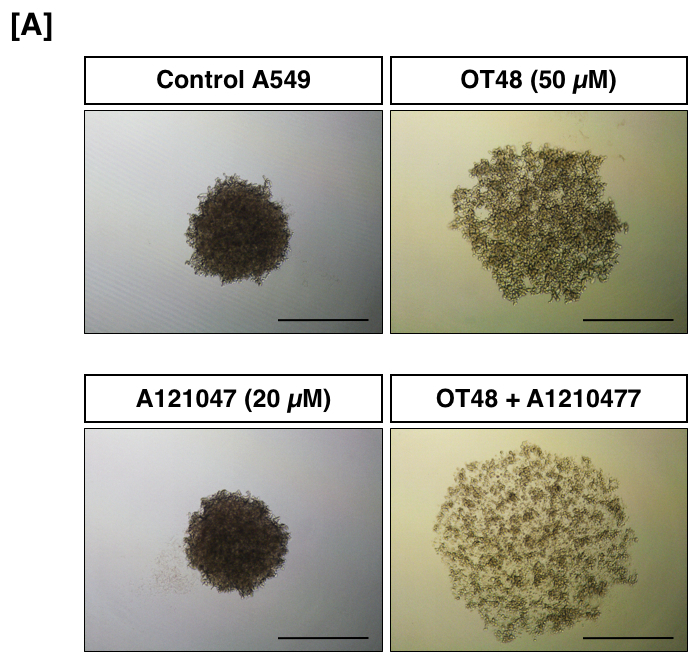
In Figure 3, A549 cells were treated with OT48 alone or in combination with BH3 mimetic A1210477 and were allowed to form spheroids by the U-bottom plate technique. After 3 days of incubation, images of spheroids were taken. Quantification of the spheroids was done using Image J and 3D images were generated.
In Figure 4, A459 cells were treated with OT48 alone or in combination with BH3 mimetic A1210477 for 24 h and injected in the zebrafish yolk sac. After 72 h, quantification of fluorescent tumors correlates to the inhibitory potential of the compound.
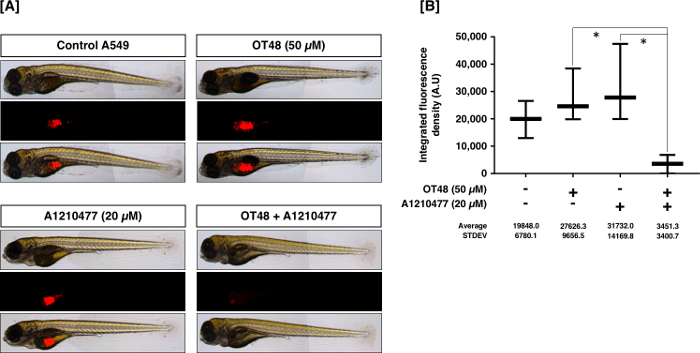
Figure 1: Schematic diagram of the overall process of the zebrafish xenograft assay. Please click here to view a larger version of this figure.
Figure 2: Synergistic Inhibition of A549 colony formation by hydroxycoumarin OT48 and BH-3 mimetic A1210477. (A) Images of an A549 colony formation assay treated with 50 µM of OT48 and/or 20 µM of A1210477. (B-D) Quantification of the number, average size, and total surface area of colonies. Experiments were realized in triplicate. Post hoc analyses were performed. Statistical significances were evaluated at p-values below 0.05 and represented by the following legend: *p ≤0.05, **p ≤0.01, ***p ≤0.001, ****p ≤0.0001; post hoc analyses Dunnett; Sidak). All histograms represent the mean ± SD of at least three independent experiments. Please click here to view a larger version of this figure.
Figure 3: Effect of OT48 and/or A1210477 on the capacity of A549 cells to form spheroids. Images of A549 tumor spheroids after 3 days.
Figure 4: Inhibition of A549 tumor mass formation by a compound. (A) Pictures are showing the inhibitory effect of the OT48 and/or A1210477 on the tumor forming capacity of CM-Dil-stained A549 cells. (B) Quantification of tumor formation. Post hoc analyses were performed. Statistical significances were evaluated at p-values below 0.05 and represented by the following legend: *p ≤0.05, **p ≤0.01, ***p ≤0.001, ****p ≤0.0001; post hoc analyses Dunnett; Sidak). All histograms represent the mean ± SD of at least ten independent experiments. Please click here to view a larger version of this figure.
Discussion
The rates of colony formation obtained with MCBM depends on the cell type. Usually, for non-adherent cells, the number of colonies is much higher compared to adherent cells. We observed that A549 cells formed 30 to 40 colonies after 10 days. Previously we have reported for different leukemia cells that number of colonies is between 200 to 2509. Our results showed that OT48 alone did not produce a significant decrease of the number of colonies alone. However, in combination with BH3 mimetic A1210477 colony forming ability of A549 cells was synergistically reduced. Previously we reported that another hydroxycoumarin derivative OT52 also synergized with BH3 mimetics to inhibit the colony forming ability of A549 cells. The suggested seeding concentration may vary from 1 x 10³ to 1.5 x 10³. CFA using MethoCult is a valuable technique routinely used for measuring tumorigenesis in various cancer cell lines, but it has some limitations. Often the recovery of viable colonies after the experiment is inconvenient, and cells do not grow well once isolated from MCBM and seeded in RPMI1640 medium. Nevertheless, it is a well-accepted pre-clinical technique to better understand the mechanism of cancer progression in a 3D environment. The 3D growth conditions accurately represent the natural environment of tumor formation in an in vivo setting. However, this method is slow, labor intensive and not suitable for high throughput screening10.
SFAs are performed with adherent cells and gained wide popularity in cancer drug discovery as they exhibit physiological traits such as increased cell survival, tumor morphology and a hypoxic core which are more representative of an in vivo situation11,12. The overall size, texture, and integrity of spheroids obtained by the U-bottom plate technique may vary between cell lines. Moreover, the starting concentration of cells used to form spheroids may also influence its overall development. Our results showed that OT48 in combination with BH3 mimeticA1210477 inhibited spheroid integrity and reduced spheroid forming ability of A549 cells. Previously we reported inhibition of A549 spheroids by another hydroxycoumarin derivative in combination with BH3 mimetics9. Major advantages of this technique are the reproducibility and cost effectiveness. Other techniques such as the liquid overlay technique are also routinely used to develop 3D spheroids of cancer cells. In this technique cells grow on a non-adherent cell culture dish. The cell clumps are then collected and placed in suspension culture to form spheroids. However, one of the major limitations associated with this technique is the transfer of cell clumps to the suspension culture, which is not well tolerated by various cell lines. To increase the throughput of compound screening such a 3D culture system, some companies are developing specific substrates, low attachment assay plates, and scaffolds improving the formation of 3D structures13. With further technical advances, development of a more representative 3D tumor model will allow a better understanding of the pharmacology of novel compounds for a given type of cancer.
Zebrafish xenografts are considered as the most cost-effective animal assays routinely used for anticancer drug development9,14. We optimized the zebrafish in vivo system with various solid and hematological cancer types as well as with patient-derived cells. There are a number of advantages of using zebrafish for drug screening. In principle, the drugs can be added directly into the water and do not need to be injected. Moreover, this approach also provides information about the ADME (absorption, distribution, metabolism and excretion) properties of a drug candidate. However, one of the major limitations of this technique is some molecules are not water soluble and therefore are not immediately suitable to be investigated by this method. To overcome this limitation, cancer cells were treated with compounds ex vivo to be injected into zebrafish at a stage where cells are committed, nevertheless maintain viability. Our results showed that A549 cells treated with OT-48 or with BH3 mimetic A1210477 alone did not strongly reduce the tumor forming ability of A549 cells compared to a combination of OT48 and A1210477. This observation further validated our in vitro CFA where the combination showed significant anti-cancer effect compared to individual treatments. Altogether, this technique can contribute to rapid screening of drugs in a preclinical setting.
Disclosures
The authors have nothing to disclose.
Acknowledgments
Research at SNU is supported by the National Research Foundation (NRF) by the MEST of Korea for Tumor Microenvironment Global Core Research Center (GCRC) grant, [grant number 2011-0030001]; by the Seoul National University Research Grant and by Brain Korea (BK21) PLUS program.
References
- Giancotti FG. Deregulation of cell signaling in cancer. FEBS Letters. 2014;588(16):2558–2570. doi: 10.1016/j.febslet.2014.02.005. [DOI] [PMC free article] [PubMed] [Google Scholar]
- Knowlton S, Onal S, Yu CH, Zhao JJ, Tasoglu S. Bioprinting for cancer research. Trends in Biotechnology. 2015;33(9):504–513. doi: 10.1016/j.tibtech.2015.06.007. [DOI] [PubMed] [Google Scholar]
- Santo VE, et al. Drug screening in 3D in vitro tumor models: overcoming current pitfalls of efficacy read-outs. Biotechnology Journal. 2017;12(1) doi: 10.1002/biot.201600505. [DOI] [PubMed] [Google Scholar]
- Tanner K, Gottesman MM. Beyond 3D culture models of cancer. Science Translational Medicine. 2015;7(283):283ps289. doi: 10.1126/scitranslmed.3009367. [DOI] [PMC free article] [PubMed] [Google Scholar]
- Haycock JW. 3D cell culture: a review of current approaches and techniques. Methods in Molecular Biology. 2011;695:1–15. doi: 10.1007/978-1-60761-984-0_1. [DOI] [PubMed] [Google Scholar]
- Talhi O, et al. Bis(4-hydroxy-2H-chromen-2-one): synthesis and effects on leukemic cell lines proliferation and NF-kappaB regulation. Bioorganic and Medicinal Chemistry. 2014;22(11):3008–3015. doi: 10.1016/j.bmc.2014.03.046. [DOI] [PubMed] [Google Scholar]
- Franken NA, Rodermond HM, Stap J, Haveman J, van Bree C. Clonogenic assay of cells in vitro. Nature Protocols. 2006;1(5):2315–2319. doi: 10.1038/nprot.2006.339. [DOI] [PubMed] [Google Scholar]
- Katt ME, Placone AL, Wong AD, Xu ZS, Searson PC. In Vitro Tumor Models: Advantages, Disadvantages, Variables, and Selecting the Right Platform. Frontiers in Bioengineering and Biotechnology. 2016;4:12. doi: 10.3389/fbioe.2016.00012. [DOI] [PMC free article] [PubMed] [Google Scholar]
- Lee JY, et al. Cytostatic hydroxycoumarin OT52 induces ER/Golgi stress and STAT3 inhibition triggering non-canonical cell death and synergy with BH3 mimetics in lung cancer. Cancer Letters. 2018;416:94–108. doi: 10.1016/j.canlet.2017.12.007. [DOI] [PubMed] [Google Scholar]
- Rotem A, et al. Alternative to the soft-agar assay that permits high-throughput drug and genetic screens for cellular transformation. Proceedings of the National Academy of Sciences of the United States of America. 2015;112(18):5708–5713. doi: 10.1073/pnas.1505979112. [DOI] [PMC free article] [PubMed] [Google Scholar]
- Spoerri L, Beaumont KA, Anfosso A, Haass NK. Real-Time Cell Cycle Imaging in a 3D Cell Culture Model of Melanoma. Methods in Molecular Biology. 2017;1612:401–416. doi: 10.1007/978-1-4939-7021-6_29. [DOI] [PubMed] [Google Scholar]
- Beaumont KA, Anfosso A, Ahmed F, Weninger W, Haass NK. Imaging- and Flow Cytometry-based Analysis of Cell Position and the Cell Cycle in 3D Melanoma Spheroids. Journal of Visualized Experiments. 2015. p. e53486. [DOI] [PMC free article] [PubMed]
- Lovitt CJ, Shelper TB, Avery VM. Advanced cell culture techniques for cancer drug discovery. Biology (Basel) 2014;3(2):345–367. doi: 10.3390/biology3020345. [DOI] [PMC free article] [PubMed] [Google Scholar]
- Ji S, et al. The dialkyl resorcinol stemphol disrupts calcium homeostasis to trigger programmed immunogenic necrosis in cancer. Cancer Letters. 2018;416:109–123. doi: 10.1016/j.canlet.2017.12.011. [DOI] [PubMed] [Google Scholar]