

Abstract
The unfolded protein response (UPR) in the endoplasmic reticulum (ER) is a highly conserved protein quality control mechanism critical for cells to make survival-or-death decisions under ER stress conditions. However, how UPR sensors are activated remains unclear. Here, we report that ER luminal protein canopy homolog 2 (CNPY2) is released from grp78 upon ER stress. Free CNPY2 then engages protein kinase R-like ER kinase (PERK) to induce expression of the transcription factor C/EBP homologous protein (CHOP), thereby initiating the UPR. Indeed, deletion of CNPY2 blocked the PERK-CHOP pathway and protected mice from UPR-induced liver damage and steatosis. Additionally, CNPY2 is transcriptionally upregulated by CHOP in a forward-feed loop to further enhance the UPR signaling. These findings demonstrate the critical roles of CNPY2 in ER stress, and suggest that CNPY2 is a potential new therapeutic target for UPR-related diseases such as metabolic disorders, inflammation and cancer.
Keywords: CNPY2, PERK, CHOP, unfolded protein response, ER stress, hepatic steatosis
The UPR is activated in response to accumulation of misfolded or unfolded proteins1-4, which plays increasingly recognized roles in protein quality control and cell fate determinations5. UPR mediates cell adaptation and survival in response to protein overload in the secretory pathway by reducing the amount of proteins translocated into the ER lumen, increasing retro-translocation of luminal proteins to the cytosol, degrading ER-targeted proteins, and augmenting the protein-folding capacity of the ER. However, if the attempt to recover from ER stress fails, the UPR will trigger an irreversible cell death program to eliminate the stressed cells6. The basic UPR pathways in mammalian cells consist of three main signaling branches initiated by three primary ER membrane-localized UPR sensors: inositol-requiring 1 alpha (IRE1α), PERK, and activating transcription factor 6 (ATF6). Under normal conditions the luminal portions of these molecular sensors are bound to the abundant ER luminal chaperone grp78 to prevent activation of their downstream events. However, when misfolded or unfolded proteins accumulate in the ER lumen, grp78 dissociates from the stress sensors to chaperone the misfolded or unfolded proteins, leading to activation of the sensors on the ER membrane and initiation of the UPR7,8. Notably, unfolded proteins or lipids may also bind directly to UPR sensors and favor their homo-dimerization and downstream signaling9-11. A key unresolved question is whether grp78 dissociation from these ER sensors alone or binding of misfolded proteins to the sensors are independently sufficient to activate the UPR, or whether additional upstream molecular interactions play essential roles12. A recent study showed that an ER luminal enzyme, protein disulfide isomerase A6 (PDIA6) controls IRE1 activity13. PDIA6 itself is positively regulated by Thioredoxin-interacting protein14 and negatively by MicroRNA-32215, thereby plays important roles in tuning the UPR. Another ER protein, thrombospondin binds to ATF6α and promotes its nuclear translocation16. These evidence suggest that other ER molecules besides grp78, may be required in order to trigger the UPR sensors. In the current work, we show for the first time that the ER protein, CNPY2, regulates the PERK pathway.
RESULTS
Cnpy2 knockout protects multiple cell types against ER stress in vitro and in vivo
CNPY2 is an ER protein belonging to the CNPY family that also contains CNPY1, CNPY3 and CNPY4. These proteins share a conserved 6-Cys pattern characteristic of saposin-like proteins with an ER retention signal at the C-terminus17. The known functions of CNPY2 are limited, however, CNPY2 was reported to positively promote neurite outgrowth by stabilizing myosin regulatory light chain18. It has also been reported to promote angiogenesis and to prevent hypertrophic cardiomyopathy19,20. However, the ER function of CNPY2 hitherto remains unknown. We took a genetic approach to address this question by generating a Cnpy2 knockout (KO, Cnpy2−/−) mouse model (Supplementary Fig. 1a). The deletion of CNPY2 in a variety of organs was confirmed by immunoblotting (Supplementary Fig. 1b). At baseline, Cnpy2 KO mice are slightly and consistently smaller than their WT or Cnpy2 heterozygous (Het) counterparts, however, they do not exhibit developmental defects and are fertile. The KO mice survive beyond 16 months old under specific pathogen-free (SPF) conditions and display a normal liver histology (Supplementary Fig. 1c) with preserved baseline liver function (Supplementary Fig. 1d).
To gain insight into the role of CNPY2 in the UPR, we treated WT and KO mice using a well-defined pharmacological UPR inducer, tunicamycin (Tu), which causes protein misfolding in the ER by blocking N-linked glycosylation and triggers significant hepatic steatosis, a pathophysiological hallmark of ER stress21. Whereas the body weight of Het control mice decreased (by approx. 5%) 24 h post Tu treatment, Cnpy2 KO mice did not exhibit a significant weight loss (Supplementary Fig. 1e). As expected, a key downstream PERK molecule, CHOP, increased significantly in the livers and kidneys of Tu-treated WT and Het mice. In striking contrast, CHOP induction was abrogated in the respective organs of the KO mice (Fig. 1a). Consistent with the known connection between UPR and hepatic steatosis21, significant liver damage and hepatosteatosis were observed histologically by hematoxylin and eosin (H&E) and Oil red O staining respectively in WT and Cnpy2 Het mice, but not KO mice (Fig. 1b). Further, the serum levels of alanine aminotransferase (ALT), a biomarker for liver injury, increased significantly post Tu treatment in Het mice compared to KO mice (Fig. 1c). Of note, WT and Het mice exhibited similar levels of total bilirubin and albumin (data not shown). Interestingly, quantitative RT-PCR analysis showed no significant differences in induction of the spliced form of the Xbp1 transcript (Xbp1s), or its downstream genes Edem1 and Erdj4, regardless of Cnpy2 genotype (Supplementary Fig. 2a,b). To further confirm the protective effect of Cnpy2 KO against ER stress, primary hepatocytes were isolated from WT, Cnpy2 Het and KO mice, and then treated with thapsigargin (TG) (another UPR inducer via inhibition of sarco/endoplasmic reticulum Ca2+ ATPase), Tu, or dimethyl sulfoxide (DMSO) as a control. Cnpy2 deletion protected isolated hepatocytes against TG or Tu-induced cell death (Fig. 1d). This protection was further evidenced by the concomitant diminution upon TG or Tu exposure in the levels of ER stress and UPR-associated proteins including CHOP, phospho-eif2α, as well as the apoptosis regulator, BCL2-associated X protein (BAX), in Cnpy2 KO cells compared to WT and Cnpy2 Het hepatocytes (Fig. 1e). Interestingly, there was no difference in the induction of grp78 by Tu in WT, Het and KO cells (Fig. 1a, e), and consistent to our in vivo data, Xbp1s mRNA was induced similarly by Tu in WT, Het and KO hepatocytes in vitro (Supplementary Fig. 2c). Together, these data suggest a role for CNPY2 in the unfolded protein response and its loss protects hepatocytes against ER stress.
Figure 1. Cnpy2 knockout protects multiple cells against ER stress in vitro and in vivo.
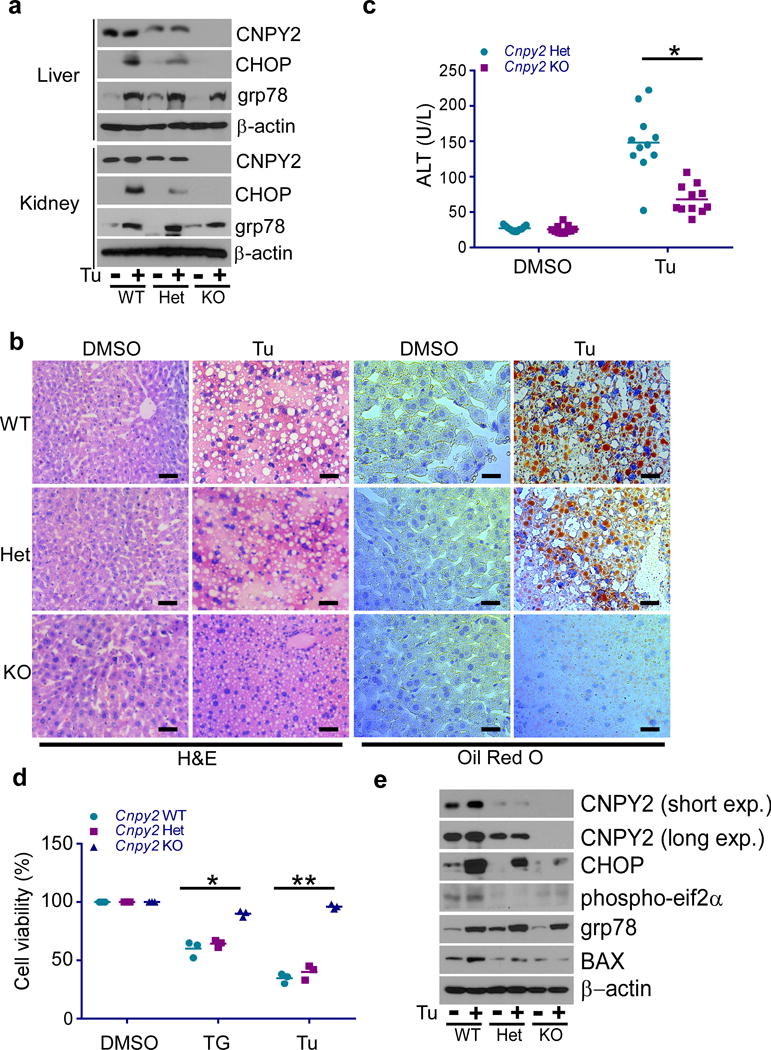
(a) Immunoblotting of WT, Cnpy2 Het and KO liver and kidney tissues at 8 weeks of age injected with DMSO or Tu for 24 h. (b) Hematoxylin and eosin (H&E) and Oil Red O staining for liver sections from indicated mice. Scale bar: 100 μm. (c) Serum ALT levels of WT, Cnpy2 Het and KO animals measured at 24 h post Tu treatment. (d and e) Cell viability (d) and immunoblotting (e) of WT, Cnpy2 Het and KO primary hepatocytes treated with DMSO, TG or Tu for 16 h. Data are shown as the mean ± s.d. of two (a-c, WT: n=12; Het: n=11; KO: n=11 mice) or three (d and e) independent experiments. *P < 0.05, **P < 0.01 by Student’s t-test (c and d). Uncropped images for a and e are shown in Supplementary Data Set 1.
Cnpy2 deletion protects mice from hepatic steatosis
UPR has been closely linked to non-alcoholic fatty liver disease (NAFLD)22-25. Thus, we assessed the role of CNPY2 in this pathophysiological setting. We utilized a high fat diet (HFD)-induced ER stress model and specifically investigated the effect of CNPY2 loss on ER stress and NAFLD. To this end, male Cnpy2 Het and KO mice were fed with HFD for 10 weeks. Although all mice showed body weight increase after 10 weeks, Cnpy2 KO mice gained significantly less body weight compared to the Het littermate controls (Fig. 2a). Grossly, Het livers appeared more pale and buoyant compared to KO livers, indicating potential differences in the liver fat content between HFD-fed Het and Cnpy2 KO mice (Fig. 2b). Indeed, H&E and Oil Red O staining demonstrated a striking distinction between Het and KO livers with the former heavily loaded with lipid droplets in hepatocytes (Fig. 2c). As expected, HFD induced a remarkable increase of the UPR markers in the livers of Cnpy2-sufficient mice, which was dramatically reduced in the KO livers (Fig. 2d). Correspondingly, increased levels of ALT and triglycerides (TG) after 10 weeks of HFD feeding were observed in control but not in Cnpy2 KO mice (Fig. 2e). These data strongly suggest that UPR contributes to NAFLD, and the loss of CNPY2 considerably attenuates the disease progression.
Figure 2. Cnpy2 deletion protects mice from hepatic steatosis.
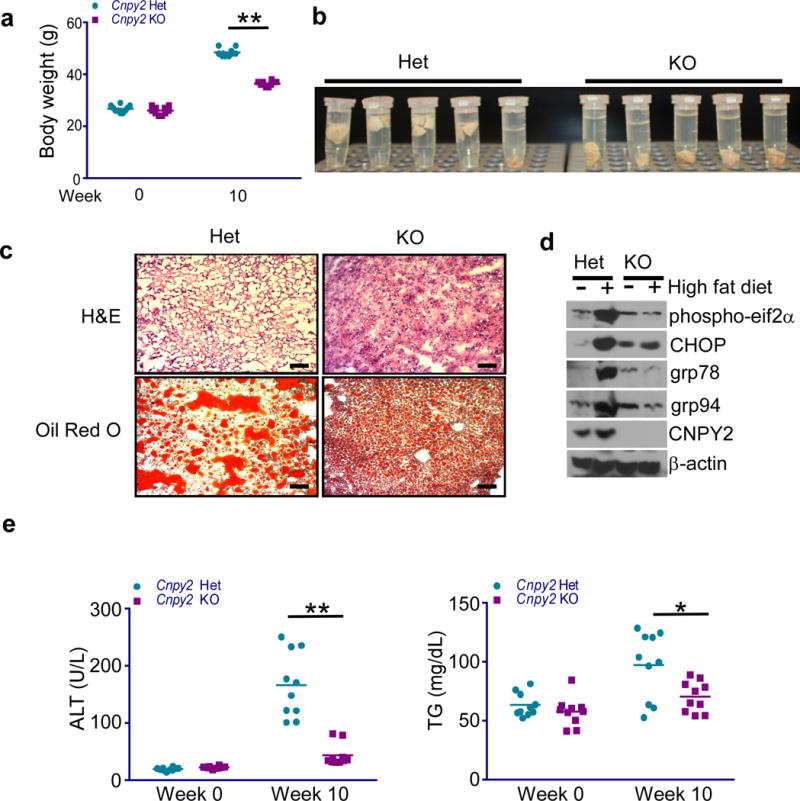
(a,b) Body weight at 10 weeks (a) and photograph of liver lobes (b) of Cnpy2-sufficent (Het) and –deficient (KO) male mice given high fat diet. *P < 0.05 by Student’s t-test(c) H&E and Oil Red O staining for Cnpy2 Het and KO liver sections. (Scale bar: 100 μm). (d) Immunoblotting of Cnpy2 Het and KO liver lysates at 10 weeks after giving high fat diet. (e,f) Serum ALT (e) and triglycerides (f) levels were measured. *P<0.05; **P<0.01 by Student’s t-test. All data are shown as the mean ± s.d. of two independent experiments (a-e). n= 10 mice per group. Uncropped blot/gel images of d are shown in Supplementary Data Set 1.
CNPY2 interacts with PERK
ER stress is known to trigger grp78 dissociation from the UPR sensors7,8. Since our data suggest involvement of CNPY2 in the UPR, we next sought to determine whether CNPY2 directly binds to the UPR sensor PERK to initiate the PERK-CHOP pathway. We addressed this possibility using both cell-based and cell-free systems. We treated HEK293 cells that expressed Myc-tagged grp78 and FLAG-tagged CNPY2 with Tu, and then performed sequential immunoprecipitation (IP) experiments. Our data indicate that under non-stress conditions CNPY2 interacts with grp78, however, this interaction is reduced upon ER stress induction (Fig. 3a). A similar finding was observed using the macrophage-like leukemic cell line, RAW264.7 (Supplementary Fig. 3a,b). To probe the interaction between CNPY2 and PERK, FLAG-tagged CNPY2 and Myc-tagged PERK were co-transfected transiently into HEK293 cells. We found that CNPY2 co-immunoprecipitated with PERK (Fig. 3b). Furthermore, we confirmed the direct binding between purified CNPY2 and PERK luminal domain (PERK-LD) by a pulldown experiment (Fig. 3c) as well as isothermal titration calorimetry (ITC) (Fig. 3d). ITC is a quantitative technique that can determine the binding affinity (Kd), enthalpy changes (ΔH) and stoichiometry of protein-protein interactions. Data from the ITC indicated that PERK-LD directly binds to CNPY2 with one active binding site (n=1.162 ± 0.007) and a moderate binding affinity (Kd =13.15 ± 0.3 μM) (Fig. 3d). The presence of six conserved Cys residues in CNPY2 suggest the roles of the intramolecular or intermolecular disulfide bond formation in CNPY2 function. To test this possibility, we generated a CNPY2 mutant termed 6C-A in which all the Cys were mutated to Ala (C28A, C31A, C86A, C137A, C164A, C171A) and then performed ITC. Intriguingly, we found that 6C-A mutation completely abrogated CNPY2 binding to PERK-LD (Supplementary Fig. 4), suggesting the Cys residues are important for the CNPY2-PERK interaction. Since grp78 is well-documented to bind to PERK and the kinase activity of PERK can be regulated by other molecules including TB12 and p58IPK26,27, we hypothesized that CNPY2 competes for PERK binding. Therefore, we sought to determine whether CNPY2 competes with grp78 for binding to PERK. Indeed, in a cell-free system, CNPY2 dose-dependently dissociated grp78 from being in complex with PERK-LD (Fig. 3e). This result also suggests that under this experimental condition CNPY2, PERK, and grp78 do not form a trimeric complex. To further examine the functional consequence of the interaction between CNPY2 and PERK, we performed an in vitro kinase assay for PERK with or without CNPY2. We found that immunoprecipitated Myc-PERK phosphorylated its bona fide substrate glutathione S-transferase (GST) tagged eif2α (GST- eif2α), but not the GST-eif2α S51A mutant, which has the PERK phosphorylation site mutated. Addition of CNPY2 led to a reproducible 2-fold increase in the phosphorylation level of GST-eif2α by Myc-PERK (Fig. 3f).
Figure 3. CNPY2 interacts with PERK.
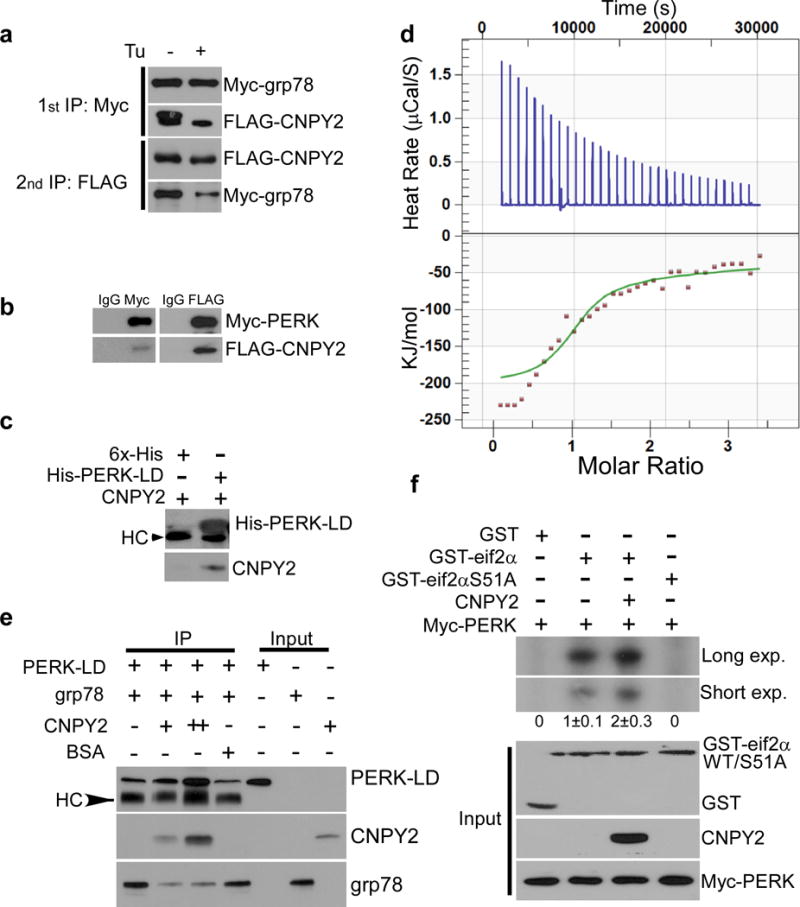
(a) Sequential immunoprecipitation (IP) of Myc-grp78 and FLAG-CNPY2-co-overexpressing HEK293 cells treated with or without Tu, followed by immunoblotting for the indicated proteins. (b) co-IP and immunoblotting (as in a) of HEK293 cells co-transfected with FLAG-CNPY2 and Myc-PERK vectors. (c) In vitro binding assay of purified 6X His/T7-tagged PERK-LD and His-tagged CNPY2 assessed by immunoblotting. 6X His-tagged protein (6X-His) was used as a control. HC: immunoglobulin heavy chain. (d) Study of CNPY2-PERK interaction by isothermal titration calorimetry (ITC). Data shown are the mean ± s.d. of three independent experiments. (e) IP using anti-T7 antibody and immunoblotting of His/T7-tagged PERK-LD and recombinant grp78 proteins incubated in the presence or absence of His-tagged CNPY2 or bovine serum albumin (BSA). (f) PERK kinase assay performed in the presence or absence of CNPY2 using GST-eif2α, GST-eif2αS51A or GST as substrates. Phosphorylation was visualized using an autoradiography. “exp.” denotes exposure. Input proteins were verified by immunoblotting. HC: immunoglobulin heavy chain. Data are representative of three (a-d) or two (e-f) independent experiments. Uncropped blot/gel images of a-c and e,f are shown in Supplementary Data Set 1.
Structure-function study of CNPY2 in activating PERK Pathway
To further address the potential roles of disulfide bond formation in CNPY2 function, we mutated the three Cys residues in the N-terminal half of CNPY2 to Ala (C28A, C31A, C86A). Surprisingly, we found that this triple Cys mutant (3C-A) interacted with equal efficiency if not higher with PERK-LD (3C-A:PERK stoichiometry=1.0366 ± 0.014; Kd =7.5 ± 0.1 μM), compared to the WT CNPY2 (Fig. 4a,b). Additionally, the 3C-A mutant was more active and displayed an increased propensity to promote PERK-mediated phosphorylation of GST-eif2α (Fig. 4c). Next, we performed rescue experiments using Cnpy2 KO mouse embryonic fibroblast (MEF) cells to further understand the structure-function relationship of CNPY2. We stably expressed WT CNPY2, as well as the 3C-A and 6C-A mutants in the MEF cells. In line with our earlier data, and based on the differential migration pattern on reducing and non-reducing gels, we observed only the WT and 3C-A mutant, but not the 6C-A mutant to form disulfide bond-dependent complexes (Fig. 4d). The 3C-A mutant is not stable and has a shorter half-life, compared to WT and 6C-A mutant (Supplementary Fig. 5a). Intriguingly, we found that the PERK/CHOP signal was completely restored in response to Tu by the WT and 3C-A mutant, but not the 6C-A CNPY2 mutant (Fig. 4e). Notably, 3C-A expression level decreased after Tu treatment despite induction of CHOP, suggesting that CNPY2 initiates but is not required for sustaining the UPR. Importantly, overexpression of 3C-A mutant does not activate the UPR in WT MEF cells in the absence of ER stress (Supplementary Fig. 5b), suggesting that 3C-A per se does not act as a misfolded protein to trigger UPR. Overall, our data demonstrate the importance of the CNPY2 disulfide bond formation property to activate the PERK-CHOP pathway.
Figure 4. Structure-function study of CNPY2 in activating PERK Pathway.
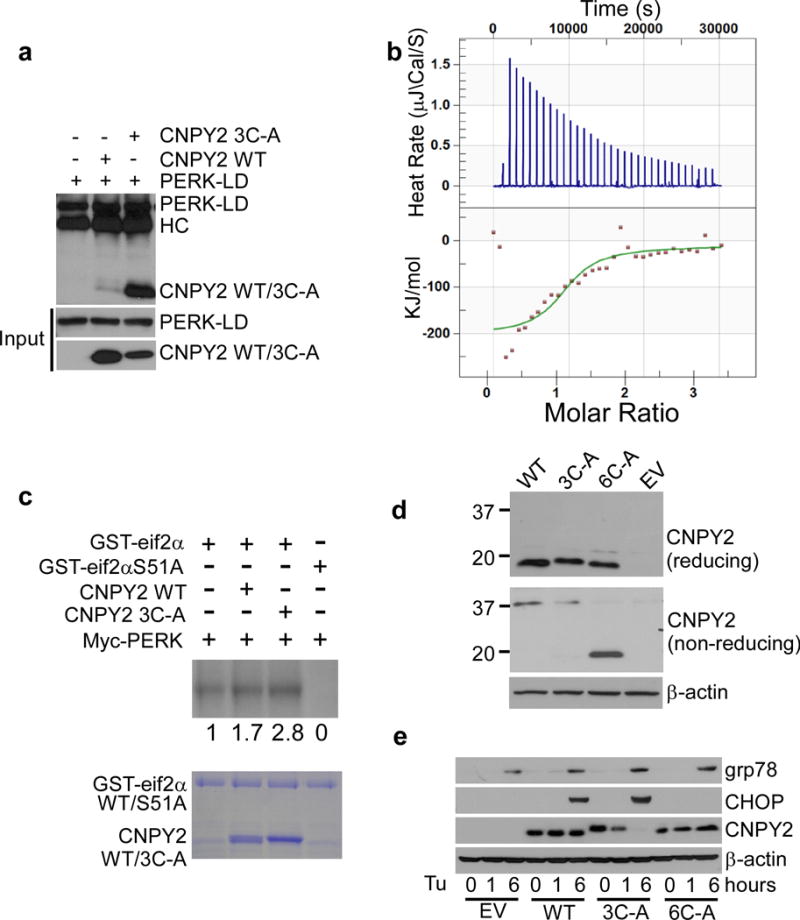
(a) Homogeneous His/T7-tagged PERK-LD and His-tagged CNPY2 WT or Cys mutant 3C-A (C28/37/86A) were incubated, followed by IP using anti-T7 antibody. Indicated proteins were immunoblotted with anti-His antibody. (b) Study of the interaction between PERK and CNPY2 mutants by ITC. Data are mean ± s.d. of three independent experiments. (c) In vitro PERK kinase assay (as in Fig. 3f) was performed in the presence or absence of CNPY2 WT or CNPY2 3C-A mutant protein. Phosphorylation of GST-eif2α was visualized using an autoradiography. Input proteins are shown in the Coomassie blue-stained gel. (d) Motility of WT CNPY2 and its Cys mutants on reducing and non-reducing SDS-PAGE. Immunoblotting was performed using total cell lysates of MEFs expressing various forms of CNPY2. β-actin was used as a loading control. (e) Restoration of UPR by WT or CNPY2 mutants in CNPY2 KO MEFs cells treated with or without Tu for 6 h, and then immunoblotted for the indicated proteins. EV: Empty vector. Data are representative of three (a,b and e) or two (c,d) independent experiments. Uncropped blot/gel images of a and c-e are shown in Supplementary Data Set 1.
CHOP regulates CNPY2 transcription
The transcriptional mechanism of CNPY2 regulation is unknown, but given the strong induction of CHOP by ER stress (Fig. 1), we next determined whether CHOP could directly transactivate Cnpy2. CHOP is a transcription factor that transactivates multiple UPR target genes such as Il23a and Atp2a128,29. Comparative promoter analysis of the human Cnpy2 gene and its orthologs revealed that these genes share a CHOP consensus recognition motif (Fig. 5a). Using an oligonucleotide pulldown assay, we found that Cnpy2 promoter binds to CHOP upon Tu treatment. This interaction was competitively attenuated by the non-biotinylated oligonucleotide corresponding to the CHOP-binding motif in the Cnpy2 promoter (Fig. 5b). The occupancy of Cnpy2 promoter by CHOP is also confirmed by a Chromatin Immunoprecipitation (ChIP) assay (Fig. 5c). Additionally, overexpression of CHOP increased the promoter activity of Cnpy2 in HEK293 cells (Fig. 5d) and upregulated the expression of CNPY2 (Fig. 5e). These results suggest that CHOP regulates UPR by positively modulating the expression of CNPY2.
Figure 5. CHOP positively regulates Cnpy2 transcription.
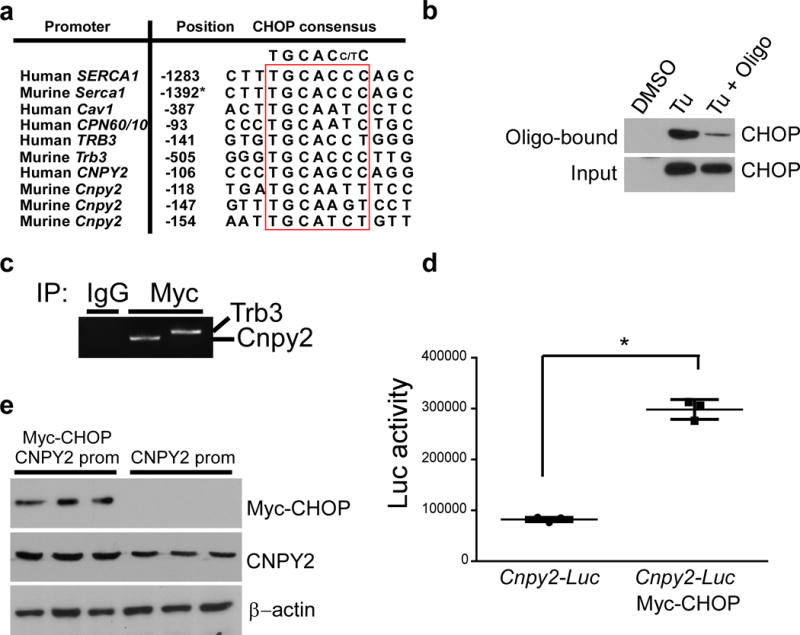
(a) Alignment of CHOP-responsive element found in the promoter regions of Cnpy2, sarcoendoplasmic reticulum calcium ATPase1 (Human SERCA1; Murine Serca1), carbonic anhydrase VI (Human CAVI), chaperonins 60/10 (Human CPN60/10) and Tribbles pseudokinase 3 (Human TRB3; Murine Trb3) genes. The base positions of the consensus are boxed and indicated 5′→3′. Positions are relative to transcription initiation site or where indicated (asterisk) to initiation codon. (b) Oligonucleotide pull-down assay of RAW cells treated with DMSO or Tu for 16 h and. Immunoblotting of DNA-protein complexes in nuclear extracts (input) and on pull-down complexes (Oligo-bound). (c) Chromatin immunoprecipitation assay of Myc-tagged CHOP-expressing HEK293 cell lysates with anti-Myc antibodies or control antibodies, followed by PCR for Cnpy2 and Trb3 promoters. (d) Luciferase activity measured in HEK293 cells 48 h after transfection with Cnpy2 promoter-driven luciferase (Luc) reporter (Cnpy2-Luc) with or without CHOP-expression vector. Data shown is the mean ± s.d. of three independent experiments. *P < 0.05 by Student’s t-test. (e) Immunoblotting for the indicated proteins in the whole cell lysate of (d). Data are representative of three (b-e) independent experiments. Uncropped blot/gel images for b and e are shown in Supplementary Data Set 1.
DISCUSSION
The lumen of the ER provides an environment that is specialized for the production of membrane and secretory proteins. The UPR pathway functions as a barometer of protein stress and it provides an intricate monitoring system in response to alterations in ER homeostasis. The UPR pathways are tuned constantly during normal and stress conditions. Nevertheless, how the UPR sensors are triggered molecularly is not entirely clear12,30. In one model, grp78 binds to and sequesters all three UPR sensors (PERK, IRE1 and ATF6) in an inactive state under normal conditions. Upon ER stress, accumulated unfolded proteins trigger dissociation of grp78 from the UPR sensors, and activate the UPR by facilitating PERK dimerization, IRE1 autophosphorylation and ATF6 translocation to the Golgi apparatus. The second model implies the direct interaction between unfolded/misfolded proteins and the UPR sensors to trigger the UPR10. The third model relates to the requirement for both grp78 dissociation and misfolded protein binding to UPR sensors. One key remaining question is whether these three models uncover all the mechanisms of UPR activation, or some other unidentified molecules are required in the process of UPR activation. In the present study, we provide the first evidence that CNPY2 acts as a major trigger for the PERK-CHOP pathway. In the absence of CNPY2, the PERK pathway was impaired in both in vivo (liver and kidney) and in vitro (primary hepatocytes and MEFs). Molecularly, we found that during transition from non-stress status to stress conditions, CNPY2 switches its binding partner from grp78 to PERK, which coincides with PERK activation. Intriguingly, we found no evidence for grp78 and CNPY2 to co-present in a complex with the UPR sensors, suggesting that perhaps the binding regions of the UPR sensors are only assessable to CNPY2 after grp78 dissociation. The importance of CNPY2 in UPR was further demonstrated using our in vitro reconstitution system, in which we found CNPY2 to directly promote the enzymatic activity of PERK kinase. Finally, we found that CNPY2 itself is also regulated by the UPR via direct transcriptional activation by CHOP.
The UPR has been closely linked to NAFLD although it remains to be resolved whether NAFLD is the result of UPR dysfunction or a cause. Some studies support the notion that ER dysfunction and UPR activation precedes hepatic steatosis, consequently causing the disease22,23,31-33. Conversely, there is evidence suggesting that ER dysfunction and UPR activation is the result of lipid accumulation in hepatocytes34. Most of the studies examining this question are based on perturbation of one branch of UPR pathways, which often give rise to conflicting results. For example, deletion of Xbp1 makes hepatocytes more resistant to develop high fat diet-induced steatosis35, whereas deleting Ire1 in hepatocytes worsens NAFLD21. Silencing Atf6 in Zebrafish results in reduction of steatosis incidence caused by prolonged ER stress, but increases it in response to acute ER stress22. Studies with Atf6 null mice also show similar results23,36. The fact that CNPY2 is required to elicit the PERK pathway presented a unique opportunity for us to re-examine the roles of this pathway in NAFLD. We found that deletion of Cnpy2 blocks the PERK-CHOP pathway, and this had strong protective effects against NAFLD induced either acutely with tunicamycin or chronically by HFD. Thus, our work suggests highly that the UPR contributes causally to NAFLD. Our work is consistent with the study that silencing grp78, a main regulator of all three UPR pathways, leads to alleviation of NAFLD24. In addition, Atf4 null mice phenocopies Cnpy2 KO mice, in that, they are both protected against HFD-induced hepatosteatosis25
Most importantly, our study has uncovered a fundamental role of CNPY2 in initiating PERK-CHOP-mediated UPR (Fig. 6). In the non-stress conditions, both PERK and CNPY2 are sequestered by grp78. During the transition from non-stress to stress conditions, grp78 disassociates from PERK and CNPY2, allowing free CNPY2 to interact with PERK. Consequently, the enzymatic activity of PERK kinase increases, leading to a cascade of events including induction of CHOP. This concept is analogous to the IRE1-XBP1s pathway in that multiple interacting molecules come together during ER stress to form UPRosome signaling platform to initiate the UPR37. Finally, CNPY2 is itself up-regulated by UPR via direct transcriptional activation by CHOP, further enhancing activity of the PERK pathway to cope with ER stress. Much more work remains to be done such as understanding the structural basis for CNPY2-PERK interaction. Nonetheless, our work has uncovered a previously unrecognized molecular mechanism of UPR initiation, and raises the possibility of targeting CNPY2 for the treatment of a myriad of UPR-mediated pathological conditions such as NAFLD, obesity, diabetes mellitus, neurodegenerative diseases and cancer.
Figure 6. A proposed model for CNPY2 in UPR.
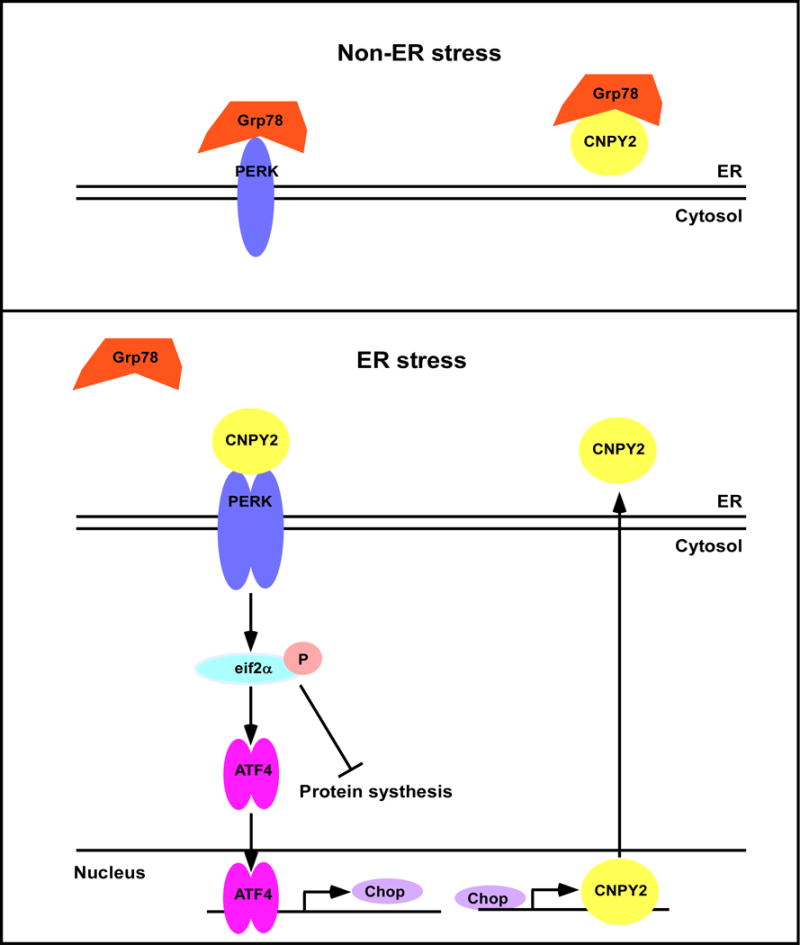
Under non-ER stress conditions, grp78 binds to PERK and CNPY2, and thus maintains these proteins in an inactive state. In the presence of ER stress, accumulation of misfolded proteins or alterations in ER homeostasis causes grp78 to dissociate from both PERK and CNPY2 to perform its chaperone function for misfolded proteins. grp78 dissociation, along with CNPY2 binding to PERK, and perhaps other yet unidentified events collectively initiate the UPR. The activated PERK pathway increases CHOP expression, which in turn transcriptionally upregulates CNPY2 expression.
Online Methods
Experimental animals
Cnpy2 heterozygous and knockout mice were back-crossed to 10 generations with C57B6L/J background before using in the studies. Cnpy2 KO mice and age-matched heterozygous and WT littermates were maintained at pathogen-free conditions and studied according to protocols approved by the Institutional Animal Care and Use Committees of the Medical University of South Carolina and in compliance with guidelines by the Association for Assessment and Accreditation of Laboratory Care International (AAALAC).
Generation of Cnpy2 knockout mice
A fragment of genomic DNA containing murine Cnpy2 exons 2-6 was cloned into a pBluescript-derived plasmid (Stratagene Inc) containing the MC1–HSV–TK cassette. Two fragments flanked on both ends with Frt-PGKneo-Frt-LoxP or LoxP-PGKneo-LoxP were inserted into intron 1 or intron 5, respectively. The PGKneo sequence in intron 5 was removed to generate the first LoxP site. The plasmid was then digested using NotI to linearize the fragment, which was then electroporated into embryonic stem (ES) cells. ES cells were positively selected by G418 and negatively selected by gancyclovir. The drug resistant target ES clones were identified by PCR genotyping, and then used to generate the chimera mice by ES-morula aggregation. The chimera mice were bred with the ROSA26-Flpe mice to remove the PGKneo cassette in intron 1 and to generate the second LoxP site. The mice were further crossed with Ella-cre transgenic mice to generate the KO allele (Supplementary Fig. 1a). Cnpy2 KO mice were backcrossed unto the C57BL/6J genetic background for more than 10 generations for further experiments.
Cell lines
Mouse cell line (RAW 264.7) and human cell lines (HEK293 and Phoenix Eco (PE)) were purchased from American Type Culture Collection (ATCC). MEF cells were generated from Cnpy2 WT and KO mice by us. All culture conditions have been previously described38. All cell lines were tested by PCR and found to be mycoplasma negative. Cells were treated with chemicals at the following final concentrations: TG (5 μM) or Tu (1 μg/ml for MEF, 5 μg/ml for other cells) for 16 h; Cycloheximide (100 μg/ml for the indicated time, Supplementary Fig. 5). Cell viability was also assessed using trypan blue exclusion.
Antibodies, reagents and peptides
Antibodies against CNPY2 (Cat.# 14635-1-AP), Myc (Cat.# 16286-1-AP) and (Cat.# 11587-1-AP) were purchased from Proteintech. Antibodies against grp94 (clone 9G10. Cat.# ADI-SPA-850) were obtained from Enzo Life Sciences. CHOP (Clone B-3. Cat.# sc-7351) and BAX (Clone 6A7. Cat.# sc-23959) antibodies were purchased from Santa Cruz Biotechnology. Other reagents including antibodies against β-actin (Cat.# 1978), and FLAG (Cat.# F9291), Myc and FLAG peptides, Tu, cycloheximide and collagenase IV were obtained from Sigma-Aldrich unless otherwise specified. TG was purchased from Calbiochem.
Plasmids, constructs and site-directed mutagenesis
Plasmids of Myc-grp78, Myc-PERK and Myc-CHOP were obtained from Addgene. FLAG-tagged CNPY2 construct was subcloned into MigR1 retroviral vector with primers 5′- TAT GCG GCC GCG CCA CCA TGA AAG GCT GGG GTT GGC TAG C - 3′ and 5′- ATT GCG GCC GCT TAC AAT TCA TCC TTG TCG TCA TCG TCT TTG TAG TCA GAT CTG TGC AGG GCA TGG TC - 3′. Murine Cnpy2 promoter was subcloned into pGL4 vector (Promega). Primers for Cnpy2 promoter are 5′- ATC TCG AGG AGT TGA GTT CAA GGC ATC CTG GGC TAC AT - 3′ and 5′- ATA AGC TTT TGG AAG ACT TGA GGA CCC AGA C - 3′; Primers for murine Eif2α are 5′- ATT GCG GCC GCA CCA TGC CGG GGC TAA GTT GTA GAT TTT A - 3′ and 5′- GCG CTC GAG TTA ATC TTC AGC TTT GGC TTC CAT TTC - 3′. Eif2α was subcloned into pGEX vector. CNPY2 mutants and eif2α S51A mutants were generated using a site-directed mutagenesis kit (Agilent). His-tagged CNPY2 was subcloned into pHGK vector. PERK-LD was subcloned into pET28b vector (a gift from Dr. Shaun Olsen, MUSC).
Quantitative real-time PCR
RNA was extracted from colon tissue by TriZol reagent, and quantified with a Nanodrop. mRNA was then reverse transcribed into cDNA using Superscript II Reverse Transcriptase (Invitrogen). cDNA was then diluted so that 10 ng of RNA was used per reaction. Quantitative real-time PCR (qRT-PCR) was carried out with SYBR Green Supermix (Bio-Rad) using a Bio-Rad iCycler. Data were exported into Excel for analysis using the ΔCt (the number of PCR cycles to reach the threshold of the product detection) method and normalized to β-actin as an internal control. Plots represent fold change in mRNA. The primers for Edem1 are 5′ - CAA TGA AGG AGA AGG AGA CCC -3′ and 5′ - GCA TCT TCC ACA TCC CCT ATC -3′. The primers for Erdj4 are 5′- AAA TAA AAG CCC TGA TGC TGA AG -3′ and 5′ - CCT CTT TGT CCT TTG CCA TTG - 3′. The Xbp1s primers are 5′ - ACA CGC TTG GGA ATG GAC AC -3′ and 5′ - CCA TGG GAA GAT GTT CTG GG -3′.
Retrovirus production and transduction
MigR1-CNPY2 plasmids were transfected into PE packaging cells using Lipofectamine 2000 (ThermoFisher). Six hours after transfection, medium was replaced with pre-warmed fresh culture medium. Virus-containing medium was collected at 48 h post transfection. Viral transduction was performed for 8 h at 37°C in the presence of 8 μg/ml hexadimethrine bromide (Sigma-Aldrich).
Mouse treatment, histopathology and Oil Red O staining
Eight-week old WT, Cnpy2 Het and KO male mice were injected intraperitoneally (i.p.) with DMSO or Tu (0.4-1 μg/g body weight) for 24 hours, or fed with high fat diet (Hanlan, Cat.#88137) for 10 weeks before harvesting the liver and kidneys for histological analysis. Approximately 1-cm segments of tissue were embedded in Optimal Cutting Temperature (OCT) medium (Thermo Scientific) and immediately frozen on dry ice or fixed in 4% formaldehyde/PBS, then dehydrated in 30% sucrose/PBS, before embedding in OCT medium. Samples were stored at −80°C until sectioning. Five-μm sections were cut on a cryostat onto poly-L lysine-coated slides (Sigma-Aldrich). For histological examination, slides were immediately stained with H&E (Fig. 2c). For Oil Red O staining39, frozen section were fixed in formalin, then rinsed with 60% isopropanol. The slides were stained with freshly prepared Oil Red O solution for 15 minutes (Fig. 2c). All pathological analyses were done with the genotypes blinded to the pathologist.
Oligonucleotide pull-down assay and luciferase assay
Sequence of Cnpy2 promoter oligonucleotide (biotin-labeled and non-biotin-labeled) is CCA CTA CTA ATT GCA TCT GTT TGC AAG TCC TAG CCC ACC TGG ACT (Two potential CHOP consensus binding motifs are bolded). The oligonucleotide pull-down assay29 was achieved with 250 μg of nuclear extracts and 1 μg of biotin-labeled probe. DNA-protein complexes were precipitated using immobilized neutravidin beads (Pierce), then washed and separated by SDS-PAGE. Immunoblotting analyses were performed on nuclear extracts and on pull-down complexes (Fig. 5b). Luciferase assay (Fig. 5d) was performed using the luciferase assay system (Promega) in a luminometer plate reader. The luminescence was measured during a 5 second delay over a 10 second window after addition of Luciferin.
Chromatin immunoprecipitation assay
The assay shown in Figure 5c was performed using a ChIP kit (Active Motif, Carlsbad, CA). Briefly, Myc-tagged CHOP expressing HEK293 cells grown in 100 mm dish were cross-linked using 1% formaldehyde. After washing three times with PBS, cells were resuspended by lysis buffer. DNA was digested to small fragments (100 to 500 bp) by enzymatic method. After centrifugation, supernatant was incubated with either anti-Myc antibody or control IgG for overnight. Incubation was further carried out with protein G-agarose beads for 2 h and beads were washed with buffers provided in the kit. The immunoprecipitated DNA was eluted from the beads with 1 M NaHCO3 and 1% sodium sulphate dodecyl solution and reverse cross-linked using 5 M NaCl and RNase A at 65°C for overnight. Samples were then digested with proteinase K and DNA was purified using column method. Polymerase chain reaction (PCR) was performed on the purified DNA using CNPY2 and TRB3 promoter-specific primers. The primers for CNPY2 are 5′ - CAA ACT ACA GGT CCC AGG ATA G - 3′ and 5′ - CAC AGG AAA CTA CAT CTC CCA - 3′. The primers for TRB3 are 5′-GCA GGG AGA AGG GAG ATA AAC - 3′ and 5′- CTA TAT CTG CTG AGT GCC CAT C - 3′.
Liver perfusion and isolation of hepatocytes
Liver perfusion and isolation of hepatocytes were performed according to the procedures described in Severgnini et al40. Briefly, mice were anesthetized with an i.p. injection of Ketamine (100 mg/kg body weight) and Xylazine (10 mg/kg body weight). All buffers were prewarmed to 37°C. The liver was perfused in situ via the inferior vena cava for 10 min with 0.5 mM ethylene glycol-bis (β-aminoethyl ether)-N,N,N′,N′-tetraacetic acid (EGTA)/Hank’s Balanced Salt Solution (HBSS) buffer, while the portal vein was used as outflow. The flow rate was 6 ml/minute and the pressure of perfusion did not exceed a 20-cm water column. The perfusion was continued with the digestion medium (Dulbecco’s Modified Eagle’s medium with low glucose containing 100 U/ml collagenase IV) for 7 minutes. The liver was isolated from mice and dissociated in cold isolation medium (1:1 ratio of Dulbecco’s Modified Eagle’s medium with high glucose/F12 containing 10% fetal bovine serum). The liver cell suspension was filtered through a cell strainer (70 μm), centrifuged and then washed twice with the isolation medium. Cells were seeded in a 10 cm dish at a density of 300,000/ml for a total of 3 million. Cells were incubated at 37°C for 4 h, after which the culture media was changed to serum-free medium to maintain the morphology of the hepatocytes.
Immunoblotting analysis
Total cell lysates were resolved by SDS-PAGE, and the proteins were transferred onto PVDF membranes. The membranes were blocked with 5% non-fat milk in PBST buffer (8 mM Na2HPO4, 150 mM NaCl, 2 mM KH2PO4, 3 mM KCl, 0.05% Tween® 20, pH 7.4) and then incubated with primary antibodies, followed by incubation with HRP-conjugated secondary antibodies. Protein bands were visualized using enhanced chemiluminescent substrate (Pierce, Rockford, IL).
Sequential immunoprecipitation
Cell lysate extracted from Myc-grp78 and FLAG-CNPY2 co-transfected HEK293 cells was used for sequential immunoprecipitation (Fig. 3a). A complex of Myc-grp78 and FLAG-CNPY2 was first co-immunoprecipitated using anti-Myc antibody coupled with protein G beads. This complex was then eluted from the beads using Myc peptides. The complexes from the aliquot elution (1st IP) were immunoblotted for Myc-grp78 and FLAG-CNPY2. Secondary IP (2nd IP) was performed by anti-FLAG antibody to pull-down the complex from the elution. Immunoblotting was performed for the indicated proteins.
Protein purification, in vitro binding assay and PERK kinase assay
N-terminally hexahistidine- (His 6X)-tagged/T7 tagged PERK-LD, His 6X-tageged CNPY2 WT and mutant proteins were expressed in BL21 E. coli cells (New England Biolabs). The bacterial cultures were grown at 37 °C to an optical density (OD600) of 0.8 in LB medium supplemented with 50 μg/ml kanamycin and 30 μg/ml chloramphenicol. The cells were further incubated at 37 °C for 6 h for induction of proteins by 0.5 mM isopropylthio β-d-1-galactopyranoside (IPTG), and then harvested by centrifugation, and lysed with sonication in buffer (50 mM Tris-HCl, pH 7.4, 350 mM NaCl, 1 mM MgCl2, 0.1 μg/μl DNase I, 2.5 μg/ml Lysozyme, 1 mM β–mercaptoethanol, 10 mM Imidazole) containing protease inhibitor cocktail. The His 6X/T7 tagged PERK-LD lysates were cleared by centrifugation for 30 min at 18,000 rpm, and supernatants were transferred to a binding buffer-equilibrated HisTrap FF column (GE Healthcare Life Sci). The column was washed 5 column volumes of binding buffer (50 mM Tris-HCl, pH 7.4, 350 mM NaCl, and 10 mM Imidazole). The His 6X-tagged PERK-LD proteins were eluted from the column with elution buffer (20 mM Tris pH 7.4, 500 mM NaCl, 500 mM Imidazole). The His 6X-tagged CNPY2 proteins present in inclusion bodies were denatured in buffer (20 mM Tris pH 7.4, 500 mM NaCl, 5 mM Imidazole, and 8 M Urea), applied to an equilibrated HisTrap FF column, refolded with the addition of binding buffer (20 mM Tris pH 7.4, 500 mM NaCl and 5 mM Imidazole), and were eluted from the column with elution buffer (20 mM Tris pH 7.4, 500 mM NaCl, 500 mM Imidazole). The proteins were concentrated using centrifugal filters (Amicon Ultra, 10 kDa MWCO; Merck Millipore), and stored at −80 °C.
N-terminally GST-tagged eif2α WT and mutant (eif2αS51A) proteins were expressed in BL21 E. coli cells. The cells were grown at 37 °C in LB medium containing 100 μg/ml ampicillin. At an OD600 of 0.8 the cultures were shifted to 30 °C, and expression was induced with 0.5 mM IPTG for additional 6 h incubation. The cells were harvested and resuspended in buffer (50 mM Tris-HCl, pH 7.4, 350 mM NaCl, 1 mM MgCl2, and 0.1% (v/v) Triton X-100) containing protease inhibitor cocktail and DNaseI. The resuspended cells were sonicated for 10 min (Amplitude 60%, pulse on 2 s, pulse off 5 s). The lysates were cleared by centrifugation for 30 min at 18,000 rpm and incubated with 1 ml 50 % slurry glutathione Sepharose 4B beads (GE Healthcare) per liter of expression culture for 2 h at 4 °C. The beads were washed twice with 20 ml wash buffer (50 mM Tris-HCl, pH 7.4, 350 mM NaCl, 0.1% (v/v) Triton X-100). Bound proteins were eluted in elution buffer (50 mM Tris, pH 8.0, 150 mM NaCl, 1 mM CaCl2, 25 mM reduced glutathione), and concentrated protein solutions were applied to FPLC, and GST fusion protein fractions were collected and concentrated for using in Figure 3f and 4c.
The in vitro binding assays shown in Fig. 3c,e and 4a were carried out at 37°C for 1 h in 300 μl of binding buffer (20 mM Hepes, pH 7.5, 50 mM KCl, 2 mM MgCl2 and 0.1% NP-40) containing 2 μg His/T7 tagged PERK-LD and 3 μg His-tagged CNPY2 or CNPY2 3C-A mutant proteins in the presence or absence of 2 μg of recombinant grp78, followed by 30 min incubation with anti-T7 antibody beads. Immunoprecipitates were then resolved by SDS-PAGE, transferred unto a PVDF membrane and immunoblotted for His tag to detect both PERK-LD and CNPY2. The PERK kinase assay (Fig. 3f, 4e) was previously described27. Briefly, the kinase assay was performed at 30°C for 30 min in 30 μl of kinase buffer (20 mM Hepes, pH 7.5, 50 mM KCl, 1.5 mM DTT, 2 mM MgCl2, 0.1 mM ATP) containing 2 μg of purified WT eIF2 or S51A mutant eIF2, or GST alone as control, 6 μCi of [γ-32P]ATP (PerkinElmer), immunoprecipitated Myc-tagged PERK from 2 mg of lysates using 3 μg Myc antibody (clone 9E10) coupled with protein G beads. Three μg of purified CNPY2 was included in one reaction as indicated. Reaction mixtures were spun down and then supernatant was subjected to SDS-PAGE and visualized by autoradiography on an X-ray film. The intensity of bands was measured using the ImageJ software.
Isothermal titration calorimetry (ITC)
ITC experiments were performed using a nano Isothermal Titration Calorimeter from TA instruments (Fig. 3d, 4b and Supplementary Fig. 4). Solutions were thoroughly degassed prior to experiments to avoid air bubbles in the calorimeter. All protein samples were prepared in Phosphate Buffered Saline. For binding of PERK luminal domain (PERK-LD) to PBS buffer, CNPY2 or CNPY2 mutant protein, typically 50 μM of CNPY2 or CNPY2 mutant protein was placed in the reaction cell in a 300 μl volume, and 500 μM PERK-LD was placed in the ITC syringe. Aliquots of 1.5 μl were injected into the reaction cell at 300 seconds (s) intervals with a stirring speed of 300 round per minute and temperature of 20°C. The titrations were completed after 32 injections. The data was then analyzed using the software Nano Analyzer v2.1.13.
Statistical analysis
All in vivo experiments were conducted using at least 10 randomly selected mice per condition. We justified sample size based on preliminary data from a pilot study that showed expression differences in ER stress genes between tunicamycin-treated WT and CNPY2 KO mice (n = 3 per group). In this experiment, average log-transformed fold-change (FC) was −0.71 (corresponding to an average FC = 0.49), with an IQR of the s.d. of log-transformed mRNA values ranging from 0.24 to 0.55. Assuming a similar effect size, a s.d. as small as 0.24 and as large as 0.55 requires as few as 3 and as many as 10 animals per group to achieve 80% power based on a two-sample t-test with two-sided α = 0.05. We therefore conservatively conducted most of the subsequent mouse experiments using 10 or more animals per group. The actual mouse number for individual experiment is shown in the figure legend section. For all experiments using primary isolated hepatocytes from randomly selected mice, we used two or three mice per condition for biological replicates and showed only reproducible results. For other in vitro experiments, we performed two or three independent experiment to confirm our findings. Data presented are the mean ± s.d unless otherwise stated. All statistical significances were determined by the unpaired two-tailed Student’s t-test using the GraphPad Prism software, version 6.0 (GraphPad Prism Software). P < 0.05 was considered to be statistically significant.
Data availability
Uncropped images of western blots and qPCR gels are in the Supplementary dataset 1. Source data for Figure 1c, 1d, 2a, 2e, 5d, Supplementary Figure 1d, 1e, 2a, 2b, 2c are available with the paper online. All protocols and other data in this study are available from the authors upon reasonable request.
Supplementary Material
Acknowledgments
Authors thank Dr. Shaun Olson who provided the pET28b vector and protocol for purification of His-tagged CNPY2 from the inclusion bodies. We also thank the MUSC protein core for providing the service for the ITC experiments, Drs. Daniel Gewirth, Ephraim Ansa-Addo and Stuart Parnham for critical reading of the manuscript. The current study was supported by grants from National Institutes of Health (NIH) to Z.L. (R01DK105033, P01CA186866, R01CA213290, R01CA188419 and R01AI070603). Z.L. is the Abney Endowed Chair in Stem Cell Biology and Therapy and is supported by the South Carolina SmartState Centers of Economic Excellence.
F.H. and Z.L. designed experiments, analyzed the data and wrote the manuscript. B.L. initiated the project and contributed to generation of Cnpy2 KO mice and data analysis. F.H. performed most of the experiments. B.W. helped in the purification of GST-eif2α and GST-eif2αS51A. J.M. assisted with in vitro experiments. B.R. and C.D. sub-cloned His-tagged mouse Cnpy2 into the pHGK vector. S.S. performed histological analysis. A.D. provided important reagents. All the authors discussed the data and approved the manuscript.
Footnotes
One-sentence summary: CNPY2 is a key initiator of the PERK-CHOP pathway
COMPETING FINANCIAL INTERESTS
The authors declare no competing financial interests.
References
- 1.Kozutsumi Y, Segal M, Normington K, Gething MJ, Sambrook J. The presence of malfolded proteins in the endoplasmic reticulum signals the induction of glucose-regulated proteins. Nature. 1988;332:462–4. doi: 10.1038/332462a0. [DOI] [PubMed] [Google Scholar]
- 2.Cox JS, Shamu CE, Walter P. Transcriptional induction of genes encoding endoplasmic reticulum resident proteins requires a transmembrane protein kinase. Cell. 1993;73:1197–206. doi: 10.1016/0092-8674(93)90648-a. [DOI] [PubMed] [Google Scholar]
- 3.Harding HP, Zhang Y, Ron D. Protein translation and folding are coupled by an endoplasmic-reticulum-resident kinase. Nature. 1999;397:271–4. doi: 10.1038/16729. [DOI] [PubMed] [Google Scholar]
- 4.Haze K, Yoshida H, Yanagi H, Yura T, Mori K. Mammalian transcription factor ATF6 is synthesized as a transmembrane protein and activated by proteolysis in response to endoplasmic reticulum stress. Mol Biol Cell. 1999;10:3787–99. doi: 10.1091/mbc.10.11.3787. [DOI] [PMC free article] [PubMed] [Google Scholar]
- 5.Wang M, Kaufman RJ. Protein misfolding in the endoplasmic reticulum as a conduit to human disease. Nature. 2016;529:326–35. doi: 10.1038/nature17041. [DOI] [PubMed] [Google Scholar]
- 6.Marciniak SJ, et al. CHOP induces death by promoting protein synthesis and oxidation in the stressed endoplasmic reticulum. Genes Dev. 2004;18:3066–77. doi: 10.1101/gad.1250704. [DOI] [PMC free article] [PubMed] [Google Scholar]
- 7.Bertolotti A, Zhang Y, Hendershot LM, Harding HP, Ron D. Dynamic interaction of BiP and ER stress transducers in the unfolded-protein response. Nat Cell Biol. 2000;2:326–32. doi: 10.1038/35014014. [DOI] [PubMed] [Google Scholar]
- 8.Shen J, Chen X, Hendershot L, Prywes R. ER stress regulation of ATF6 localization by dissociation of BiP/GRP78 binding and unmasking of Golgi localization signals. Dev Cell. 2002;3:99–111. doi: 10.1016/s1534-5807(02)00203-4. [DOI] [PubMed] [Google Scholar]
- 9.Credle JJ, Finer-Moore JS, Papa FR, Stroud RM, Walter P. On the mechanism of sensing unfolded protein in the endoplasmic reticulum. Proc Natl Acad Sci U S A. 2005;102:18773–84. doi: 10.1073/pnas.0509487102. [DOI] [PMC free article] [PubMed] [Google Scholar]
- 10.Gardner BM, Walter P. Unfolded proteins are Ire1-activating ligands that directly induce the unfolded protein response. Science. 2011;333:1891–4. doi: 10.1126/science.1209126. [DOI] [PMC free article] [PubMed] [Google Scholar]
- 11.Volmer R, van der Ploeg K, Ron D. Membrane lipid saturation activates endoplasmic reticulum unfolded protein response transducers through their transmembrane domains. Proc Natl Acad Sci U S A. 2013;110:4628–33. doi: 10.1073/pnas.1217611110. [DOI] [PMC free article] [PubMed] [Google Scholar]
- 12.Wolff S, Weissman JS, Dillin A. Differential Scales of Protein Quality Control. Cell. 2014;157:52–64. doi: 10.1016/j.cell.2014.03.007. [DOI] [PubMed] [Google Scholar]
- 13.Eletto D, Dersh D, Gidalevitz T, Argon Y. Protein Disulfide Isomerase A6 Controls the Decay of IRE1alpha Signaling via Disulfide-Dependent Association. Mol Cell. 2014;53:562–76. doi: 10.1016/j.molcel.2014.01.004. [DOI] [PMC free article] [PubMed] [Google Scholar]
- 14.Lee S, et al. Thioredoxin-interacting protein regulates protein disulfide isomerases and endoplasmic reticulum stress. EMBO Mol Med. 2014;6:732–43. doi: 10.15252/emmm.201302561. [DOI] [PMC free article] [PubMed] [Google Scholar]
- 15.Groenendyk J, et al. Interplay between the oxidoreductase PDIA6 and microRNA-322 controls the response to disrupted endoplasmic reticulum calcium homeostasis. Sci Signal. 2014;7:ra54. doi: 10.1126/scisignal.2004983. [DOI] [PMC free article] [PubMed] [Google Scholar]
- 16.Lynch JM, et al. A thrombospondin-dependent pathway for a protective ER stress response. Cell. 2012;149:1257–68. doi: 10.1016/j.cell.2012.03.050. [DOI] [PMC free article] [PubMed] [Google Scholar]
- 17.Hirate Y, Okamoto H. Canopy1, a novel regulator of FGF signaling around the midbrain-hindbrain boundary in zebrafish. Curr Biol. 2006;16:421–7. doi: 10.1016/j.cub.2006.01.055. [DOI] [PubMed] [Google Scholar]
- 18.Bornhauser BC, Olsson PA, Lindholm D. MSAP is a novel MIR-interacting protein that enhances neurite outgrowth and increases myosin regulatory light chain. J Biol Chem. 2003;278:35412–20. doi: 10.1074/jbc.M306271200. [DOI] [PubMed] [Google Scholar]
- 19.Guo J, et al. A secreted protein (Canopy 2, CNPY2) enhances angiogenesis and promotes smooth muscle cell migration and proliferation. Cardiovasc Res. 2015;105:383–93. doi: 10.1093/cvr/cvv010. [DOI] [PubMed] [Google Scholar]
- 20.Guo J, et al. Canopy 2 attenuates the transition from compensatory hypertrophy to dilated heart failure in hypertrophic cardiomyopathy. Eur Heart J. 2015;36:2530–40. doi: 10.1093/eurheartj/ehv294. [DOI] [PMC free article] [PubMed] [Google Scholar]
- 21.Zhang K, et al. The unfolded protein response transducer IRE1alpha prevents ER stress-induced hepatic steatosis. EMBO J. 2011;30:1357–75. doi: 10.1038/emboj.2011.52. [DOI] [PMC free article] [PubMed] [Google Scholar]
- 22.Cinaroglu A, Gao C, Imrie D, Sadler KC. Activating transcription factor 6 plays protective and pathological roles in steatosis due to endoplasmic reticulum stress in zebrafish. Hepatology. 2011;54:495–508. doi: 10.1002/hep.24396. [DOI] [PMC free article] [PubMed] [Google Scholar]
- 23.Rutkowski DT, et al. UPR pathways combine to prevent hepatic steatosis caused by ER stress-mediated suppression of transcriptional master regulators. Dev Cell. 2008;15:829–40. doi: 10.1016/j.devcel.2008.10.015. [DOI] [PMC free article] [PubMed] [Google Scholar]
- 24.Ji C, et al. Liver-specific loss of glucose-regulated protein 78 perturbs the unfolded protein response and exacerbates a spectrum of liver diseases in mice. Hepatology. 2011;54:229–39. doi: 10.1002/hep.24368. [DOI] [PMC free article] [PubMed] [Google Scholar]
- 25.Seo J, et al. Atf4 regulates obesity, glucose homeostasis, and energy expenditure. Diabetes. 2009;58:2565–73. doi: 10.2337/db09-0335. [DOI] [PMC free article] [PubMed] [Google Scholar]
- 26.Tsukumo Y, et al. TBL2 is a novel PERK-binding protein that modulates stress-signaling and cell survival during endoplasmic reticulum stress. PLoS One. 2014;9:e112761. doi: 10.1371/journal.pone.0112761. [DOI] [PMC free article] [PubMed] [Google Scholar]
- 27.Yan W, et al. Control of PERK eIF2alpha kinase activity by the endoplasmic reticulum stress-induced molecular chaperone P58IPK. Proc Natl Acad Sci U S A. 2002;99:15920–5. doi: 10.1073/pnas.252341799. [DOI] [PMC free article] [PubMed] [Google Scholar]
- 28.Goodall JC, et al. Endoplasmic reticulum stress-induced transcription factor, CHOP, is crucial for dendritic cell IL-23 expression. Proc Natl Acad Sci U S A. 2010;107:17698–703. doi: 10.1073/pnas.1011736107. [DOI] [PMC free article] [PubMed] [Google Scholar]
- 29.Chami M, et al. Role of SERCA1 truncated isoform in the proapoptotic calcium transfer from ER to mitochondria during ER stress. Mol Cell. 2008;32:641–51. doi: 10.1016/j.molcel.2008.11.014. [DOI] [PMC free article] [PubMed] [Google Scholar]
- 30.Ron D, Walter P. Signal integration in the endoplasmic reticulum unfolded protein response. Nat Rev Mol Cell Biol. 2007;8:519–29. doi: 10.1038/nrm2199. [DOI] [PubMed] [Google Scholar]
- 31.Yamamoto K, Yoshida H, Kokame K, Kaufman RJ, Mori K. Differential contributions of ATF6 and XBP1 to the activation of endoplasmic reticulum stress-responsive cis-acting elements ERSE, UPRE and ERSE-II. J Biochem. 2004;136:343–50. doi: 10.1093/jb/mvh122. [DOI] [PubMed] [Google Scholar]
- 32.Lee JS, et al. Pharmacologic ER stress induces non-alcoholic steatohepatitis in an animal model. Toxicol Lett. 2012;211:29–38. doi: 10.1016/j.toxlet.2012.02.017. [DOI] [PMC free article] [PubMed] [Google Scholar]
- 33.Teske BF, et al. The eIF2 kinase PERK and the integrated stress response facilitate activation of ATF6 during endoplasmic reticulum stress. Mol Biol Cell. 2011;22:4390–405. doi: 10.1091/mbc.E11-06-0510. [DOI] [PMC free article] [PubMed] [Google Scholar]
- 34.Malhi H, Gores GJ. Molecular mechanisms of lipotoxicity in nonalcoholic fatty liver disease. Semin Liver Dis. 2008;28:360–9. doi: 10.1055/s-0028-1091980. [DOI] [PMC free article] [PubMed] [Google Scholar]
- 35.Lee AH, Scapa EF, Cohen DE, Glimcher LH. Regulation of hepatic lipogenesis by the transcription factor XBP1. Science. 2008;320:1492–6. doi: 10.1126/science.1158042. [DOI] [PMC free article] [PubMed] [Google Scholar]
- 36.Yamamoto K, et al. Induction of liver steatosis and lipid droplet formation in ATF6alpha-knockout mice burdened with pharmacological endoplasmic reticulum stress. Mol Biol Cell. 2010;21:2975–86. doi: 10.1091/mbc.E09-02-0133. [DOI] [PMC free article] [PubMed] [Google Scholar]
- 37.Woehlbier U, Hetz C. Modulating stress responses by the UPRosome: a matter of life and death. Trends Biochem Sci. 2011;36:329–37. doi: 10.1016/j.tibs.2011.03.001. [DOI] [PubMed] [Google Scholar]
- 38.Liu B, et al. Folding of Toll-like receptors by the HSP90 paralogue gp96 requires a substrate-specific cochaperone. Nat Commun. 2010;1 doi: 10.1038/ncomms1070. doi: 101038/ncomms1070. [DOI] [PMC free article] [PubMed] [Google Scholar]
- 39.Mehlem A, Hagberg CE, Muhl L, Eriksson U, Falkevall A. Imaging of neutral lipids by oil red O for analyzing the metabolic status in health and disease. Nat Protoc. 2013;8:1149–54. doi: 10.1038/nprot.2013.055. [DOI] [PubMed] [Google Scholar]
- 40.Severgnini M, et al. A rapid two-step method for isolation of functional primary mouse hepatocytes: cell characterization and asialoglycoprotein receptor based assay development. Cytotechnology. 2012;64:187–95. doi: 10.1007/s10616-011-9407-0. [DOI] [PMC free article] [PubMed] [Google Scholar]
Associated Data
This section collects any data citations, data availability statements, or supplementary materials included in this article.
Supplementary Materials
Data Availability Statement
Uncropped images of western blots and qPCR gels are in the Supplementary dataset 1. Source data for Figure 1c, 1d, 2a, 2e, 5d, Supplementary Figure 1d, 1e, 2a, 2b, 2c are available with the paper online. All protocols and other data in this study are available from the authors upon reasonable request.