Abstract
Hounsfield Units (HU) are used clinically in differentiating tissue types in a reconstructed CT image, and therefore the HU accuracy of a system is important, especially when using multiple sources, novel detector and non-traditional trajectories. Dedicated clinical breast CT (BCT) systems therefore should be similarly evaluated. In this study, uniform cylindrical phantoms filled with various uniform density fluids were used to characterize differences in HU values between simple circular and complex 3D (saddle) orbits. Based on ACR recommendations, the HU accuracy, center-to-edge variability within a slice, and overall variability within the reconstructed volume were characterized for simple and complex acquisitions possible on a single versatile BCT system. Results illustrate the statistically significantly better performance of the saddle orbit, especially close to the chest and nipple regions of what would clinically be a pendant breast volume. The incomplete cone beam acquisition of a simple circular orbit causes shading artifacts near the nipple, due to insufficient sampling, rendering a major portion of the scanned phantom unusable, whereas the saddle orbit performs exceptionally well and provides a tighter distribution of HU values throughout the reconstructed volumes. This study further establishes the advantages of using 3D acquisition trajectories for breast CT as well as other applications by demonstrating the robustness of HU values throughout large reconstructed volumes.
Keywords: Breast CT, complex trajectories, HU, 3D sampling
1. Introduction
The quality of images and accuracy of CT Hounsfield Unit (HU) values of different scanned targets are important metrics to determine the performance of any cone beam CT (CBCT) system. HU values provide a standardized scale, across different CT imaging systems, corresponding to a physical radio density, i.e. radiographically different type of tissue [1–5]. HU values are a linear transformation of attenuation coefficients with respect to water, which assists radiologists to identify and characterize differences between radiographically similar tissues [2]. Furthermore, it is important to remember that classically the transformation to HU is performed with polychromatic x-ray beams that measure both the water-filled structure of interest, and is compared under similar measurement conditions with the unknown biological (patient) distribution. For any reconstructed CT volume, the HU value at a voxel of interest can be calculated as follows:
| (1) |
where, μmeasured is the effective linear attenuation coefficient of the voxel under consideration, μWater is the effective linear attenuation coefficient of water measured under the same imaging conditions. The HU for distilled water is defined as 0, and that for air is defined as −1000.
HU values depend on a number of factors like x-ray beam spectral energy distribution, scattered radiation, beam hardening, and reconstructed image artifacts. Since x-ray beams used in CT are not monochromatic, the incident x-ray spectra, and subsequent beam hardening inherently affect HU values. Simply put, objects of different size but otherwise identical properties will yield images with different average HU values; moreover, the gray level distribution (and contrast and noise) between those objects will be different. Scattered radiation, especially in cone beam imaging, and the accuracy of the scatter correction method employed would also affect HU values; these differences can be easily characterized. Previous work by our group has investigated the accuracy of reconstructed linear attenuation coefficients of various breast tissue types imaged with quasi-monochromatic cone beam CT (CBCT), following beam stop array (BSA) scatter correction [6]. Results showed that reconstructed attenuation coefficients were within 8% of standard NIST reported values, and for densities lower than water within 5% [6, 7]. The dependence of scatter corrected attenuation coefficients on object diameter has also been previously investigated [8]. The study reported a linear increase in attenuation coefficients with reduction in object diameter. However, these studies did not consider the effect of different acquisition orbits on linear attenuation coefficients. For tilted trajectories, as the polar tilt angle of the system changes, the angle of incidence of the x-ray beam changes, thereby changing the path lengths of the x-rays incident on the target volume [28, 30]. This results in differences in the dose distribution [9], and scatter distribution [10], which in turn would affect the reconstructed absolute attenuation coefficients and thereby the HU values.
Commercial CBCT systems developed by different manufacturers use system specific offset, gain, scatter, and artifact correction protocols, which are usually proprietary. In addition to different image correction and reconstruction methods, the quality of reconstructed images within each individual system also depends on a combination of system geometry and x-ray technique factors. These system specific differences alone result in a large variability in HU values, making it difficult to determine specific materials based on absolute HU values alone [11]. In order to standardize the image quality (including HU values) obtained across different systems, and to establish clinically acceptable limits for HU variation, the American College of Radiology (ACR) has developed a CT accreditation program and associated guidelines for narrow beam CT [12]. The guidelines recommend scanning the 20 cm diameter ACR CT accreditation phantom (Model 464, Gammex Inc, Middleton, WI) which is designed to measure HU accuracy, low contrast resolution, uniformity and noise measurements, under different clinically used adult and pediatric acquisition protocols.
The ACR guidelines state that, regardless of acquisition protocols, average water HU values measured on the water insert should be within ±7 HU. Additionally, the center to edge uniformity in a coronal slice should be within ±5 HU of the mean measured in the center. However similar guidelines for multi-detector row (wide angle) CBCT systems are currently non-existent. The CT guidelines cannot be directly applied to CBCT systems due to a large difference in scatter radiation, which is much higher for wide cone angle x-ray beams; the reconstruction algorithms used for CBCT systems are also necessarily different, and substantially increase image noise [13, 14]. Various manufacturers and other authors have experimentally determined some quality assurance (QA) guidelines and a range of image quality values that CBCT systems can comply with [15–17]. Hobson et al. [16] have recently also published similar guidelines for CBCT systems wherein they suggest an acceptable range of ±16 HU for water in a reconstructed volume, and ±22 HU variation from center to edge in a coronal slice. This study aims to characterize the HU values of a dedicated and versatile BCT system and more importantly, tease out acquisition trajectory related differences in HU variability and uniformity for various cylindrical phantoms of different sizes and range of clinically viable breast densities.
2. Materials and methods
2.1. Cylindrical phantom measurements
In order to make a robust measurement of HU uniformity, three uniform cylinders of different sizes (15, 12.5, 10 cm diameters and 20 cm height) filled with three different water-methanol mixtures (Table 1) were scanned using the dedicated breast CT system extensively described in previous publications [9, 10, 18]. The PMMA cylinders with uniform 3 mm thick walls around and on bottom were placed at the center of the rotational axis (70 cm SID) with the fluid level above the top of the 32 degree x-ray cone beam, and 240 total projections were acquired over 360 azimuthal angles. CT scans were performed with two different acquisition orbits (±15° saddle and simple azimuthal orbit (AZOR), Fig. 1) for all phantom diameter and density conditions. The AZOR orbit used for this study had a 6.5 degree fixed tilt, similar to other breast CT systems that incorporate a fixed tilt, in order to get the top plane of the cone beam nearly perpendicular to the flat panel detector [19–24].
Table 1.
Water-Methanol concentrations, densities and corresponding NIST reported values at 40 keV. Glandular and Adipose breast tissue densities and mass attenuation coefficients reported by Johns and Yaffe [32]
| Water (%) | Methanol (%) | Density (g/cm3) | Mass Atten. (cm2/g) | Linear Atten. Coeff (cm−1) |
|---|---|---|---|---|
| 100 | 0 | 1.00 | 0.268 | 0.268 |
| 75 | 25 | 0.93 | 0.263 | 0.249 |
| 50 | 50 | 0.896 | 0.257 | 0.230 |
| Glandular Tissue | 1.035 | 0.261 | 0.270 | |
| Adipose Tissue | 0.928 | 0.239 | 0.228 |
Fig. 1.

(LEFT) Illustration depicting the tilt capable BCT system where the X-ray source – flat panel detector pair is capable of polar tilting up to ±15°. (RIGHT) Polar plot depicting the fixed tilt (+6.5°) AZOR and Saddle orbit with ±15° polar tilts about a 360° azimuthal trajectory. Radius indicates tilt angle.
The x-ray technique factors were set to 49 kVp, 1.25 mAs per projection, with 0.005 cm W filtration. The projection images were scatter corrected using a BSA scatter correction method [6, 25], and reconstructed using an iterative, OSC algorithm [26] to a 768 768 × 768 image volume of linear attenuation coefficients, having 0.388 mm voxels. Twenty five×(25) artifact free slices, near the 3D center of the phantom, near the level of the central x-ray beam, were used to avoid any cone beam artifacts introduced by the diverging beam when measuring μWater. A circular ROI, having an ACR recommended [12] area of ~400 mm2, was used to measure the average μWater (Fig. 2). These μWater values were used to convert the attenuation coefficients of individual reconstructed volumes to HU.
Fig. 2.
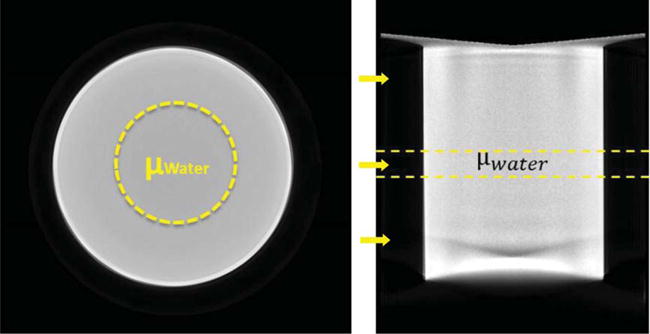
Reconstructed (LEFT) Coronal and (RIGHT) Sagittal slices of an example cylindrical phantom reconstruction from AZOR acquired data, depicting the 400 mm2 ROIs used to measure the average attenuation coefficient of water in the central, artifact-free region of the volume. Yellow arrows indicate locations of slices 150, 350 and 500 (Top to Bottom) where histograms were measured.
2.2. HU variability & accuracy - entire volume
The HU variability throughout the entire volume was determined by measuring the average HU in every slice. A MATLAB based algorithm was developed to measure circular ROIs encompassing about 70% of the coronal slice (not explicitly shown here, but similar to Fig. 2 above) and measuring the average HU, slice by slice, throughout the entire volume. The ACR does not specify any guidelines for slice by slice HU variability measurements in a reconstructed volume. However, since we used uniform cylindrical phantoms filled with variable aqueous densities, we performed slice by slice measurements in order to investigate location and trajectory related differences throughout the entire volume. The measurements were repeated for all water filled phantoms of different diameters. HU variability throughout the volume was determined as the range of average HU values recorded across all slices. Locations of the slices were selected to include the cone beam artifacts near the top and the bottom, thereby allowing comparison between HU distributions for AZOR and saddle orbits. Histograms were measured at three coronal slices across the volume: top (slice 150), mid (slice 350) and bottom (slice 500) (Fig. 2, Right). Note that the 12.5 cm cylinder was positioned lower in the FOV compared to the other phantoms; this was unintentional from a setup point of view, however it resulted in the bottom of the cylinder positioned around slice 530.
Another metric evaluated was the HU accuracy, in order to compare our results with ACR recommended values. For HU accuracy measurements, the ACR recommends measuring a 200 mm2 ROI on the reconstructed water insert of the HU accuracy module. These measurements are generally made on data acquired with the Gammex phantom centered in the CT FOV, after applying all system corrections, in order to obtain an artifact free coronal slice. Since we used uniform water filled-cylinders, HU accuracy measurements were made using a 400 mm2 ROI, on an artifact free coronal slice in the center of the volume – slice 350 (Fig. 2, Right).
To verify statistical significance of the HU values obtained from the saddle and AZOR acquisitions, the average HU measured in every slice was compared using Levene’s inferential statistical test for assessing the difference in uniformity between the two orbits. The test was repeated for the different diameter cylinders filled with different densities – 9 total data sets, and a significance criterion of p < 0.01 was used to determine statistical significance.
2.3. HU uniformity - center to edge
In addition to characterizing the HU variability and accuracy, the uniformity of HU values within a coronal slice also needs to be investigated. The ACR guidelines for (non-cone beam) CT recommend using circular ROIs ~200 mm2 in area, on a 10 mm thick coronal slice of the volume, at one center position and 4 edge positions (Fig. 3 Left). The centers of the edge ROIs were manually placed approximately one ROI diameter away from the phantom edge. The mean HU for all 5 ROIs was recorded. The measurement was repeated at 5 different coronal slice locations between slice numbers 200–400, to obtain more robust, artifact free average values in the sagittal plane (Fig. 3). At each indicated location, an average of 25 subsequent slices was obtained to create a 10 mm thick slice for measurements.
Fig. 3.
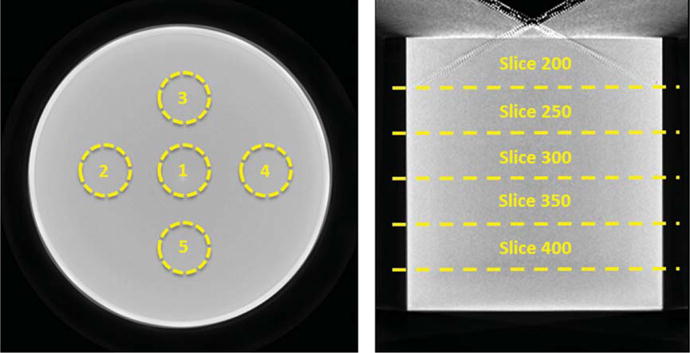
Reconstructed (LEFT) Coronal and (RIGHT) Sagittal slices of an example cylindrical phantom reconstruction, depicting the ROIs used to measure the average center to edge variation in HU values at 5 different locations in the cylinder (indicated by the slice numbers).
2.4. HU accuracy of water: Methanol mixtures
As published previously [25, 31], we use the 75:25% and 50:50% water:methanol mixtures to simulate 50:50% glandular:adipose and 100% adipose tissue compositions, respectively, given the spectrum of our x-ray source having a mean energy of 40 keV. Similar to the sections above, the HU variability in the reconstructed volume was also measured for the cylinders filled with the water: methanol mixtures (Table 1). To evaluate effect of diameter, representative histograms were also measured on the middle slice (350) of the 12.5 and 10 cm phantoms. Since methanol is not a commonly used substance in CT, there are no guidelines or recommendations for methanol HU values.
3. Results
3.1. Cylindrical phantom measurements
The reconstructed volumes of the various diameter and density cylinders are illustrated below (Figs. 4 and 5). Reconstructed cylinders acquired using the AZOR orbit have visibly worse insufficient sampling and uniformity artifacts near the top and bottom phantom regions corresponding to the “chest” and “nipple” regions, respectively, in a clinically encountered pendant breast geometry. Shading artifacts due to the edges of the cylinder and incomplete sampling there are also evident. Reconstructed volumes of cylinders acquired using the saddle orbit have visibly better sampling near the “chest” and “nipple” regions, and the shading artifacts are mitigated due to more complete sampling. The measured average attenuation coefficients of the various cylinders are reported in Table 2.
Fig. 4.
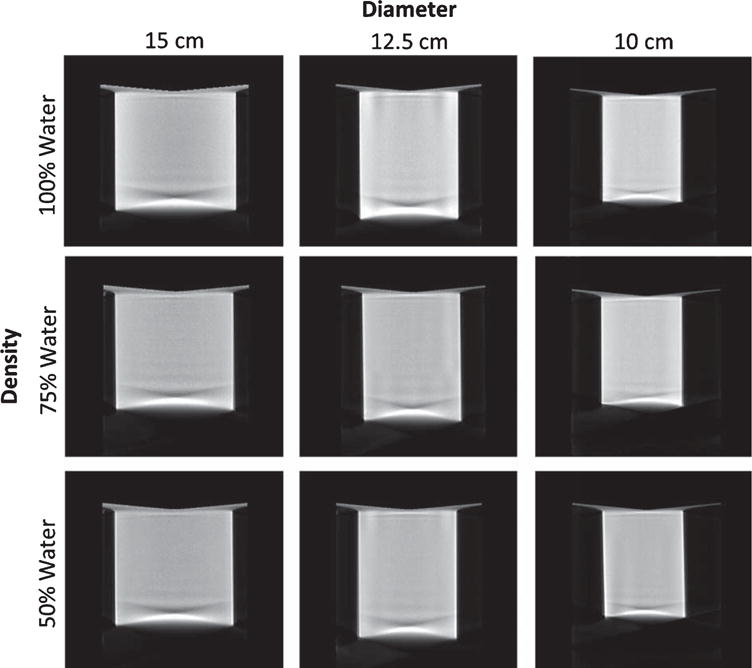
Image grid illustrating central sagittal slices of the reconstructed cylinder phantoms of different diameters, acquired with the AZOR orbit with the cylinder under different density conditions simulated using the indicated water: methanol mixtures.
Fig. 5.
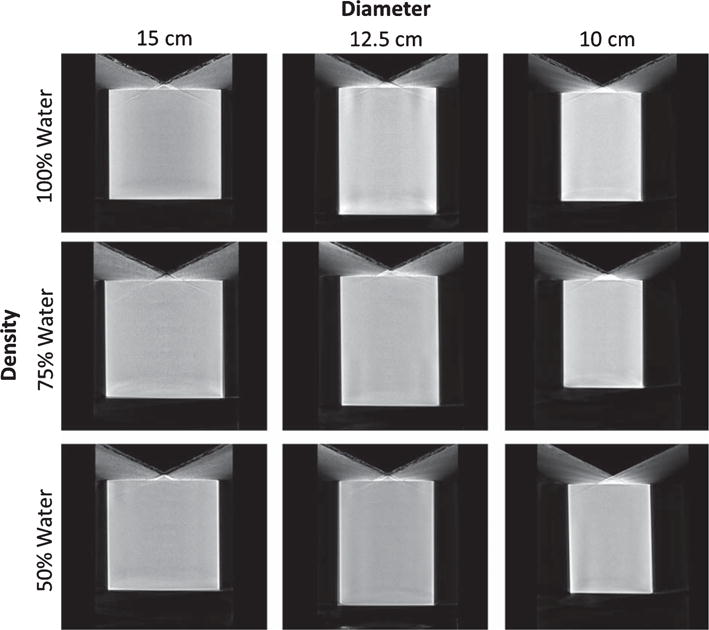
Image grid illustrating central sagittal slices of the reconstructed cylinder phantoms of different diameters, acquired with the saddle orbit with the cylinder under different density conditions simulated using the indicated water: methanol mixtures.
Table 2.
Measured average attenuation coefficients of different fluid densities, on the central artifact-free slices of the reconstructed volumes, for the three different diameter cylinder phantoms, acquired with different trajectories. Corresponding NIST values at 40 keV are also reported for comparison
| Diameter (cm) | Atten Coeff (cm−1)
|
|||||
|---|---|---|---|---|---|---|
| 100% Water
|
75% Water
|
50% Water
|
||||
| AZOR | Saddle | AZOR | Saddle | AZOR | Saddle | |
| 15 | 0.0255 | 0.0258 | 0.0249 | 0.0248 | 0.0235 | 0.0230 |
| 12.5 | 0.0259 | 0.0260 | 0.0251 | 0.0253 | 0.0239 | 0.0241 |
| 10 | 0.0267 | 0.0267 | 0.0258 | 0.0258 | 0.0243 | 0.0244 |
| NIST | 0.0268 | 0.0249 | 0.0230 | |||
3.2. HU variability & accuracy - entire volume
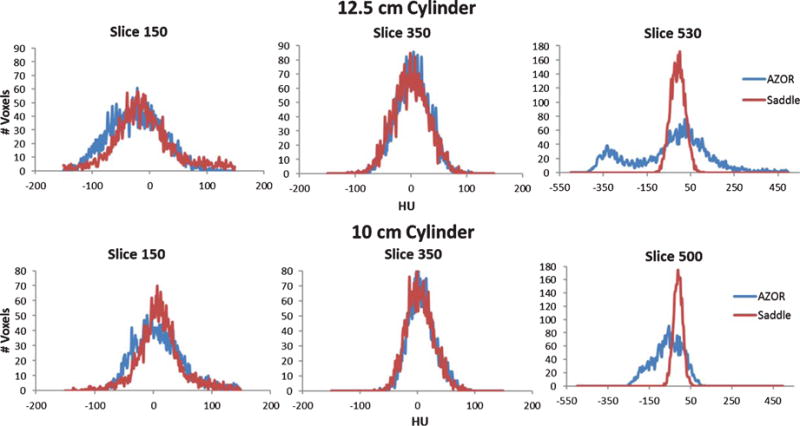
The average HU measured at each slice was plotted for the saddle and AZOR reconstructed volumes to visualize the differences in uniformity from the “chest” to the “nipple” region (Fig. 6A). In all cases, the AZOR images show non-uniformity in HU values near the top and bottom slices, whereas the saddle HU values are more uniform throughout the volume. The fixed tilt 6.5° AZOR orbit results in insufficient sampling close to the chest wall and nipple, and introduces visible cone beam sampling artifacts (Figs. 6A & 7A); as a result, the HU values close to these regions are highly variable. Near the nipple region, insufficient sampling coupled with the higher density cylindrical phantom wall (3 mm) results in amplification of the large HU variation. The higher HU values near the bottom edge are also evident in the saddle acquired volumes, where we see a peak towards the bottom few slices, followed by a sharp drop which corresponds to the transition from phantom to the air outside (HU = −1000).
Fig. 6.
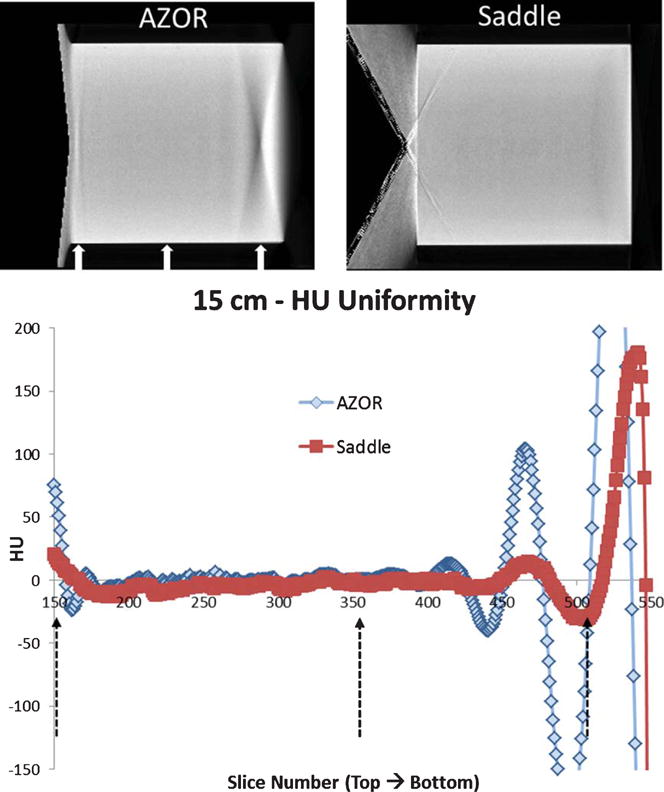

A. (Top) Central Sagittal slices of the reconstructed 15 cm diameter cylinder (rotated), filled with 100% water, acquired with the AZOR and saddle orbits. (BOTTOM) Plot of average HU measured in each slice, from the top to the bottom region of the cylinder. Dashed black arrows on the plot and white arrows on the slices indicate location of the histogrammed slices 150, 350 and 500 (Fig. 7B).
B. Histograms measured on coronal slices of the reconstructed 15 cm cylinder volumes at three different locations: (LEFT) top -slice 150, (MIDDLE) mid – slice 350 and (RIGHT) bottom – slice 500. Note that the abscissa is wider (–550–500 HU) for the bottom slice to accommodate the large variation in AZOR reconstructed values.
Fig. 7.
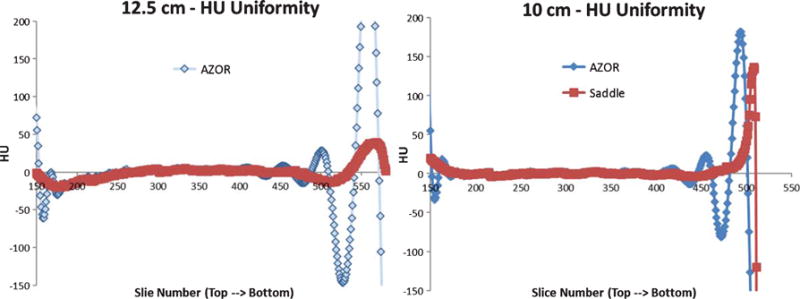
A. Plot of average HU measured in each slice, from the top to the bottom region of the cylinder, for the 12.5 and 10 cm diameter cylinders.
B. Histograms measured on coronal slices of the reconstructed (TOP) 12.5 cm and (BOTTOM) 10 cm cylinder volumes at three different locations: (LEFT) top -slice 150, (MIDDLE) mid – slice 350 and (RIGHT) bottom – slice 500/530. Note that the abscissa is wider (–550–500 HU) for the bottom slice to accommodate the large variation in AZOR reconstructed values.
Results indicate that scatter-corrected HU variation in all cylinders scanned with the AZOR orbit ranges up to ±150 HU. Comparatively, the saddle orbit samples the volume more completely and therefore has more uniform HU values near the corresponding chest and nipple regions. The highest HU variability measured for the saddle orbit was ±30 HU, for the 15 cm diameter cylinder. It is evident from Fig. 7, that the HU variability depends more on the geometry of the object, and possibly the accuracy of scatter correction method employed, than the diameter. HU accuracy however, likely depends on diameter since the smallest diameter cylinder provided closest to 0 HU values for water, regardless of orbit. Detailed results are provided in Table 3 below. Additionally, HU accuracy values align well with the ACR recommended ±7 HU and Hobson recommended ±16 HU limits.
Table 3.
HU variability and accuracy measurements, for various cylinders, measured at different slices
| Metric | Measured Slices | Phantom Diameter (cm) | AZOR | Saddle |
|---|---|---|---|---|
| HU Variability (Volume) | 150 – 500 | 15 | ±150 HU | ±30 HU |
| 150 – 530 | 12.5 | ±143 HU | ±20 HU | |
| 150 – 500 | 10 | ±140 HU | ±32 HU | |
| HU Accuracy (Central Slice) | 350 | 15 | 9 HU | −4 HU |
| 12.5 | 2 HU | −1 HU | ||
| 10 | 1 HU | 0 HU |
Levene’s statistical test was used to determine the significance in uniformity differences. Results indicate that the saddle orbit performs significantly better for the 100% water filled cylinder cases, as compared to the AZOR orbit, regardless of cylinder diameter. In every case, the test achieved a significance of p < 0.01.
3.3. HU uniformity – center to edge
The guidelines for CT recommend that HU values for all 5 ROIs must be within ±5 HU of the center ROI mean value. Similar to their recommendations for the volume, Hobson et al. [16] reported comparative recommendations for CBCT, and state that due to the higher fraction of scatter encountered in cone beam imaging, the center to edge HU variation in reconstructed image slices should be more generous, namely within ±22 HU.
Minimal variation in HU values is observed between the center and edge of the phantoms, indicating successful removal of cupping artifacts by the scatter correction process employed on our system [25] Table 4:. The variation in HU values is similar for the AZOR and saddle reconstructed volumes, and is <±27 HU in all cases, which is very close to the Hobson recommendation. Optimization of the scatter correction process, and removal of the interpolation artifacts still seen in the images, will further minimize this variation in the future. A summary of all measured HU values in the volume, and their comparison to the recommended values is provided in Table 4 below.
Table 4.
Summary of water HU accuracy and uniformity measured on corresponding the central slice, for different diameter cylinders, compared to ACR [12] and Hobson [16] recommendations
| Metric | ACR (CT) Recommendations | Hobson et al. (CBCT) Recommendations | Phantom Diameter (cm) | AZOR (HU) | saddle (HU) |
|---|---|---|---|---|---|
| HU Accuracy | ±7 HU | ±16 HU | 15 | 9 | −4 |
| 12.5 | 2 | −1 | |||
| 10 | 1 | 0 | |||
| HU Uniformity (Center to Edge) |
±5 HU | ±22 HU | 15 | ±26 | ±27 |
| 12.5 | ±19 | ±16 | |||
| 10 | ±13 | ±13 |
3.4. HU accuracy of water: Methanol mixtures
The HU variability measured slice by slice for the various cylinders filled with aqueous mixtures are illustrated in Fig. 8. As expected, since the density of these fluid mixtures is lower than that for water (Table 1), the HU values measured are negative. The insufficient sampling artifacts are visible on the AZOR volumes (Fig. 4) and result in HU variation of as high as ±200 near the nipple region. Due to the more complete sampling of the saddle orbit, this artifact is eliminated. HU variability up to ±30 can still be seen near the nipple region with the saddle scans. As in the 100% water case, the distribution of saddle HU values is tighter for the water methanol mixtures also; the extremely unreliable AZOR values near the nipple region are evident where saddle images yield more correct HU values (Fig. 8). Histograms measured at the various slices are depicted in Fig. 9.
Fig. 8.
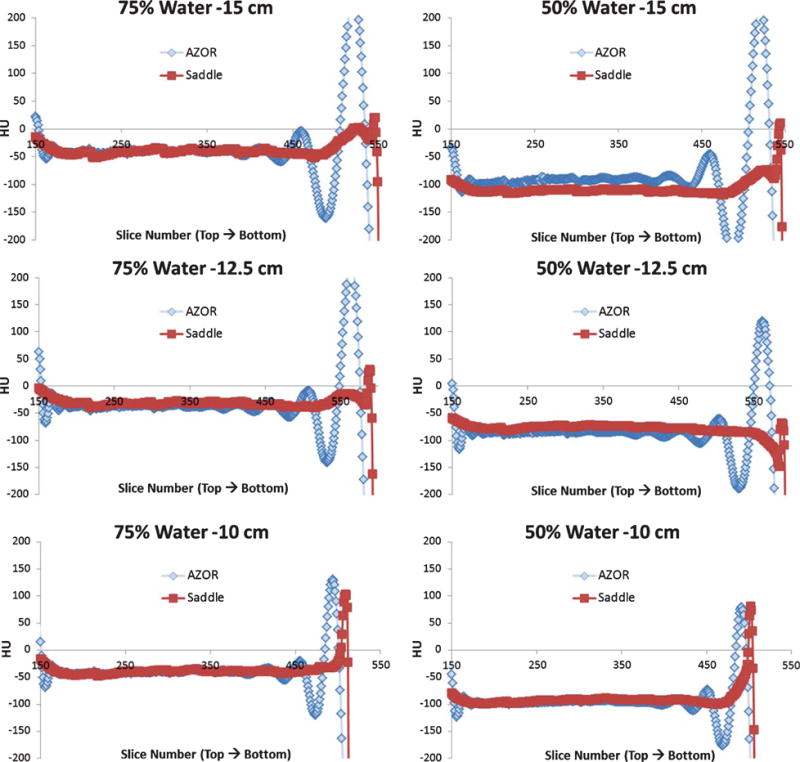
Plots of average HU measured in each slice and plotted against slice number, from the top to the bottom region of the (TOP) 15 cm, (MIDDLE) 12.5 cm and (BOTTOM) 10 cm diameter cylinder. The (LEFT) 75:25% water: methanol mixture and (RIGHT) 50:50% water: methanol mixture are illustrated alongside each other for the same diameter phantom, for easier comparison. The HU variability was measured from slice 150 to 510; however HU accuracy was measured only between slices 200 and 400 for comparison with published HU values.
Fig. 9.
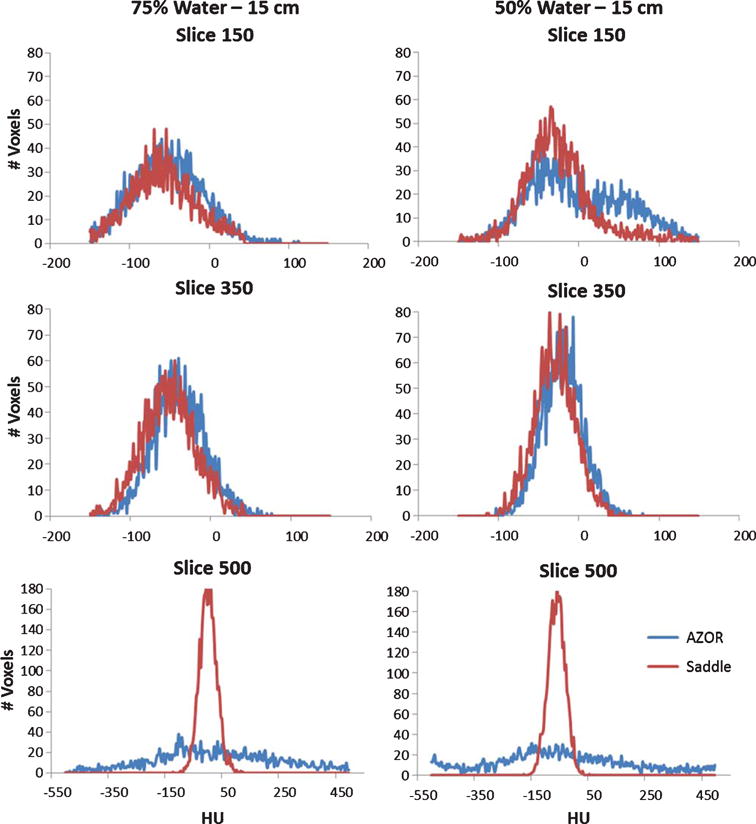
Histograms measured on coronal slices of the reconstructed 15 cm cylinder filled with (LEFT) 75% water and (RIGHT) 50% water. Measurements were made at three different locations: (TOP) top-slice 150, (MIDDLE) mid – slice 350 and (BOTTOM) bottom – slice 500. The HU value distribution within the slice is more uniform for the saddle case than the AZOR. Slice 500 measures the area affected by the shading artifact.
For HU accuracy investigation, the mean HU was measured in the artifact free central region at slice 350 (Fig. 3), and compared to the Yang et al. reported values [27]. Yang et al. reported that the measured HU values of 100% glandular, 50:50 glandular: adipose and 100% adipose tissue were approximately 46, −35 HU, and −94 HU, respectively; note that the variability of their system was not reported. These mean HU values are reported in Table 5. Overall, the average measured HU for the 75:25% water: methanol mixture which was used as a surrogate for 50:50 glandular: adipose is −35 ± 4 for AZOR and −34 ± 5 for the saddle orbit. The average measured HU for the 50:50% water: methanol mixture which was used as a surrogate for 100% adipose is −91 ± 7 and −88 ± 6 for AZOR and saddle respectively. 100% glandular tissue is higher density than 100% water; therefore, as expected the Yang et al. values for 100% glandular would be higher than the measured HU for water. These values align extremely well with the Yang reported values and thereby confirm (again, but by a different means) that water and methanol mixtures can be used as realistic surrogates for breast tissue composition [25].
Table 5.
Average measured HU for water: methanol (W:M) mixtures, at different diameters and acquisition orbits
| Composition | Phantom Diameter (cm) | AZOR (HU) | Saddle (HU) |
|---|---|---|---|
| 100:0 (W:M) | 15 | 9 | −4 |
| 12.5 | 2 | −1 | |
| 10 | 1 | 0 | |
| 75:25 (W:M) | 15 | −39 | −38 |
| 12.5 | −32 | −29 | |
| 10 | −35 | −35 | |
| 50:50 (W:M) | 15 | −98 | −91 |
| 12.5 | −85 | −82 | |
| 10 | −90 | −91 | |
| 100:0 (G:A) | 10–18 | 46 | – |
| 50:50 (G:A) | 10–18 | −35 | – |
| 0:100 (G:A) | 10–18 | −94 | – |
Average measured HU for glandular: adipose (G:A) breast tissue compositions, measured by Yang et al [27] are also reported here for comparison.
Once again, Levene’s statistical test showed that the saddle orbit performed significantly better compared to the AZOR orbit, regardless of cylinder diameter or filled fluid density. In every case, the test achieved a significance of p < 0.01.
Finally, to further characterize the distribution of HU values, the mean HU from respective histograms (Fig. 9) was calculated; measurements were performed across all sizes and densities and are reported in Table 6. The overall variability of the distribution (maximum/minimum ± HU bounds), about the mean value was also measured and is reported as the “spread” in the table below. The “mid” mean values are similar to the values reported in the table above. The bottom values for AZOR show the high variability due to the insufficient sampling artifact, rendering them useless. Overall, these values highlight the better performance of saddle orbit compared to simple circular AZOR.
Table 6.
Mean and spread (±) of the HU values, calculated from measured histograms for the three different diameter cylinders, filled with three water: methanol (W:M) mixtures
| Composition | Diameter | AZOR
|
Saddle
|
||||||||||
|---|---|---|---|---|---|---|---|---|---|---|---|---|---|
| (cm) | Top
|
Mid
|
Bottom
|
Top
|
Mid
|
Bottom
|
|||||||
| Mean | Spread | Mean | Spread | Mean | Spread | Mean | Spread | Mean | Spread | Mean | Spread | ||
| 100:0 (W:M) | 15 | 7.03 | 150.00 | 5.42 | 110.00 | −28.94 | 500.00 | −18.68 | 92.00 | −10.05 | 80.00 | 16.69 | 90.00 |
| 12.5 | −23.59 | 100.00 | 2.66 | 75.00 | −45.64 | 350.00 | −9.31 | 75.00 | −0.33 | 75.00 | −9.28 | 62.00 | |
| 10 | 8.49 | 80.00 | 7.14 | 65.00 | −62.32 | 175.00 | 10.91 | 70.00 | 4.24 | 60.00 | −11.00 | 62.50 | |
| 75:25 (W:M) | 15 | −51.23 | 100.00 | −39.69 | 85.00 | 27.67 | 400.00 | −58.51 | 90.00 | −41.82 | 70.00 | 2.40 | 85.00 |
| 12.5 | −37.99 | 110.00 | −32.26 | 65.00 | 37.72 | 350.00 | −39.17 | 90.00 | −38.96 | 65.00 | −8.61 | 70.00 | |
| 10 | −42.04 | 60.00 | −35.76 | 60.00 | 27.35 | 230.00 | −32.79 | 50.00 | −38.46 | 55.00 | −40.48 | 65.00 | |
| 50:50 (W:M) | 15 | −76.33 | 140.00 | −99.14 | 60.00 | −42.74 | 500.00 | −105.83 | 75.00 | −110.22 | 60.00 | −79.87 | 75.00 |
| 12.5 | −89.07 | 110.00 | −92.39 | 60.00 | −66.78 | 500.00 | −94.60 | 70.00 | −99.45 | 55.00 | −81.49 | 75.00 | |
| 10 | −106.24 | 65.00 | −93.58 | 95.00 | −74.30 | 380.00 | −93.43 | 60.00 | −90.42 | 82.00 | −83.46 | 65.00 | |
Top, Mid and Bottom correspond to slices 150, 350 and 500 respectively, used to measure histograms. Bottom slice values for AZOR show the highest HU spread due to the shading artifact. Saddle values overall show tighter distribution and better accuracy.
4. Discussion
A stand-alone BCT system capable of polar tilting was previously developed by our group and used for characterization of breast tissue attenuation coefficients [6]. Modulation transfer function (MTF) and sampling studies [7] were performed in the past using tilted trajectories in addition to x-ray scatter [25] and dose distribution [9] studies. We have recently also developed a tilt capable, hybrid SPECT-CT system where each modality is independently capable of traversing 3D orbits [28]. However, a comprehensive characterization of HU values for these systems having capability of different 3D trajectories, and comparison with standard metrics has never been performed for titled 3D trajectories.
Despite the immense research efforts in CBCT, there is currently no ACR accreditation program or guideline(s) in place for cone beam systems, and therefore we try to conform to the general CT guidelines wherever possible. Hobson et al. [16], recently published a study using the ACR CT accreditation phantom on CBCT systems, and proposed image quality recommendations for CBCT, after comparing 4 different radiation therapy CBCT devices. The Hobson report states that due to the high variability introduced by x-ray cone beams, the ± 7 HU limit for water is unrealistic, and therefore based on experimental measurements, suggest a range of ±16 HU for water in a reconstructed volume, and ±22 HU variation from center to edge in a coronal slice. Other vendors and authors recommend a more generous HU tolerance range of ±40 [15, 17], likely due to the difficulty in achieving tighter tolerances with broad beam x-ray spectra, even after the various corrections they employ.
The ACR accreditation phantom consists of multiple sections that can be used for quantification of various standard metrics. For HU characterization, the phantom uses a cylindrical section of water equivalent material. Cylinders filled with water would serve the same purpose as the ACR phantom; additionally, the same cylinders can be filled with different density fluids for HU characterization allowing all measurements to be made using one standardized experimental method which would be impossible with the ACR phantom since it does not include inserts for breast tissue compositions. Therefore, the different diameter cylinders filled with various fluid densities provided a more consistent measurement for HU values across different compositions.
The uniformity of CBCT HU values is largely dependent on the size of the target scanned, beam quality and subsequent beam hardening, digital projection image corrections, the reconstruction algorithm, the scatter correction technique used, etc. The results here, specifically Table 6, show that the HU values observed across different diameter cylinders are not consistent; similar to the effect of phantom diameter on Scatter to Primary Ratios [25], the HU values are also dependent on the size of the object. The HU uniformity of the CBCT portion of the hybrid system used in this study falls mostly within the ACR as well as Hobson recommendations, regardless of acquisition trajectory used.
HU variability across the volume from the clinically equivalent “chest” to “nipple” region shows large overall deviations for the AZOR acquired volumes due to insufficient sampling. Minor edge artifacts and interpolation errors due to the scatter correction process [6, 7] also amplify this variability near the bottom (“nipple”) edge of the phantoms. The shading artifact [1, 29] visible close to the nipple region is a consequence of the sharp edges and flat bottom of the cylindrical phantom that are insufficiently sampled by the simple circular orbit, and completely disappears for the saddle scans. The intensity of the shading artifact does not depend on the diameter of the cylinder, which is evident from the smallest 10 cm diameter cylinder, having a shading artifact very similar to the 15 cm cylinder. Although this artifact is unlikely for smoothly curved breast shaped objects, it is important to note that that region is insufficiently sampled with AZOR. In other words, just because a different geometric object (or one that has different frequency components [30]) might qualitatively “look better” in that same nipple region, it is nevertheless insufficiently sampled there, leading to undependable results. For larger, more cylindrical shaped breasts which occupy the complete CT FOV, similar shading artifacts can be expected when using AZOR orbits.
Yang et al. [27] have characterized the performance of a new scatter correction method for BCT, wherein they also investigate HU accuracy for different breast tissue compositions. Although those HU values are specific to their BCT system, the individual HU values can be used for comparison with the water:methanol HU values measured on our system (Table 5). The HU values obtained on this system for the water:methanol mixtures align well with the Yang et al. results and provide yet another affirmation for use of these fluid mixtures to simulate breast densities.
5. Conclusions
The HU accuracy and variability was investigated for reconstructed volumes obtained using two different acquisition orbits, using a cone beam BCT system. Different diameter cylinders, filled with water: methanol mixtures simulating breast density, were used for this study. Due to lack of any standard figure of merit for image QA in CBCT systems, we rely on standard ACR guidelines [12] and other authors’ recommendations [13–16]. The results quantitatively indicate reasonable compliance of the BCT system with the above-mentioned guidelines, as well as establish the benefits of using a saddle acquisition orbit over traditional circular orbits. For the three water-filled cylinders, slice by slice investigation of HU values was performed; the HU values are less variable for the saddle acquisitions. The AZOR orbit results in insufficient sampling near the top and bottom of the cylinder, and causes shading artifacts that amplify HU variability in these volumes to as high as ±150. Levene’s test for statistical significance showed that the saddle orbit performed significantly better (p < 0.01) for all cases, regardless of diameter or density of the phantom. The maximum variability seen in HU values with the saddle orbit was ±32. The center to edge difference for all cylinders, regardless of acquisition orbit, is less than ±27. The HU accuracy was also investigated and for the 100% water case, all measured HU values in the center of the volume, are within the recommended ACR and Hobson limits. The water: methanol mixtures were also investigated, and compared to the Yang et al. reported values for breast compositions. Overall, these results clearly demonstrate the superiority of saddle orbits in terms of both better sampling and image quality, and better HU accuracy for CBCT applications.
Acknowledgments
This work was funded by the National Cancer Institute of the National Institutes of Health (R01-CA096821), and Tornai is also supported by the Duke Dept. of Radiology. During the course of this research, Shah was supported by the Jo Rae Wright Fellowship from Duke BME and NIH T32-EB001040.
Footnotes
Disclosures
The authors have no relevant conflicts of interest to disclose.
References
- 1.Hsieh J. Computed tomography: Principles, design, artifacts, and recent advances. 2009 [Google Scholar]
- 2.Brooks RA. A quantitative theory of the Hounsfield unit and its application to dual energy scanning. Journal of Computer Assisted Tomography. 1977;1:487–493. doi: 10.1097/00004728-197710000-00016. [DOI] [PubMed] [Google Scholar]
- 3.Coolens C, Childs P. Calibration of CT Hounsfield units for radiotherapy treatment planning of patients with metallic hip prostheses: The use of the extended CT-scale. Physics in Medicine and Biology. 2003;48:1591. doi: 10.1088/0031-9155/48/11/308. [DOI] [PubMed] [Google Scholar]
- 4.Schneider U, Pedroni E, Lomax A. The calibration of CT Hounsfield units for radiotherapy treatment planning. Physics in Medicine and Biology. 1996;41:111. doi: 10.1088/0031-9155/41/1/009. [DOI] [PubMed] [Google Scholar]
- 5.Spruit M, Meijers H, Obradov M, Anderson P. CT density measurement of bone graft within an intervertebral lumbar cage: Increase of hounsfield units as an indicator for increasing bone mineral content. Journal of Spinal Disorders & Techniques. 2004;17:232–235. doi: 10.1097/00024720-200406000-00011. [DOI] [PubMed] [Google Scholar]
- 6.Madhav P, Li CM, Tornai MP. Development of in vivo characterization of breast tissues through absolute attenuation coefficients using dedicated cone-beam CT, in SPIE Medical Imaging. 2010:762209-762209-11. [Google Scholar]
- 7.Madhav P. Development and Optimization of a Dedicated Dual-Modality SPECT-CT System for Improved Breast Lesion Diagnosis, PhD Thesis, Biomedical Engineering, Duke University. 2010 [Google Scholar]
- 8.Mann S, Shah J, Tornai M. SU-E-I-02: Size-Dependent Computed Tomography Histogram Analysis: Towards Breast Tissue Segmentation. Medical Physics. 2012;39:3625–3625. doi: 10.1118/1.4734716. [DOI] [PubMed] [Google Scholar]
- 9.Shah JP, Mann SD, McKinley RL, Tornai MP. Three dimensional dose distribution comparison of simple and complex acquisition trajectories in dedicated breast CT. Medical Physics. 2015;42:4497–4510. doi: 10.1118/1.4923169. [DOI] [PMC free article] [PubMed] [Google Scholar]
- 10.Shah JP, Mann SD, McKinley RL, Tornai MP. Comparison of the effect of simple and complex acquisition trajectories on the 2D SPR and 3D voxelized differences for dedicated breast CT imaging, in. Proc of SPIE: Physics of Medical Imaging. 2014:90332L-90332L-8. [Google Scholar]
- 11.Levi C, Gray JE, McCullough E, Hattery R. The unreliability of CT numbers as absolute values. American Journal of Roentgenology. 1982;139:443–447. doi: 10.2214/ajr.139.3.443. [DOI] [PubMed] [Google Scholar]
- 12.A.C.o.R. (ACR) CT Accreditation Phantom Instructions and Guidelines. 2013 http://www.acr.org/~/media/ACR/Documents/Accreditation/CT/PhantomTestingInstruction.pdf.
- 13.Pachon J, Tornai M. SU-E-I-12: Analysis of image noise in 3D scatter corrected cone beam CT images as a function of object size. Medical Physics. 2012;39:3627–3627. doi: 10.1118/1.4734726. [DOI] [PubMed] [Google Scholar]
- 14.Yang K, Kwan AL, Huang SY, Packard NJ, Boone JM. Noise power properties of a cone-beam CT system for breast cancer detection. Medical Physics. 2008;35:5317–5327. doi: 10.1118/1.3002411. [DOI] [PMC free article] [PubMed] [Google Scholar]
- 15.Bissonnette JP, Moseley DJ, Jaffray DA. A quality assurance program for image quality of cone-beam CT guidance in radiation therapy. Medical Physics. 2008;35:1807–1815. doi: 10.1118/1.2900110. [DOI] [PubMed] [Google Scholar]
- 16.Hobson MA, Soisson ET, Davis SD, Parker W. Using the ACR CT accreditation phantom for routine image quality assurance on both CT and CBCT imaging systems in a radiotherapy environment. Journal of Applied Clinical Medical Physics. 2014;15 doi: 10.1120/jacmp.v15i4.4835. [DOI] [PMC free article] [PubMed] [Google Scholar]
- 17.Yoo S, Kim GY, Hammoud R, Elder E, Pawlicki T, Guan H, et al. A quality assurance program for the on-board imager®. Medical Physics. 2006;33:4431–4447. doi: 10.1118/1.2362872. [DOI] [PubMed] [Google Scholar]
- 18.McKinley RL, Tornai MP, Tuttle LA, Steed D, Kuzmiak CM. Development and initial demonstration of a low-dose dedicated fully 3d breast CT system, in Breast Imaging, ed: Springer. 2012:442–449. [Google Scholar]
- 19.Glick SJ, Breast CT. Annual Review of Biomedical Engineering. 2007;9:501–526. doi: 10.1146/annurev.bioeng.9.060906.151924. [DOI] [PubMed] [Google Scholar]
- 20.Sechopoulos I. X-ray scatter correction method for dedicated breast computed tomography. Medical Physics. 2012;39:2896–2903. doi: 10.1118/1.4711749. [DOI] [PMC free article] [PubMed] [Google Scholar]
- 21.Vedantham S, Shi L, Karellas A, O’Connell AM. Dedicated breast CT: Fibroglandular volume measurements in a diagnostic population. Medical Physics. 2012;39:7317–7328. doi: 10.1118/1.4765050. [DOI] [PMC free article] [PubMed] [Google Scholar]
- 22.O’Connell A, Conover DL, Zhang Y, Seifert P, Logan-Young W, Lin C-FL, et al. Cone-beam CT for breast imaging: Radiation dose, breast coverage, and image quality. American Journal of Roentgenology. 2010;195:496–509. doi: 10.2214/AJR.08.1017. [DOI] [PubMed] [Google Scholar]
- 23.Mettivier G, Russo P, Cesarelli M, Ospizio R, Passeggio G, Roscilli L, et al. Dedicated scanner for laboratory investigations on cone-beam CT/SPECT imaging of the breast. Nuclear Instruments and Methods in Physics Research Section A: Accelerators, Spectrometers, Detectors and Associated Equipment. 2011;629:350–356. [Google Scholar]
- 24.Ning R, Conover D, Lu X, Zhang Y, Yu Y, Schiffhauer L, et al. Evaluation of flat panel detector cone beam CT breast imaging with different sizes of breast phantoms, in Medical Imaging. 2005:626–636. [Google Scholar]
- 25.Shah JP, Mann SD, Tornai MP. Characterization of X-ray scattering for various phantoms and clinical breast geometries using breast CT on a dedicated hybrid system. Journal of X-Ray Science and Technology. 2017;25:373–389. doi: 10.3233/XST-16202. [DOI] [PMC free article] [PubMed] [Google Scholar]
- 26.Beekman FJ, Kamphuis C. Ordered subset reconstruction for x-ray CT. Physics in Medicine and Biology. 2001;46:1835. doi: 10.1088/0031-9155/46/7/307. [DOI] [PubMed] [Google Scholar]
- 27.Yang K, Burkett G, Jr, Boone JM. A breast-specific, negligible-dose scatter correction technique for dedicated cone-beam breast CT: A physics-based approach to improve Hounsfield Unit accuracy. Physics in Medicine and Biology. 2014;59:6487. doi: 10.1088/0031-9155/59/21/6487. [DOI] [PubMed] [Google Scholar]
- 28.Shah JP, Mann SD, McKinley RL, Tornai MP. Implementation and CT sampling characterization of a third-generation SPECT–CT system for dedicated breast imaging. Journal of Medical Imaging. 2017;4(3) doi: 10.1117/1.JMI.4.3.033502. [DOI] [PMC free article] [PubMed] [Google Scholar]
- 29.Barrett JF, Keat N. Artifacts in CT: Recognition and avoidance 1. Radiographics. 2004;24:1679–1691. doi: 10.1148/rg.246045065. [DOI] [PubMed] [Google Scholar]
- 30.Madhav P, Crotty D, McKinley R, Tornai M. Evaluation of tilted cone-beam CT orbits in the development of a dedicated hybrid mammotomograph. Physics in Medicine and Biology. 2009;54:3659. doi: 10.1088/0031-9155/54/12/004. [DOI] [PMC free article] [PubMed] [Google Scholar]
- 31.Jennings R, Bettolo C Marini, Kontson K, Beg S, Akinnagbe E. TH-E-217BCD-06: Liquids for the simulation of the X-ray properties of breast tissue. Medical Physics. 2012;39(6):4015–4015. [Google Scholar]
- 32.Johns PC, Yaffe MJ. X-ray characterisation of normal and neoplastic breast tissues. Physics in Medicine and Biology. 1987;32(6):675. doi: 10.1088/0031-9155/32/6/002. [DOI] [PubMed] [Google Scholar]


