Abstract
Introduction
GDIgA1 (galactose deficient IgA1) plays a significant role in the pathogenesis of IgA nephropathy (IgAN) and Henoch-Schönlein nephritis (HSN).
Aim of the study
The aim of this study was to assess the relevance of serum GDIgA1 level as a prognostic marker in children with IgAN and HSN.
Material and methods
41 children were included to the study group (15 IgAN, 26 HSN) and 22 to the control group. The following parameters were evaluated at baseline and endpoint: proteinuria, erythrocyturia, serum creatinine, serum IgA, GFR. A kidney biopsy was performed in all patients and evaluated according to the Oxford Classification (1 – present, 0 – absent: M – mesangial hypercellularity; E– endocapillary hypercellularity; S – segmental sclerosis/adhesion; T – tubular atrophy/interstitial fibrosis), and was calculated as the total score (sum of M, E, S, T). At the end of follow-up, the serum GDIgA1 concentration was measured.
Results
The serum GDIgA1 concentration in patients with IgAN and HSN was significantly higher than in the control group. No significant differences in mean proteinuria, erythrocyturia, GFR, MEST score, or GDIgA1 in serum, as well as the duration of follow-up between IgAN and HSN were observed. Baseline serum IgA concentration and time to kidney biopsy were significantly higher in children with IgAN than in children with HSN. We observed a positive correlation between GDIgA1 and IgA levels (r = 0.53), and GDIgA1 and serum creatinine levels (r = 0.5), as well as negative correlation between GDIgA1 and GFR (r = –0.37).
Conclusions
Serum GDIgA1 level may have a prognostic value in children with IgAN and HSN; however, to fully elucidate its clinical potential further studies performed in larger patient cohorts are required.
Keywords: galactose deficient IgA1, IgAN, HSN, children
Introduction
IgA nephropathy (IgAN) is the most common glomerulonephritis worldwide [1]. Once believed to be a mild disease with good prognosis [2], it is now considered a major cause of end-stage renal disease among young Caucasian adults [3]. Henoch-Schönlein purpura (HSP) is the most common vasculopathy in the paediatric population [4], with approximate incidence of 3-26.7/100,000 [5]. Kidney lesions may affect up to 20-55% of patients with HSP [4]. Both IgAN and HSP are characterised by similar changes in kidney biopsy [6].
The main histopathological lesion characteristic of IgAN and HSN is a domination of IgA deposits, localised mostly in the renal mesangium [4, 7]. These deposits are composed only of IgA1 subclass [7, 8]. IgA1 molecule has a hinge region, with nine potential o-glycosylation sites [9, 10]. Glycosylation is required for proper function of the antibodies and can be affected in various autoimmune disorders [10, 11]. The pathogenesis of this process is not fully understood, but it might be influenced by diet, genetics, or infections [11]. O-glycosylation of IgA1 requires the addition of N-acetyl-galactosamine (GalNAc) to serine or threonine residues of IgA1 hinge region, followed by the addition of galactose. The reaction is catalysed by β-1,3-galactosyltransferase (C1β3GalT1) [8, 10]. Finally, o-glycosylation is completed by the addition of sialic acid residues [8, 10].
Due to impaired post-translational modifications of IgA1 chain, caused by abnormal expression or activity of glycosyltransferase, the o-glycosylated part of IgA1 heavy chain hinge region lacks galactose, and N-acetylgalactosamine residues are exposed. In consequence, galactose-deficient IgA1 (Gd-IgA1) are formed [12].
Gd-IgA1 molecules have impaired spatial geometry and may stimulate the immune system to produce autoantibodies [13]. Because of antigenic mimicry, exposed N-acetylgalactosamine residues may induce production of autoantibodies after contact with certain strains of bacteria or viruses [9].
Gd-IgA1 tends to form polymeric structures [14]. Gd-IgA1 complexes have reduced liver clearance due to the large size of the complexes and because GalNAc structures, which are recognised by hepatocytes, are covered by autoantibodies [10, 13]. The complexes form deposits in glomeruli and induce inflammatory response and proliferation of mesangial cells and matrix [9]. Gd-IgA1 deposits (located mainly within mesangium and in capillaries) are specific for IgA nephropathy and Henoch-Schönlein nephritis (HSN), and their presence allows us to distinguish IgAN and HSN from other types of glomerulonephritis. Gd-IgA1 deposits colocalise with IgA deposits detected using anti-IgA polyclonal antibody [15].
High Gd-IgA1 levels as compared to the healthy population are observed in patients with IgAN and HSN, and Gd-IgA1 levels might be used to differentiate between Schönlein-Henoch purpura with and without nephropathy [16, 17]. Increased levels of Gd-IgA1 are also observed in first-degree relatives of the patients, with no statistically significant difference in Gd-IgA1 levels between the relatives and the patients [16]. Environmental impact, examined by comparing Gd-IgA1 levels between spouses and IgAN patients (living in the same household), was not statistically significant [18].
A genome-wide association study (GWAS) has shown that the GdIgA1 level is regulated independently from the IgA level [19]. The discovery of two genes, C1GALT1 located on chromosome 7p21.3 and C1GALT1C1 located on chromosome Xq24, responsible for 7% of variance in Gd-IgA1 level, has shown that genetic abnormalities might affect posttranslational modification of IgA and the level of Gd-IgA1 [19]. These genes encode β-1,3-galactosyltransferase and a protein required to maintain enzyme stability [19]. In addition, the role of these genes was confirmed with RNA interference experiments (siRNA Knock-down) [19].
The aim of this study is the assessment of serum Gd-IgA1 levels in children with IgAN and HSN and the relationship between Gd-IgA1 level and disease severity measured using selected biochemical and histopathological parameters.
Material and methods
In total, 41 children with nephropathy confirmed in kidney biopsy were included to the study (15 with IgAN and 26 with HSN). Clinical and biochemical assessment of disease activity, including proteinuria, erythrocyturia, creatinine, GFR, IgA, C3, and blood pressure, was performed at the baseline and the end of follow-up. At the end of the follow-up the serum GDIgA1 level was measured.
Proteinuria, expressed in mg/dl and in mg/kg/d in a 24-hour urine collection, was measured using the Exton method in a sample of urine. Diagnostic criterium for nephrotic proteinuria was ≥ 50 mg/kg/day, and for non-nephrotic proteinuria < 50 mg/kg/day. Erythrocyturia was diagnosed when more than 5 RBCs/hpf were present in urine sediment (in light microscopy, 400× magnification). Creatinine was measured in serum by dry chemistry (Vitros, Ortho Clinical Diagnostics), and GFR was calculated using the Schwartz formula. Serum IgA, IgG, and IgM levels were measured by nephelometry. Normal values were adjusted for age. Serum level of C3 and C4 complement fragments was measured using nephelometry. The reference range was 88-147 mg/dl. Serum Gd-IgA1 levels were measured using solid phase sandwich ELISA test (Galactose-deficient IgA1 assay kit, Immuno-Biological Laboratories Co., Ltd, Japan).
Diagnostic kidney biopsy was performed in all children from the study group. The biopsies were assessed using Oxford classification (1 – present, 0 – absent: M – mesangial hypercellularity; E – endocapillary hypercellularity; S – segmental sclerosis/adhesion; T – tubular atrophy/interstitial fibrosis T0 0-25%, T1 26-50%, T2 > 50%) and were calculated as the total score (sum of M, E, S, T). At the end of follow-up, GDIgA1 concentration in serum was measured and compared with the control group, matched for age and gender.
The results were compared with a control group, consisting of 22 healthy children, matched for age and gender.
Statistics
The results were expressed as mean values with standard deviations for parameters with normal distribution, and as median values with dispersion for parameters with non-normal distribution. Normality of data was tested using Lillieforsa and Shapiro-Wolf tests. Statistical significance of differences between mean values was tested using ANOVA test for variables with normal distribution, and Kruskal-Wallis test for variables with non-normal distribution. Statistical significance of differences between two groups of symptom severity was tested using Student’s t-test (for variables with normal distributions) and Mann-Whitney test (for variables with non-normal distribution). P values < 0.05 were considered statistically significant. Student’s t-test and Wilcoxon test (for normal and non-normal distribution, respectively) were used to test differences between baseline and follow-up. Calculations were performed using Statistica 13 software.
Results
The characteristics of the study group (children with IgAN and HSN) are shown in Table 1. There were no significant differences between IgAN and HSN patients in proteinuria, erythrocyturia, GFR, MEST score, and the length of follow-up.
Table 1.
Characteristics of patients with IgAN and HSN
| Feature | IgAN | HSPN | p |
|---|---|---|---|
| Age of onset (years) | 9.96 + –4.46 | 7.24 ±3.31 | < 0.05 |
| M/F | |||
| Proteinuria (mg/kg/day) | 21.50 0.00-226.00 |
41.00 0.00-680.00 |
NS |
| GFR | 100.03 ±30.14 | 114.33 ±30.33 | NS |
| IgA | 282.44 ±85.83 | 217.48 ±113.27 | NS (p = 0.07) |
| IgG | 1050.63 ±329.99 | 864.39 ±269.35 | NS (p = 0.07) |
| IgM | 111.26 ±36.27 | 90.90 ±31.68 | NS |
| C3 | 103.37 ±22.86 | 124.68 ±25.6 | < 0.05 |
| C4 | 23.25 ±8.20 | 24.12 ±7.39 | NS |
| Time to first biopsy (years) | 1.32 ±1.64 | 0.39 ±0.85 | < 0.05 |
| MEST sc | 2.00 ±1.07 | 1.65 ±0.69 | NS |
| Follow-up time (months) | 37.27 ±30.81 | 40.91 ±24.47 | NS |
| GdIgA1 (ng/ml) | 4536.45 (710.76-8199.59) | 2517.37 (654.32-26072.10) | NS |
| GDIgA1 (ng/ml) Boys | 5146.91 (1014.03-8199.59) | 1755.79 (710.76-6831.46) | NS |
| GDIgA1 (ng/ml) Girls | 4536.45 (654.32-26072.10) | 2627.61 (1361.53-11290.10) | NS |
| GFR follow-up | 107.14 ±25.27 | 121.28 ±18.86 | < 0.05 |
| Proteinuria (mg/kg/day) follow-up | 0.00 0.00-29.60 |
0.00 0.00-96.00 |
NS |
| Creatinine follow-up | 0.64 ±0.19 | 0.50 ±0.12 | < 0.01 |
| IgA follow-up | 221.49 ±97.28 | 196.99 ±100.25 | NS |
| IgG follow-up | 1031.38 ±291.99 | 1002.88 ±180.26 | NS |
| IgM follow-up | 93.82 ±35.28 | 97.19 ±24.22 | NS |
| C3 follow-up | 89.40 ±12.98 | 93.74 ±17.42 | NS |
| C4 follow-up | 15.34 ±2.41 | 16.26 ±5.9 | NS |
| Delta proteinuria | –14.46 –206.00-0.00 |
–39.32 –680-54.00 |
NS |
| Delta GFR (follow-up time) | 0.31 ±0.92 | 0.39 ±1.07 | NS |
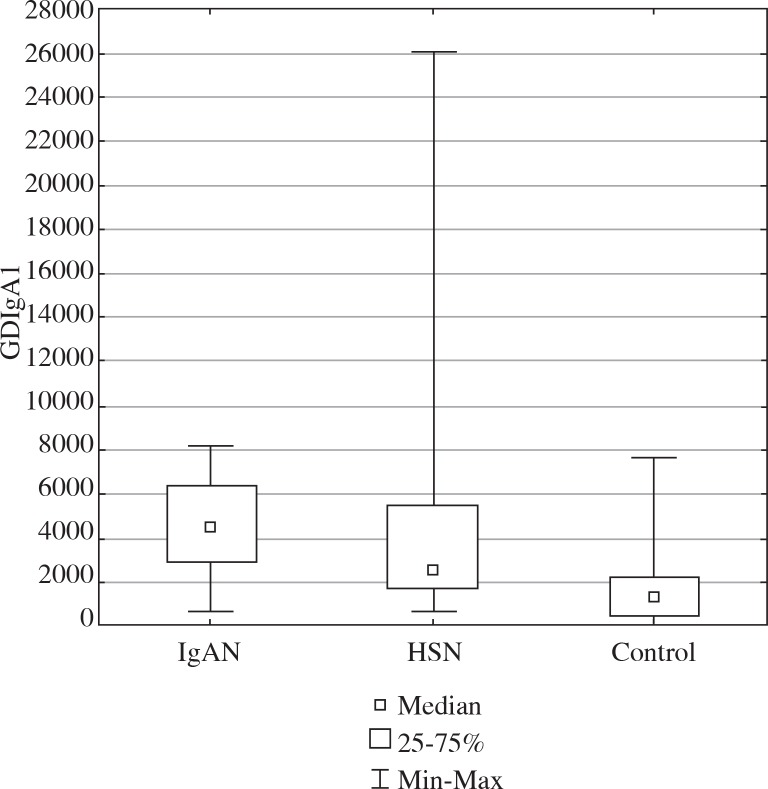
Serum IgA level at baseline and time to kidney biopsy were significantly higher in children with IgAN in comparison to children with HSN. There was no significant difference in serum GDIgA1 level in patients with IgAN and HSN (4536.45 ng/ml (710.76-8199.59) and 2517.37 ng/ml (654.32-26072.10) in IgAN and HSN, respectively) but was significantly higher than in the control group (median 1372.88; 106.86-7682.36), as shown in Figure 1.
Fig.1.
GDIgA1 in children with IgAN and HSN and in the control group
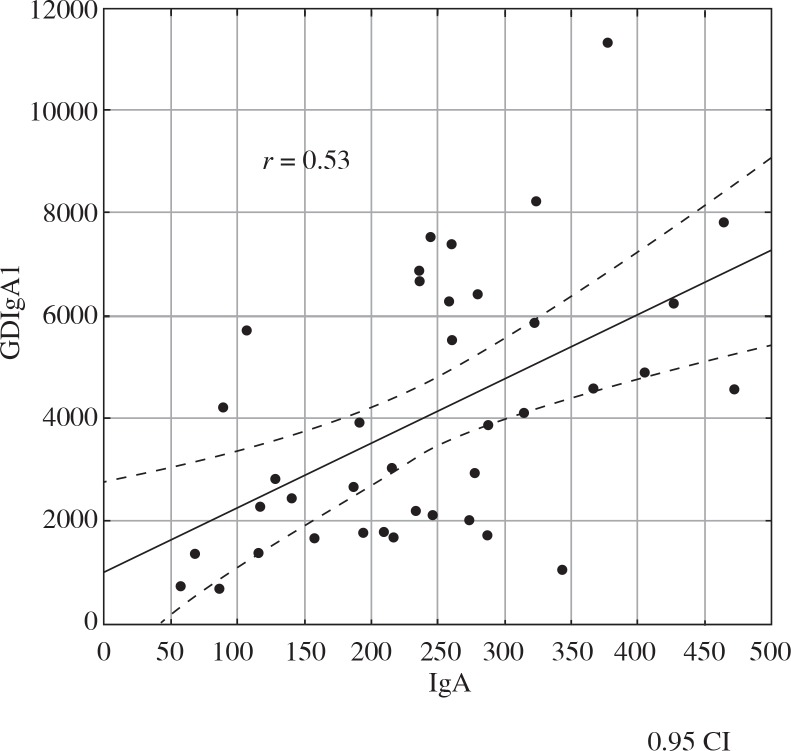
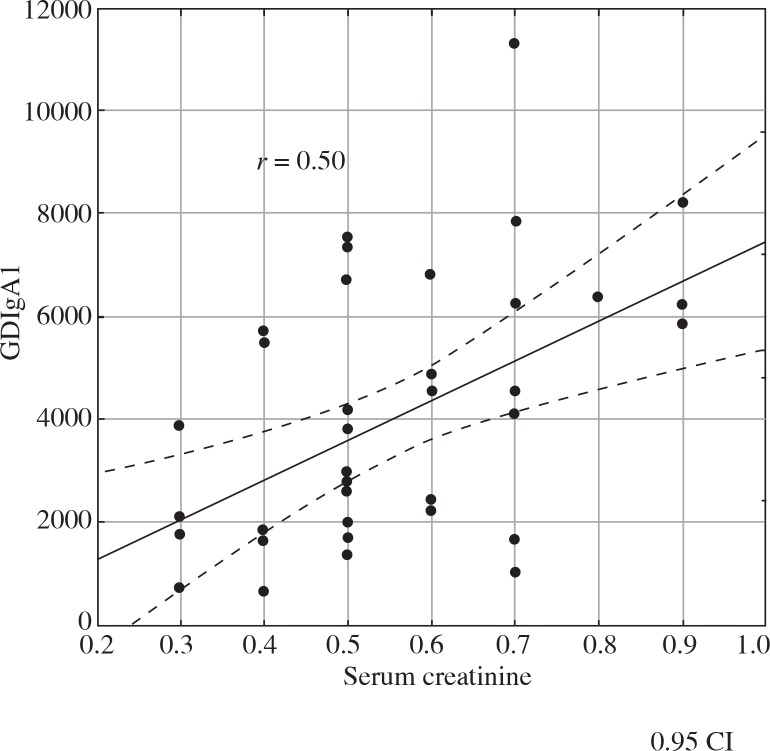
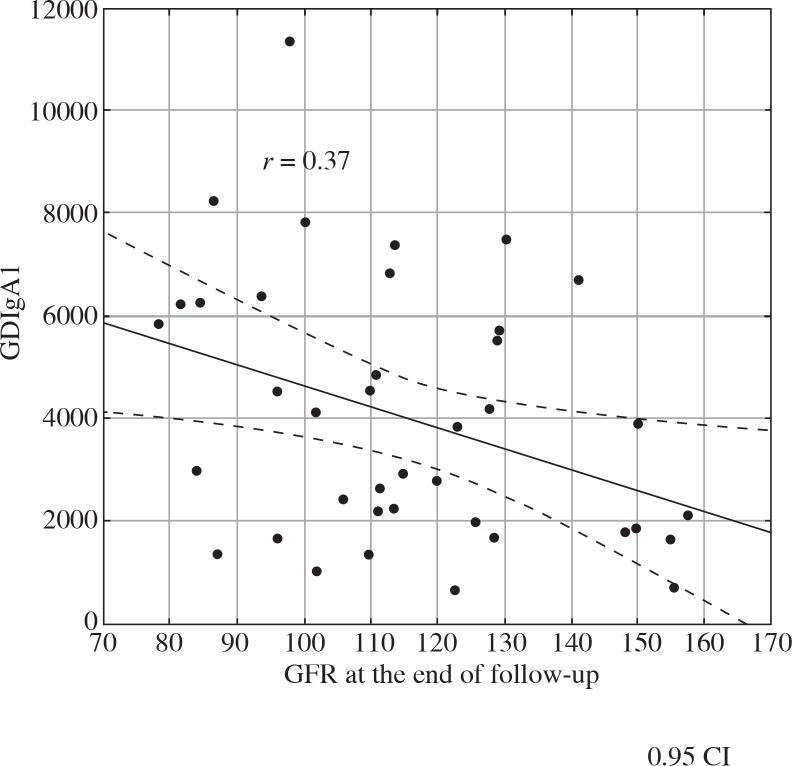
We analysed the correlation between GDIgA1 level and proteinuria, erythrocyturia, GFR, MEST score, and concentrations of immunoglobulins and complement fragments. There was a positive correlation between GDIgA1 level and IgA level at baseline (r = 0.53, Fig. 2), IgA level at the end of follow-up (r = 0.59), and between GDIgA1 and serum creatinine level (r = 0.5, Fig. 3). In addition, a negative correlation between GDIgA1 level and GFR at the end of follow-up was observed (r = –0.37, Fig. 4). There was no correlation between GDIgA1 level and proteinuria, erythrocyturia, MEST score, serum C3 and C4 (at baseline and at the end of follow-up), or hypertension in children with IgAN and HSN.
Fig. 2.
The relationship between serum GDIgA1 level and IgA level in children with IgAN and HSN
Fig. 3.
The relationship between GDIgA1 and serum creatinine at the end of follow-up in children with IgAN and HSN
Fig. 4.
The relationship between GFR and serum GDIgA1 level at the end of follow-up in children with IgAN and HSN
Table 2 shows the relationship between GDIgA1 level and the severity of the disease )nephrotic proteinuria (NoP), nephritic proteinuria (NiP), isolated haematuria (IH), and low GFR (LG)). In subgroup analysis of IgAN patients, no significant differences in GDIgA1 level in NoP, NiP, and LG subgroups were observed (IH was not taken into consideration due to the small number of patients, n = 2). GDIgA1 level in children with IgAN and nephritic proteinuria (NiP) was significantly higher than in the control group (p < 0.01).
Table 2.
The relationship between GDIgA1 level and severity of clinical symptoms at baseline in children with IgAN and HSN in comparison to a control group
| Nephrotic proteinuria (NoP) n = 4 | Nephritic proteinuria (NiP) n = 9 | Isolated haematuria (IH) n = 2 | Low GFR (LG) | p | |
|---|---|---|---|---|---|
| IgAN n = 15 | 3185.76 (710.764-6252.26) | 6210.561 (1014.03-8199.59) | 4368.25 (2897.15-5839.36) | 3185.763 (1014.03-8199.59) | < 0.01 |
| HSN n = 26 | 4371.182 (1665.38-26072.1) | 2205.66 (654.319-7369.83) | 6455.17 (1620.25-11290.1) | 5690.15 (1339.08-7817.9) | < 0.01 |
| Control (C) n = 22 | 1372.88 (106.86-7682.36) | ||||
| p | < 0.01 | < 0.01 | NS | NS | |
IgAN (NiP) vs. C
HSN (NoP) vs. C
IgAN (LG)
In subgroup analysis in HSN patients, there were no significant differences in GDIgA1 level in NoP, NiP, and LG subgroups (IH was not taken into consideration due to the small number of patients, n = 3). GDIgA1 level in children with HSN and nephrotic proteinuria (NiP) was significantly higher than in the control group (p < 0.01). In children with NoP, NiP, and LG there were no significant differences of GDIgA1 level between IgAN and HSN patients.
Discussion
In previously published studies, GDIgA1 level in adults and children with IgAN and HSN were measured using ELISA-based techniques [6, 20, 21]. In our material, GDIgA1 level in children with IgAN and HSN was significantly higher than in the control group, which was confirmed in all previously published research, and it was higher than in other types of glomerulonephritis, as was confirmed by Shimazato et al. [22]. A lack of significant differences in GDIgA1 level between children with IgAN and HSN was also shown by Lea et al., who compared GDIgA1 levels in children with IgAN, HSN, HSP, and C1q nephropathy [6].
In our study, no correlation between GDIgA1 level and clinical symptoms (nephrotic proteinuria, nephritic proteinuria, and haematuria) were observed. Similarly, in the study performed in patients with IgAN published by Jiang et al., no correlations between GDIgA1 level and isolated haematuria, haematuria and proteinuria, and nephritic syndrome were observed [21].
No correlation between GDIgA1 level and MEST score was observed. In the study by Jiang et al., who included WHO classification of histopathological lesions, no correlation between GDIgA1 level and severity of kidney biopsy lesions was observed [21].
There was no difference in concentrations between boys and girls. Similar observations were made by Moldoveau et al. in a group of adults with IgAN [20]. In our study, similarly to the results obtained by Hastings et al. in an adult population, no correlation between GDIgA1 level and proteinuria was observed [23].
Negative correlation between the serum GDIgA1 level and GFR, and a positive correlation between the serum GDIgA1 level and serum creatinine level, both in patients with IgAN and HSN, might indicate a prognostic value of GDIgA1. Similarly, Zhao et al. showed that high GDIgA1 level is an adverse prognostic factor in patients with IgAN [24].
Conclusions
Serum GDIgA1 level may have prognostic value in children with IgAN and HSN; however, to fully elucidate its clinical potential further studies performed in larger patient cohorts are required.
Footnotes
The authors declare no conflict of interest.
References
- 1.Hogg RJ. Idiopathic immunoglobulin A nephropathy in children and adolescents. Pediatr Nephrol. 2010;25:823–829. doi: 10.1007/s00467-008-1096-3. [DOI] [PMC free article] [PubMed] [Google Scholar]
- 2.Mizerska-Wasiak M. Nefropatia IgA. Nowa Pediatr. 2009;2:50–55. [Google Scholar]
- 3.Nair R, Walker PD. Is IgA nephropathy the commonest primary glomerulopathy among young adults in the USA? Kidney Int. 2006;69:1455–1458. doi: 10.1038/sj.ki.5000292. [DOI] [PubMed] [Google Scholar]
- 4.Trnka P. Henoch-Schonlein purpura in children. J Paediatr Child Health. 2013;49:995–1003. doi: 10.1111/jpc.12403. [DOI] [PubMed] [Google Scholar]
- 5.Piram M, Mahr A. Epidemiology of immunoglobulin A vasculitis (Henoch-Schonlein): current state of knowledge. Curr Opin Rheumatol. 2013;25:171–178. doi: 10.1097/BOR.0b013e32835d8e2a. [DOI] [PubMed] [Google Scholar]
- 6.Lau K, Wyatt R, Moldoveanu Z, et al. Serum levels of galactose-deficient IgA in children with IgA nephropathy and Henoch-Schonlein purpura. Pediatr Nephrol. 2007;22:2067–2072. doi: 10.1007/s00467-007-0623-y. [DOI] [PubMed] [Google Scholar]
- 7.Placzek WJ, Yanagawa H, Makita Y, et al. Serum galactose-deficient-IgA1 and IgG autoantibodies correlate in patients with IgA nephropathy. PLoS ONE. 2018;13:e0190967.. doi: 10.1371/journal.pone.0190967. [DOI] [PMC free article] [PubMed] [Google Scholar]
- 8.Berthoux F, Suzuki H, Thibaudin L, et al. Autoantibodies Targeting Galactose-Deficient IgA1Associate with Progression of IgA Nephropathy. J Am SocNephrol. 2012;23:1579–1587. doi: 10.1681/ASN.2012010053. [DOI] [PMC free article] [PubMed] [Google Scholar]
- 9.Rauen T, Floege J. Inflammation in IgA nephropathy. Pediatr Nephrol. 2017;32:2215–2224. doi: 10.1007/s00467-017-3628-1. [DOI] [PubMed] [Google Scholar]
- 10.Mestecky J, Tomana M, Moldoveanu Z, et al. Role of Aberrant Glycosylation of IgA1 Molecules in the Pathogenesis of IgA Nephropathy. Kidney Blood Press Res. 2008;31:29–37. doi: 10.1159/000112922. [DOI] [PMC free article] [PubMed] [Google Scholar]
- 11.Jennewein MF, Alter G. The Immunoregulatory Roles of Antibody Glycosylation. Trends Immunol. 2017;38:358–372. doi: 10.1016/j.it.2017.02.004. [DOI] [PubMed] [Google Scholar]
- 12.Suzuki H, Kiryluk K, Novak J, et al. The pathophysiology of IgA nephropathy. J Am Soc Nephrol. 2011;22:1795–1803. doi: 10.1681/ASN.2011050464. [DOI] [PMC free article] [PubMed] [Google Scholar]
- 13.Heineke MH, Ballering AV, Jamin A, et al. New insights in the pathogenesis of immunoglobulin Avasculitis (Henoch-Schönleinpurpura) Autoimmun Rev. 2017;16:1246–1253. doi: 10.1016/j.autrev.2017.10.009. [DOI] [PubMed] [Google Scholar]
- 14.Berthelot L, Robert T, Vuiblet V, et al. Recurrent IgA nephropathy is predicted by altered glycosylated IgA, autoantibodies and soluble CD89 complexes. Kidney Int. 2015;88:815–822. doi: 10.1038/ki.2015.158. [DOI] [PubMed] [Google Scholar]
- 15.Suzuki H, Yasutake J, Makita Y, et al. IgA nephropathy and IgA vasculitis with nephritis have a shared feature involving galactose-deficient IgA1-oriented pathogenesis. Kidney Int. 2018;93:700–705. doi: 10.1016/j.kint.2017.10.019. [DOI] [PubMed] [Google Scholar]
- 16.Kiryluk K, Moldoveanu Z, Sanders JT, et al. Aberrant glycosylation of IgA1 is inherited in both pediatric IgA nephropathy and Henoch-Schoenlein purpura nephritis. Kidney Int. 2011;80:79–87. doi: 10.1038/ki.2011.16. [DOI] [PMC free article] [PubMed] [Google Scholar]
- 17.Pillebout E, Jamin A, Ayari H, et al. Biomarkers of IgA vasculitis nephritis in children. PLoS ONE. 2017;12:e0188718.. doi: 10.1371/journal.pone.0188718. [DOI] [PMC free article] [PubMed] [Google Scholar]
- 18.Lin X, Ding J, Zhu L, et al. Aberrant galactosylation of IgA1 is involved in the genetic susceptibility of Chinese patients with IgA nephropathy. Nephrol Dial Transplant. 2009;24:3372–3375. doi: 10.1093/ndt/gfp294. [DOI] [PubMed] [Google Scholar]
- 19.Kiryluk K, Li Y, Moldoveanu Z, et al. GWAS for serum galactose-deficient IgA1 implicates critical genes of the O-glycosylation pathway. PLoS Genet. 2017;13:e1006609.. doi: 10.1371/journal.pgen.1006609. [DOI] [PMC free article] [PubMed] [Google Scholar]
- 20.Moldoveanu Z, Wyatt RJ, Lee JY, et al. Patients with IgA nephropathy have increased serum galactose-deficient IgA1 levels. Kidney Int. 2007;71:1148–1154. doi: 10.1038/sj.ki.5002185. [DOI] [PubMed] [Google Scholar]
- 21.Jiang M, Jiang X, Rong L, et al. Serum galactose-deficient IgA1 levels in children with IgA nephropathy. Int J Clin Exp Med. 2015;8:7861–7866. [PMC free article] [PubMed] [Google Scholar]
- 22.Shimozato S, Hiki Y, Odani H, et al. Serum under-galactosylated IgA1 is increased in Japanese patients with IgA nephropathy. Nephrol Dial Transplant. 2008;23:1931–1939. doi: 10.1093/ndt/gfm913. [DOI] [PubMed] [Google Scholar]
- 23.Hastings MC, Afshan S, Sanders JT, et al. Serum Galactose-Deficient IgA1 Level Is Not Associated with Proteinuria in Children with IgA Nephropathy. Int J Nephrol. 2012;2012:31546724.. doi: 10.1155/2012/315467. [DOI] [PMC free article] [PubMed] [Google Scholar]
- 24.Zhao N, Hou P, Lv J, Moldoveanu Z, Li Y, Kiryluk K. The level of galactose-deficient IgA1 in the sera of patients with IgA nephropathy is associated with disease progression. Kidney Int. 2012;82:790–796. doi: 10.1038/ki.2012.197. [DOI] [PMC free article] [PubMed] [Google Scholar]


