Abstract
MicroRNAs play an important role in the regulation of immune responses. The influence of epigenetic mechanisms, particularly RNA-mediated post-transcriptional regulation of host immune responses has been proven vital following infections by different pathogens, and bacteria can modulated host miRNAs. Global miRNA expression analysis from macrophages infected in vitro with different strains of Leptospira spp was performed using miRNA 4.1 microarray strips. Leptospirosis is a bacterial zoonosis of global importance, responsible for significant morbidity and mortality worldwide. Despite considerable advances, much is yet to be discovered about disease pathogenicity, particularly in regards to host-pathogen interactions. We present here a high-quality dataset examining the microtranscriptome of murine macrophages J774A.1 following 8h of infection with virulent, attenuated and saprophyte strains of Leptospira. Metadata files were submitted to the Gene Expression Omnibus (GEO) repository.
Subject terms: Infection, Gene silencing
Background & Summary
It is known that during bacterial infection, miRNAs play an important role in the regulation of host immune response1,2. These small molecules of 21 nucleotides have a vital function in the post-transcriptional regulation of gene expression. Through base pairing, miRNAs bind to complementary sequences of their target mRNAs leading to degradation or translational repression3–5. Each miRNA can control hundreds of target genes6. A range of pathogens (viruses, parasites and bacteria) can affect expression of host miRNA1,2,7. For this reason, pathogen-induced gene modulation of host cells is essential to understanding the pathophysiology of diseases. In this study, we evaluate, for the first time, global miRNA expression in macrophages infected with different strains of Leptospira spp.
Leptospira interrogans is a highly invasive gram-negative spirochete that leads to development of leptospirosis. These bacteria can occur in urban and rural environments, surviving mainly in water. Currently, the rate of mortality can reach 60.000 deaths per year8,9. In the literature 12 species and more than 250 serotypes of Leptospira are described, varying in pathogenicity10,11. During early infection, antibiotics are effective, however most vaccines available for veterinary use provide limited protection against more than 250 pathogenic Leptospira serovars12,13.
Macrophages are responsible for bacterial phagocytosis in mammals and are important cells in leptospiral infection14,15. Host/pathogen interaction can modify gene expression profiles in the host with leptospirosis16. Our goal was to contribute to the understanding of pathogen-mediated control of host gene expression by identifying miRNAs modulated by saprophyte, attenuated or virulent strains of Leptospira in macrophages compared to non-infected control cells. Through the use of microarray technology, we generated microtranscriptome datasets following 8 hours of infection. We worked with the hypothesis that Leptospira infection modulates macrophageal expression of miRNAS, and that bacterial virulence affects this modulation. Our study suggests that post-transcriptional regulation by miRNAs plays a role in host response to infection in leptospirosis. Here, we describe detailed information on the experimental design (Fig. 1) and generation of our datasets (Data Citation 1). This data descriptor is an extend version of the methodology described in a related paper17, with the objective of disseminating the raw data produced in this experiment. These raw data can be a valuable resource for further bioinformatics investigation of biological pathways associated with pathogenicity, leading to the identification of novel targets for therapy.
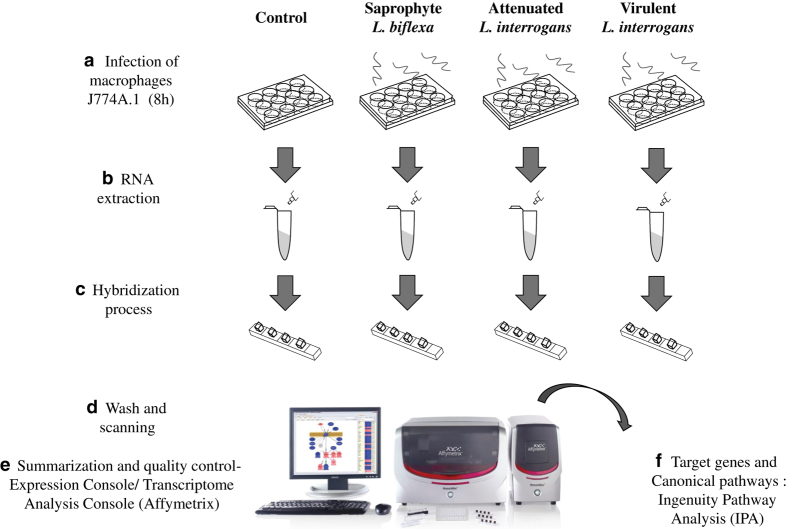
Figure 1. Illustration of experimental design.
Cell lineage J774A.1 of murine macrophages was cultured to a confluent monolayer. Infection was performed adding 100:1 bacteria:cell to the macrophages. (a) Treatments, analyzed in triplicate, were carried as follows: infection of macrophages with a virulent strain of L. interrogans, with an attenuated strain of L. interrogans, and with an saprophyte strain L. biflexa and non-infected macrophages as controls. All treatments were incubated in fresh RPMI medium, without antibiotics, for 8 h at 37 °C, 5% C02. (b) Following this period, total RNA was immediately extracted, (c,d) hybridization of samples to the strips was carried at 48 °C for 20 h, strips were then washed, stained and scanned using the GeneAtlas® System (Affymetrix). (e) Raw intensity values were background corrected, log2 transformed and then quantile normalized by the software Expression Console (Affymetrix) using the Robust Multi-array Average (RMA) algorithm. Statistical analysis was performed in the TAC software (Affymetrix) and cel files were submitted to Gene Expression Omnibus repository (GEO). (f) Target genes and Pathway analysis was performed in the Ingenuity Pathway Analysis (Qiagen).
Methods
Cell culture
Murine macrophage cell line J774A.1 was provided by the Paul Ehrlich cell bank, Rio de Janeiro, Brazil. This cell lineage was maintained in RPMI-1640 media (Sigma, USA), supplemented with 10% heat-inactivated fetal bovine serum (Gibco, USA), 100 ug/mL streptomycin (Sigma, USA), 0.03% L-glutamine solution (Sigma, USA) and 100UI/mL of penicillin. Cells were incubated at 37 °C, 5% CO2 until formation of a confluent monolayer in 6-well cell culture plates (3 cm/well).
Bacterial culture
All strains of Leptospira used in this study, Leptospira interrogans serovar Copenhageni (FIOCRUZ L1-130) as a virulent strain, L. interrogans serovar Copenhageni M20 as an attenuated strain and Leptospira biflexa serovar Patoc (FIOCRUZ -Patoc I) as a saprophyte strain, were kindly provided by the Laboratory of Preventive Veterinary Medicine of University of São Paulo (USP). Attenuation of M20 strain was done by successive passages (>200), according with reference18–20. All strains were maintained in Fletcher’s semi solid medium, and incubated at 30 °C. Virulence of L. interrogans L1-130 was preserved by intraperitoneal inoculation in hamsters (Mesocricetus auratus) with kidney recovery, following previously published guidelines19. Before infection, all strains were counted in a Petroff–Hausser counting chamber (Fisher Scientific)21. Project had the approval of the Ethics Committee for Animal Use (FOA-FMVA Unesp), under protocol number 2015-00895.
Infection of Macrophages
After the formation of monolayers with >90% confluency, cells were washed with sterile phosphate buffer solution (pH 7,2) for removal of antibiotics and non-adherent cells. L. interrogans and L. biflexa were centrifuged, for removal of their growth media, and resuspended in RPMI-1640 medium (Sigma), and added to macrophages (100:1 bacteria:cell). Experimental groups were devised as follows: infection of macrophages with a virulent strain (L. Interrogans; n=3), infection with attenuated strain (L. interrogans; n=3), infection with saprophyte strain (L. biflexa; n=3) and non-infected macrophages (control; n=3). All treatments were incubated in fresh RPMI medium, without antibiotics, for 8h at 37 °C, 5% CO2. Following this period, RNA extraction was immediately performed.
miRNA extraction and Quantification
Extraction of total RNA from macrophages was conducted using a miRVana miRNA Isolation Kit (Ambion, Austin, TX, USA) following the manufacturer’s instructions. RNA samples were immediately stored at −80 °C. Quantification was performed using a spectrophotometer (Nanodrop ND-20, Thermo Scientific, Wilmington, DE, USA) and quality of samples was assessed with capillary electrophoresis (Bioanalyzer 2100 Agilent, Santa Clara, CA, USA).
Microtranscriptome Array
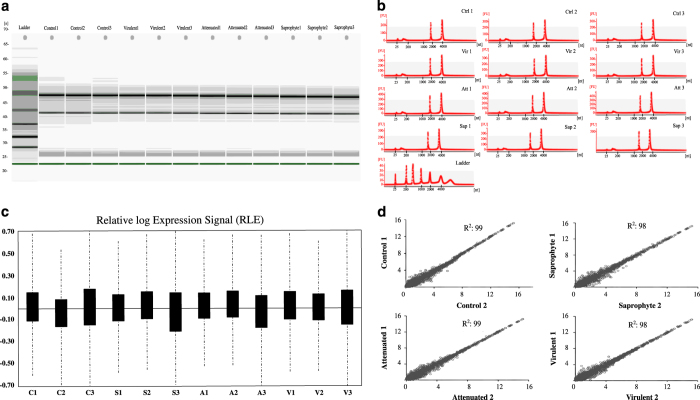
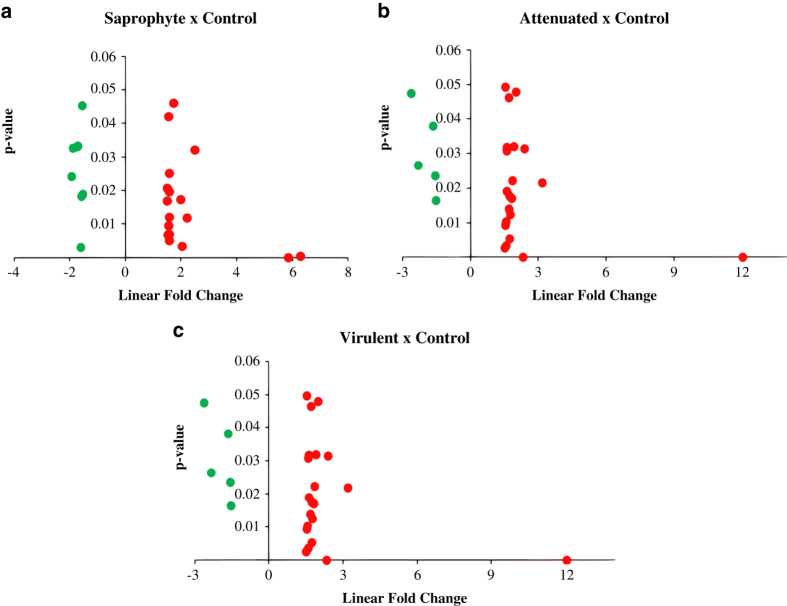
FlashTag Biotin HSR RNA Labeling Kit and the Affymetrix miRNA 4.1 Array strip (Affymetrix, Santa Clara, California, EUA) were used to analyze the expression of 3195 murine specific probes. ELOSA (enzyme-linked oligosorbent assay) quality control assay was run for all samples, and hybridization to the strips was carried at 48 °C for 20 h. Strips were processed and scanned in the GeneAtlas System (Affymetrix). Raw intensity values (cel files) were background corrected, log2 transformed and then quantile normalized by the software Expression Console (Affymetrix) using the Robust Multi-array Average (RMA) algorithm. Figure 2c shows the relative signal of probes. Also in expression console software, we performed a correlation with linearized signal intensity values for the samples within treatment groups, showing a strong correlation coefficient between samples (Fig. 2d). Figure 3 shows plots of p-values for miRNAs (p-value<0.05) up- and downregulated by the different leptospires in comparison to non-infected control samples.
Figure 2. RNA and microarray quality control and summarization.
(a,b) Bioanalyzer gel image and graphic of all RNA samples; Control (Ctrl); Virulent (Vir); Attenuated (Att) and Saprophyte (Sap), used for microarray analysis. The 28S and 18s distinctive ribosomal RNA bands are observed for all samples. (c) Values of relative log expression signal RMA-DABG between treatments. (d) Signal intensity correlation analysis within groups.
Figure 3. Distribution of differentially expressed miRNAs.
(a-c) Upregulated (red) and downregulated (green) miRNAs in macrophages infected with virulent strains compared to control non-infected, plotted by p-value <0.05 and linear fold change. (n=3/treatment).
Data Records
The cel and arr (strip information) files produced by microarray were deposited at the Gene Expression Omnibus repository (Data Citation 1). Through the Expression Console (Affymetrix), a free software, the cel files were normalized and chp file were generated for the identification of differentially expressed miRNAs. Samples used in the study are shown in Table 1.
Table 1. Dataset and sample description across treatment groups.
| GSM-ID | Sample Name | Oganism | Treatment description | Molecule | Technology |
|---|---|---|---|---|---|
| GSM2817991 | Control 1 | Mus musculus | Macrophages_non-infected_8h_rep1 | miRNA | Microarray |
| GSM2817992 | Control 2 | Mus musculus | Macrophages_non-infected_8h_rep2 | miRNA | Microarray |
| GSM2817993 | Control 3 | Mus musculus | Macrophages_non-infected_8h_rep3 | miRNA | Microarray |
| GSM2817994 | Saprophyte 1 | Mus musculus | Macrophages infected with saprophyte strain_8h_rep1 | miRNA | Microarray |
| GSM2817995 | Saprophyte 2 | Mus musculus | Macrophages infected with saprophyte strain_8h_rep2 | miRNA | Microarray |
| GSM2817996 | Saprophyte 3 | Mus musculus | Macrophages infected with saprophyte strain_8h_rep3 | miRNA | Microarray |
| GSM2817997 | Attenuated 1 | Mus musculus | Macrophages infected with attenuated strain_8h_rep1 | miRNA | Microarray |
| GSM2817998 | Attenuated 2 | Mus musculus | Macrophages infected with attenuated strain_8h_rep2 | miRNA | Microarray |
| GSM2817999 | Attenuated 3 | Mus musculus | Macrophages infected with attenuated strain_8h_rep3 | miRNA | Microarray |
| GSM2818000 | Virulent 1 | Mus musculus | Macrophages infected with virulent strain_8h_rep1 | miRNA | Microarray |
| GSM2818001 | Virulent 2 | Mus musculus | Macrophages infected with virulent strain_8h_rep2 | miRNA | Microarray |
| GSM2818002 | Virulent 3 | Mus musculus | Macrophages infected with virulent strain_8h_rep3 | miRNA | Microarray |
Technical Validation
RNA quality control
Quality control of RNA samples was performed prior to microarray experiment using capillary electrophoresis (Bioanalyzer 2100 Agilent, Santa Clara, CA, USA), using the Eukaryote Total RNA Nano kit. All samples used for microarray analysis had a RNA integrity number (RIN) of 10 (Fig. 2a,b).
Microarray summarization and quality control
The Gene Atlas equipment scans hybridized strips and converts the readings into raw intensity values (cel files). These files were background corrected, log2 transformed and then quantile normalized by the software Expression Console (Affymetrix) using the Robust Multi-array Average (RMA) algorithm. Figure 2c shows the relative signal of probes. Also in the expression console software, we performed a correlation with linearized signal intensity values for the samples within treatment groups, showing a strong correlation coefficient (R2) between samples (Fig. 2d). Figure 3 shows plots of p-values for miRNAs up and downregulated (p-value<0.05) by the different strains in comparison to non-infected control samples.
Validation of microarray results by qRT-PCR
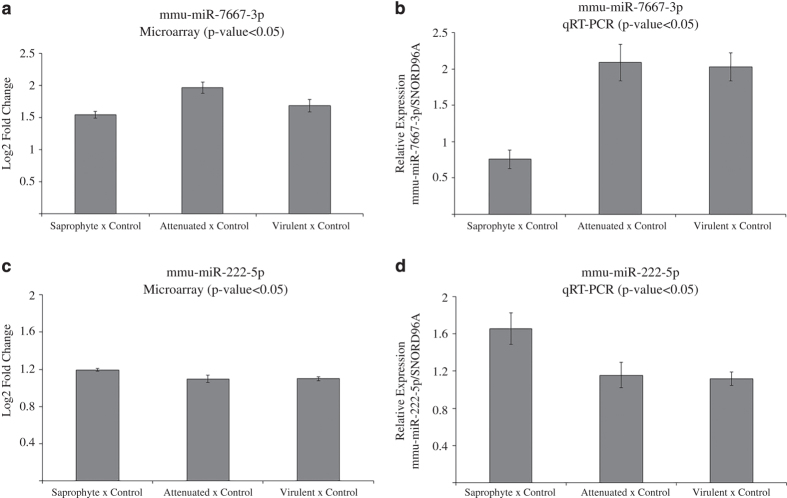
Validation of miRNAs in infected macrophages (saprophyte, attenuated and virulent strains) and non-infected controls was done using the miScript miRNA PCR System (Qiagen-Valencia, CA, USA) for preparation of cDNA and realtime PCR, according to the manufacturer’s instructions. Validated primers were purchased from Qiagen. PCR was performed using a Stratagene QPCR Systems Mx3005P (Agilent Technologies, Santa Clara, CA, USA) Expression levels were determined using standard curves at each individual run, and the expression of candidate miRNAs is presented as a ratio to the control miRNA SNORD96A. Real time PCR data were analyzed using least-squares analysis of variance and the general linear model procedures of SAS (SAS Institute, Cary, NC, USA; p<0.01). Comparison of means was done using Tukey's range test, and significance was set at p<0.05, (Fig. 4a-d).
Figure 4. Microarray and qPCR fold change values of validated miRNAs.
(a) mmu-miR-7667-3p microarray fold change. (b) mmu-miR-7667-3p qPCR fold change. (c) mmu-miR-222-5p microarray fold change. (d) mmu-miR-222-5p qPCR fold change. Quantification based on a standard curve and adjusted to SNORD96A (housekeeping). Statistical analysis between two groups (infected vs. control) was performed with ANOVA (p-value <0.0001) followed by Tukey´s Range Test.
Usage Notes
Raw data (cel files) can be normalized by Expression Console and Transcriptome Analysis Console (TAC), both are free softwares from Affymetrix. They perform statistical testing and present results as fold change for differentially expressed miRNAs. For miRNAs, TAC software can also identify target genes reported by Affymetrix (NetAffx).
Additional information
How to cite this article: Garcia, L. E. et al, microRNA profile datasets of murine macrophages infected with different strains of Leptospira spp. Sci. Data 5:180171 doi: 10.1038/sdata.2018.171 (2018).
Publisher’s note: Springer Nature remains neutral with regard to jurisdictional claims in published maps and institutional affiliations.
Supplementary Material
Acknowledgments
Financial support: Coordenação de Aperfeiçoamento de Pessoal de Nível Superior (CAPES); and Fundação de Amparo à Pesquisa do Estado de São Paulo (FAPESP)–grant 2015/14229-5.
Footnotes
The authors declare no competing interests.
Data Citations
- Garcia L. E., et al. . 2018. Gene Expression Omnibus. GSE105104
References
- Eulalio A., Schulte L. & Vogel J. The mammalian microRNA response to bacterial infections. RNA Biol. 9, 742–750 (2012). [DOI] [PubMed] [Google Scholar]
- Maudet C., Mano M. & Eulalio A. MicroRNAs in the interaction between host and bacterial pathogens. FEBS Lett. 588, 4140–4147 (2014). [DOI] [PubMed] [Google Scholar]
- Bartel D. P. MicroRNA Target Recognition and Regulatory Functions. Cell 136, 215–233 (2009). [DOI] [PMC free article] [PubMed] [Google Scholar]
- Fabian M. R. & Sonenberg N. The mechanics of miRNA-mediated gene silencing: a look under the hood of miRISC. Nat. Struct. Mol. Biol. 19, 586–593 (2012). [DOI] [PubMed] [Google Scholar]
- Huntzinger E. & Izaurralde E. Gene silencing by microRNAs: contributions of translational repression and mRNA decay. Nat. Rev. Genet. 12, 99–110 (2011). [DOI] [PubMed] [Google Scholar]
- Lim L. P. et al. Microarray analysis shows that some microRNAs downregulate large numbers of target mRNAs. Nature 433, 769–773 (2005). [DOI] [PubMed] [Google Scholar]
- Cullen B. R. Viruses and microRNAs: RISCy interactions with serious consequences. Genes Dev. 25, 1881–1894 (2011). [DOI] [PMC free article] [PubMed] [Google Scholar]
- Bharti A. R. et al. Leptospirosis: A zoonotic disease of global importance. Lancet Infectious Diseases 3, 757–771 (2003). [DOI] [PubMed] [Google Scholar]
- Costa F. et al. Global Morbidity and Mortality of Leptospirosis: A Systematic Review. PLoS Negl. Trop. Dis 9, 0–1 (2015). [DOI] [PMC free article] [PubMed] [Google Scholar]
- Smythe L. D. et al. A quantitative PCR (TaqMan) assay for pathogenic Leptospira spp. BMC Infect. Dis. 2, 13 (2002). [DOI] [PMC free article] [PubMed] [Google Scholar]
- Levett P. N. Leptospirosis: A forgotten zoonosis? Clinical and Applied Immunology Reviews 4, 435–448 (2004). [Google Scholar]
- André-Fontaine G., Branger C., Gray A. W. & Klaasen H. L. B. M. Comparison of the efficacy of three commercial bacterins in preventing canine leptospirosis. Vet. Rec. 153, 165–169 (2003). [DOI] [PubMed] [Google Scholar]
- Sonrier C. et al. Evidence of cross-protection within Leptospira interrogans in an experimental model. Vaccine 19, 86–94 (2000). [DOI] [PubMed] [Google Scholar]
- Cinco M. New insights into the pathogenicity of leptospires: Evasion of host defences. New Microbiol. 33, 283–292 (2010). [PubMed] [Google Scholar]
- Li L., Ojcius D. M. & Yan J. Comparison of invasion of fibroblasts and macrophages by high- and low-virulence Leptospira strains: Colonization of the host-cell nucleus and induction of necrosis by the virulent strain. Arch. Microbiol. 188, 591–598 (2007). [DOI] [PubMed] [Google Scholar]
- Xue F. et al. Transcriptional responses of Leptospira interrogans to host innate immunity: Significant changes in metabolism, oxygen tolerance, and outer membrane. PLoS Negl. Trop. Dis 4 (2010). [DOI] [PMC free article] [PubMed] [Google Scholar]
- Garcia L. E. et al. Characterization of the microtranscriptome of macrophages infected with virulent, attenuated and saprophyte strains of Leptospira spp 10.1371/journal.pntd.0006621 (2018). [DOI] [PMC free article] [PubMed]
- Haake D. A. et al. Changes in the surface of leptospira-interrogans serovar grippotyphosa during invitro cultivation. Infect. Immun. 59, 1131–1140 (1991). [DOI] [PMC free article] [PubMed] [Google Scholar]
- Haake D. A. Hamster Model of Leptospirosis. Curr Protoc Microbiol 12, 1–16 (2006). [DOI] [PMC free article] [PubMed] [Google Scholar]
- Matsunaga J. et al. Pathogenic Leptospira species express surface-exposed proteins belonging to the bacterial immunoglobulin superfamily. Mol. Microbiol. 49, 929–945 (2003). [DOI] [PMC free article] [PubMed] [Google Scholar]
- Faine S., Adler B., Bolin C. & Perolat P. Leptospira and Leptospirosis, MediSci (1999). [Google Scholar]
Associated Data
This section collects any data citations, data availability statements, or supplementary materials included in this article.
Data Citations
- Garcia L. E., et al. . 2018. Gene Expression Omnibus. GSE105104


