Abstract
Latimer et al. (Reports, 10 July 2015, p.184) claim that during perceptual decision formation, parietal neurons undergo one-time, discrete steps in firing rate instead of gradual changes that represent the accumulation of evidence. However, that conclusion rests on unsubstantiated assumptions about the time window of evidence accumulation, and their stepping model cannot explain existing data as effectively as evidence-accumulation models.
Latimer et al. [1] analyzed the spiking activity of neurons in the lateral intraparietal area (LIP) of parietal cortex and challenged the hypothesis that these neurons represent the accumulation of noisy evidence bearing on a perceptual choice (e.g., drift diffusion). They conclude that these neurons represent jumps (or steps) from a neutral to a high or low state that represents the upcoming choice. Accordingly, the ramp-like activity of LIP neurons is an artifact caused by averaging step functions occurring at different times. Conceptually, their step model implies that LIP activity represents either: (1) the outcome of the decision, corresponding to steps synchronized to the end of the process; or (2) the decision process itself, corresponding to the population average of all-or-none steps contributed by individual neurons at different times. Neither interpretation is consistent with existing data.
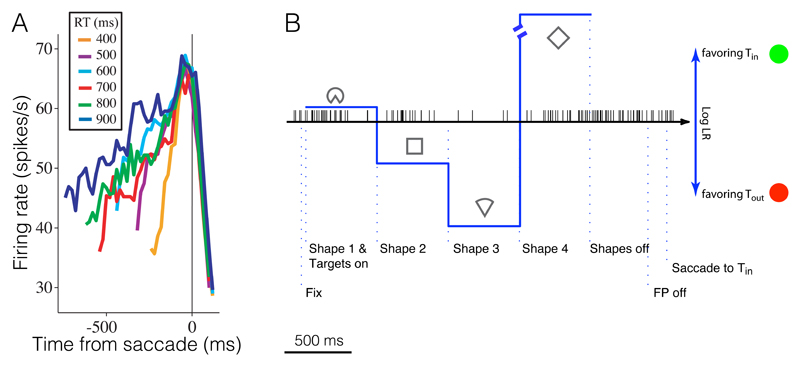
The first interpretation is refuted by choice-reaction time (RT) experiments [2]. Aligned to the beginning of deliberation, the across-trial averages of such steps would resemble a ramp. However, aligned to the end of the decision, synchronous steps should be obvious (e.g., [1] Figs. 2A, 3A). The LIP data are inconsistent with this idea (Fig. 1A): trials with long RT do not hover in a neutral state until the end of the decision (see also [3]).
Fig. 1.
Experimental evidence in support of a gradual accumulation of evidence in LIP. (A) LIP neurons ramp, on average, during an RT task. Averages are sorted by RT quantile (color), using trials in which the monkey chose the direction associated with the choice target in the neuron’s response field. (Modified from [2], showing response from ~200ms after stimulus onset; see also [11] Figs. 2b,d). (B) LIP neurons undergo multiple incremental changes in firing rate on single trials. On this example trial, the monkey decided in favor of the green target in the neuron’s response field, consistent with the accumulated evidence from the sequence of shapes. (From movie 3 of [4]). (see [Yang_Movies, Kira_Movie1, Kira_Movie2] for more single-trial examples and [4, 5] for population analyses).
The second interpretation could explain the ramps aligned to saccadic responses in the RT experiments. However, this interpretation is inconsistent with other experiments in which a sequence of shapes replaces random-dot motion to furnish discrete packets of evidence. Under these conditions, LIP neurons do not step to stereotyped high or low states. Instead they produce graded responses throughout the decision according to the sign and strength of the evidence provided by the current shape (Fig. 1B). Further, the graded population responses are not simply a mixture of high and low steps [4, 5]. If they were, the change in firing rate induced by a shape should diminish for later shapes, because the neuron is more likely to have already stepped. This is clearly incorrect (see [4], Figs. 3b and 4b). Thus, LIP neurons encode multiple small, noisy changes in evidence (not one-time, all-or-nothing steps) in a manner consistent with diffusion or random-walk dynamics.
These points question the conclusions in [1]. Then why do their analyses suggest stepping? Parietal activity can step in the context of quickly planned eye movements to visual targets [6, 7]. In contrast, diffusion (ramping) dynamics arise when the decision to make such an eye movement results from the temporal integration of evidence over a more prolonged interval. Therefore, before using models to identify (or refute) neural correlates of an integration-based decision process, it is essential to: 1) know that the neural activity in question is occurring in a behavioral context that is actually based on prolonged integration, and 2) focus any model comparison on the epoch in which this integration occurs.
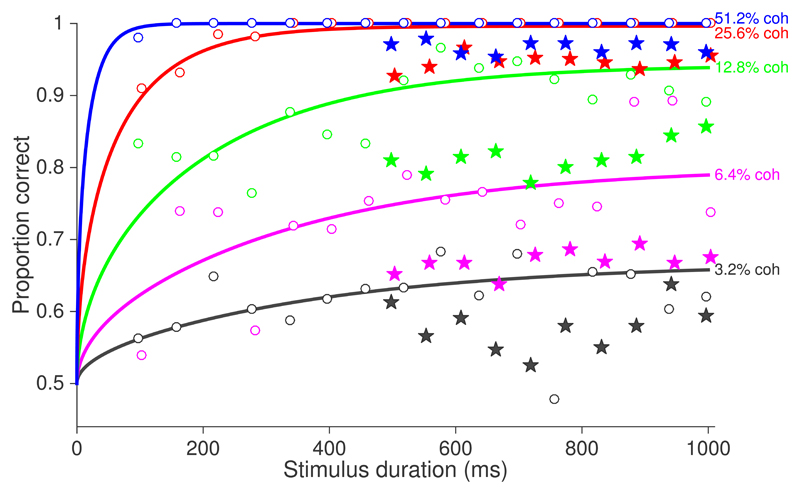
Unfortunately, it is difficult to estimate the integration times from the behavioral data in [1]. They did not use an RT experiment, and their monkey’s accuracy is flat over the viewing durations they tested (Fig. 2, filled stars). It is possible to deduce integration times from a follow-up experiment in the same monkey, using a broader range of durations (Fig. 2 open symbols). Fitting these data with bounded diffusion (curves), yields a median integration time of ~250 ms (across all motion strengths). However, the monkey’s accuracy is substantially worse in the data analyzed in [1]. One possibility is that the poorer accuracy is explained by a combination of guessing and overall lower sensitivity—partially compensated by an elevated decision bound—whose net effect is longer integration times (~310 ms). Alternatively, the poor accuracy is explained by brief integration times (~70 ms), or possibly a different strategy altogether in which the monkey waits for salient features (extrema) in the random dots. These latter alternatives are consistent with our experience training monkeys on these kinds of tasks.
Fig. 2.
Behavioral integration times are difficult to determine from the analyzed dataset but are certainly shorter than the full 500–1000 ms viewing durations. Data are from [12] (Figs 7A,D; with missing coherences kindly supplied by Latimer et al.) Open circles correspond to behavioral data obtained after the collection of the neural recordings ([1], Fig 7D). Smooth curves show fits of a bounded diffusion model, from which we estimate the median decision time ~250 ms across all motion strengths (methods explained in [13, 14]). The data actually analyzed in [1](Fig 7A) exhibit little dependence of accuracy on the range of viewing times tested and overall worse performance (filled stars).
Most importantly, regardless of whether the integration times are 70 ms or 300 ms, they are substantially shorter than the 500–1000 ms duration of the trials. Accordingly, integration does not need to start at a consistent time within a trial. This potential variability exposes a critical bias in the model comparison: the stepping model is allowed the flexibility to account for random times of transitions, but the diffusion model is tethered to a fixed start time and therefore is unfairly penalized in comparison. A relatively short integration window occurring at random times during motion viewing can also explain other features of [1]: the broad distribution of the time of the putative steps, the absence of a dependency of step times on motion strength, the pattern of response variance ([1] Fig. 4A), the superior choice predictions of the step model, and its superior DIC.
Latimer et al. attempt to mitigate some of these concerns in their supplementary analysis of data from an RT experiment [2]. However, that analysis also does not convincingly support a stepping model. Of the 16 neurons (of 54) chosen for analysis, only 10 exhibited the kind of coherence- and choice-dependent ramping that is the focus of the model comparison. Of these, four support diffusion. Moreover, the average ΔDIC in favor of steps is small (~19; 10 excluding the outlier), even though the comparison is biased toward that result: (1) the data include many high motion strength trials with brief integration times (e.g., 12% of included trials have integration times <150ms) that are likely to be seen as steps; (2) their integration model assumes that the starting time of integration is fixed, despite the fact that it varies considerably across neurons (see [1], Fig S22); and (3) their own simulations ([1] Fig. S6) show that their analysis can produce evidence for stepping even under simulations of diffusion. Identifying the sources of these biases, including possibly their model’s handling of negative-going rates (which are neither bounded nor stopped like the positive-going rates; Supp. section 2.1, Fig. 1B and S9 in [1]) and the inability to identify latent firing rates from the parameters of diffusion, should be addressed before applying these methods to richer data sets.
In summary, Latimer et al. present a statistical method for inferring discrete steps in firing rate from single neurons (similar to [8–10]) and use it to claim that averages of random steps are responsible for the evolving firing of LIP neurons during deliberative decision making. However, they have not supported this claim, and they have not provided a plausible explanation for many experimental observations supporting the representation of accumulated noisy evidence by single neurons in LIP. At present, bounded diffusion provides the best account of the ensemble of neural data.
Contributor Information
Michael N Shadlen, HHMI & Dept. of Neuroscience, Columbia University.
Roozbeh Kiani, Center for Neural Science, New York University.
William T Newsome, HHMI & Stanford University.
Joshua I Gold, Department of Neuroscience, University of Pennsylvania.
Daniel M Wolpert, Department of Engineering, University of Cambridge.
Ariel Zylberberg, Department of Neuroscience, Columbia University.
Jochen Ditterich, Center for Neuroscience and Dept. of Neurobiology, Physiology & Behavior, University of California, Davis.
Victor de Lafuente, Institute for Neuroscience. National Autonomous University of Mexico. Querétaro, México.
Tianming Yang, Institute of Neuroscience, Chinese Academy of Sciences.
Jamie Roitman, Department of Psychology, University of Illinois at Chicago.
References and Notes
- 1.Latimer KW, et al. Single-trial spike trains in parietal cortex reveal discrete steps during decision-making. Science. 2015;349(6244):184–7. doi: 10.1126/science.aaa4056. [DOI] [PMC free article] [PubMed] [Google Scholar]
- 2.Roitman JD, Shadlen MN. Response of neurons in the lateral intraparietal area during a combined visual discrimination reaction time task. J Neurosci. 2002;22(21):9475–89. doi: 10.1523/JNEUROSCI.22-21-09475.2002. [DOI] [PMC free article] [PubMed] [Google Scholar]
- 3.Bollimunta A, Totten D, Ditterich J. Neural dynamics of choice: single-trial analysis of decision-related activity in parietal cortex. Journal of Neuroscience. 2012;32(37):12684–12701. doi: 10.1523/JNEUROSCI.5752-11.2012. [DOI] [PMC free article] [PubMed] [Google Scholar]
- 4.Yang T, Shadlen MN. Probabilistic reasoning by neurons. Nature. 2007;447(7148):1075–80. doi: 10.1038/nature05852. [DOI] [PubMed] [Google Scholar]
- 5.Kira S, Yang T, Shadlen MN. A Neural Implementation of Wald's Sequential Probability Ratio Test. Neuron. 2015;85(4):861–873. doi: 10.1016/j.neuron.2015.01.007. [DOI] [PMC free article] [PubMed] [Google Scholar]
- 6.Barash S, et al. Saccade-related activity in the lateral intraparietal area: I. Temporal properties; comparison with area 7a. J Neurophysiol. 1991;66(3):1095–1108. doi: 10.1152/jn.1991.66.3.1095. [DOI] [PubMed] [Google Scholar]
- 7.Gnadt JW, Andersen RA. Memory related motor planning activity in posterior parietal cortex of monkey. Exp Brain Res. 1988;70:216–220. doi: 10.1007/BF00271862. [DOI] [PubMed] [Google Scholar]
- 8.Commenges D, Seal J. The Analysis of Neuronal Discharge Sequences: Change-Point Estimation and Comparison of Variances. Statistics in Medicine. 1985;4:91–104. doi: 10.1002/sim.4780040113. [DOI] [PubMed] [Google Scholar]
- 9.Commenges D, Seal J, Pinatel F. Inference about a Change Point in Experimental Neurophysiology. Mathematical Biosciences. 1986;80:81–108. [Google Scholar]
- 10.Wilson RC, Nassar MR, Gold JI. Bayesian online learning of the hazard rate in change-point problems. Neural Comput. 2010;22(9):2452–76. doi: 10.1162/NECO_a_00007. [DOI] [PMC free article] [PubMed] [Google Scholar]
- 11.Churchland AK, Kiani R, Shadlen MN. Decision-making with multiple alternatives. Nat Neurosci. 2008;11(6):693–702. doi: 10.1038/nn.2123. [DOI] [PMC free article] [PubMed] [Google Scholar]
- 12.Meister ML, Hennig JA, Huk AC. Signal multiplexing and single-neuron computations in lateral intraparietal area during decision-making. J Neurosci. 2013;33(6):2254–67. doi: 10.1523/JNEUROSCI.2984-12.2013. [DOI] [PMC free article] [PubMed] [Google Scholar]
- 13.Kiani R, Hanks TD, Shadlen MN. Bounded integration in parietal cortex underlies decisions even when viewing duration is dictated by the environment. J Neurosci. 2008;28(12):3017–29. doi: 10.1523/JNEUROSCI.4761-07.2008. [DOI] [PMC free article] [PubMed] [Google Scholar]
- 14.de Lafuente V, Jazayeri M, Shadlen MN. Representation of Accumulating Evidence for a Decision in Two Parietal Areas. Journal of Neuroscience. 2015;35(10):4306–4318. doi: 10.1523/JNEUROSCI.2451-14.2015. [DOI] [PMC free article] [PubMed] [Google Scholar]


