

Abstract
The ability of bone mineral density (BMD) and other risk factors to predict fracture risk is well-established for as long as 5–10 years. However, their value to predict risk over longer term has not been directly studied. We investigated whether a single assessment of femoral neck BMD (FnBMD) and fracture history can predict fracture risk over 20 to 25 years.
We used data from the Study of Osteoporotic Fractures (SOF) that assessed BMD and risk factors in 7959 women ≥ age 67 (mean=73.4) in 1988–90. Follow-up for fractures continued for 25 years for hip fracture, and for 20 years for any non-vertebral fracture. Using age-adjusted proportional hazards models, we analyzed the relationships between a single baseline assessment of FnBMD, fracture history and age and 20–25 year fracture incidence.
25 year cumulative incidence of hip fracture (HF) was 17.9%; 20 year incidence of any non-vertebral fracture was 46.2%. 25 year HF incidence was highest in those ≥80 years old (22.6%) compared to 13.9% in women aged <70 years. A single FnBMD measurement strongly predicted long term HF risk to 25 years: 29.6% risk in the lowest BMD quartile vs 7.6% in the highest [relative hazard (RH) =4.9(95%CI:4.1,6.0)]. FnBMD predicted HF with little degradation over time from RH/SD 2.6(2.2–3.0) for 0–5 years to 1.8(1.4–2.4) for 20–25 years. Lifetime HF risk was similar (~30%) regardless of age from 67 to >80. History of hip fracture predicted hip fractures only slightly better than history of non-vertebral fracture [RH=1.6(95%CI:1.1,2.2) vs 1.4(95%CI:1.2,1.5), respectively]. Fracture history remained strongly predictive up to 25 years.
We conclude that a single BMD and fracture history assessment can predict fracture risk over 20–25 years. Long-term risk of HF remains extremely high in the oldest age groups, supporting risk assessment and consideration of treatment even in the oldest, highest risk women.
Keywords: age, BMD, fracture, history of fracture
INTRODUCTION
The use of bone mineral density (BMD) assessed by dual-energy x-ray absorptiometry (DXA) to predict fracture risk is well established: studies have shown that one standard deviation decrease in BMD is associated with a 2 to 3 fold increased risk for future hip fracture and about a 1.5 fold increased risk for all non-vertebral fractures1. However, most studies have assessed this relationship over a duration of 3 to 5 years. A previous analysis of the Study of Osteoporotic Fractures (SOF) extended to 10 years and one from the Dubbo study continued follow-up for about 16 years2,3. But no previous studies have included follow-up beyond this duration to 20 or 25 years. FRAX and other risk tools4 provide estimates of 10-year fracture probability using risk factors including BMD, but these 10 year estimates are not based on studies with 10 years of follow-up. Instead, they combine short-term fracture studies and population mortality data in statistical models. However, it would be of interest to directly estimate, without the need for extrapolation using models, the relationship of a single BMD measurements to fracture risk for 10 years as well as for longer periods.
Non-vertebral fracture history is another well-established risk factor for incident fracture5,6,7. However, similar to BMD, the longest follow-up period is 16 years and there is no previous data about the value of fracture history for predicting fracture risk over 20 to 25 years.
In order to address the question of how well DXA BMD and fracture history predict fracture risk for up to 25 years, we used data from the Study of Osteoporotic fractures (SOF). SOF is an ongoing prospective cohort study of 9704 community-dwelling women age 65 and older, with the initial visit in 1986–8 with fracture data available up to 20 years for non-vertebral fracture and up to 25 years follow-up for hip fracture. DXA BMD was first measured at the 2 year visit in 7959 women in 1988–90. This cohort provides a unique opportunity to directly calculate, without the need for statistical modeling, the relationship of single assessment of DXA BMD and fracture history to predict fracture risk over 20–25 years.
METHODS
Subjects
SOF is a large multicenter prospective cohort study of risk factors for fracture in 9704 community-dwelling ambulatory white women aged 65 years or older, who were enrolled between September 1986 and October 19888. Women were recruited from population-based listings in four regions of the United States: Baltimore County, MD; Minneapolis, MN; Portland, OR; and the Monongahela Valley near Pittsburgh, PA. African Americans were excluded from the initial SOF study because of their lower rate of hip fracture. Other exclusion criteria included history of bilateral hip replacement and inability to walk without assistance from another person. All women provided written informed consent. Approval was obtained from the Institutional Review Boards at each site.
Assessment of risk factors and BMD
The content of SOF clinic visits has been described previously8. Briefly, at the baseline examination in 1986–88, all participants completed a questionnaire, interview, and underwent a physical examination. Variables collected included demographics (e.g. age, height, weight), fracture history (since age 50), maternal hip fracture history, falls history, smoking status, medical comorbidities, and medication use. All active surviving participants were invited to participate in periodic follow-up clinic examinations over the course of the study. DXA scans of the hip were first performed at the Year 2 follow-up visit, between Nov 1988 and Dec 1990, using Hologic 1000 densitometers (Hologic, New Bedford, MA, USA). The right proximal femur was scanned except in the case of right hip replacement or severe degenerative change. T-scores were calculated using the NHANES reference database for Caucasian women. Additional details of the measurement method and densitometry quality control procedures have been published elsewhere9.
Fracture Reporting and Adjudication
Participants were contacted by postcard every four months, with telephone follow-up for non-responders, to ask whether they had sustained a fracture. They also were asked to notify the local clinical center as soon as possible after any fracture. Follow-up contacts were >95% complete. After receiving a report of a fracture, clinic staff interviewed participants about the type of fracture and how it occurred. Copies of radiological reports were obtained for all incident non-vertebral fractures and these were physician-adjudicated from radiology reports by a central adjudicator. Traumatic fractures were defined as fractures resulting from severe trauma (e.g, motor vehicle accidents, being struck by a car, falls from greater than a standing height [e.g, from a ladder] or other rapidly moving subjects, or assaults) and were excluded from this analysis. For hip fractures, adjudication was continued through 2014, while adjudication for other fractures was stopped in January, 2010. For this analysis, we included hip fracture (assessed for up to 25 years of follow-up) and any non-vertebral fracture (assessed for up to 21 years) that occurred after the year 2 visit.
Statistical analyses
This analysis focused on the ability of 3 established risk factors for fractures (age, BMD, history of fractures) to predict long-term risk of hip and non-vertebral fractures. In order to estimate the cumulative incidence of hip fractures over the 25 years of the study (20 years for non-vertebral fractures), we used a standard non-parametric estimator, treating death as a competing risk and loss to follow-up as uninformative censoring10. In brief, this method accounts for the fact that first fractures can occur among at-risk women who are lost to follow-up but not among those who die before fracture. As in the Kaplan-Meier estimator, fracture incidence is assumed to be similar in subgroups of at-risk women who remain in active follow-up and are lost to follow-up. For stratified analyses by BMD quartiles, we used age-adjusted BMD quartiles that were derived by calculating the BMD quartile within age categories (67–69, 70–74 years, etc.).
We used Cox proportional hazards models to examine age, femoral neck BMD, and history of non-vertebral or hip fracture as predictors of fracture. All analyses were run using competing risk models11. In order to examine possible degradation of prediction over the follow-up period, we performed secondary analyses in which follow-up time was stratified by 5 year categories (0 to 5 years, 5 to 10 years, etc.) and only fractures occurring within those intervals were considered. We used the SOF year 2 visit (the first with DXA measurement) which occurred in 1988 through 1990 as our baseline visit for this analysis and all baseline values were updated at the time of this visit based on information collected between the original baseline and the year 2 visit.
Results
8130 women attended the SOF year 2 visit (Table 1). Femoral neck BMD was available on 7959 and the mean was 0.65 g/cm2, corresponding to a T-score of −1.4. At the time of this visit, 38.4% reported a history of at least one non-vertebral fracture and 2.3% (184) a history of hip fracture since age 50. By the end of hip fracture follow-up in 2014, 5913 (72.7%) women had died and 870 (10.7%) had terminated follow-up.
Table 1.
Baseline Characteristics
| N = 8,130 | |
|---|---|
| Age at Visit 2 (mean ± SD) | 73.4 ± 5.1 years |
| Age [Number (%)] | |
| 65 – 69 Years | 2,212 (27.2) |
| 70 – 74 Years | 3,088 (38.0) |
| 75 – 79 Years | 1,764 (21.7) |
| ≥80 Years | 1,066 (13.1) |
| Weight (kg) | 66.4 ± 12.5 |
| BMI | 26.2 ± 4.6 |
| Femoral Neck BMD (mean ± SD) | 0.65 ± 0.11 g/cm2 |
| Femoral Neck T-score by quartiles [Number (%)] | |
| Q1 (t-score: −5.2 to −2.2) | 1,995 (25%) |
| Q2 (−2.9 to −1.6) | 1,985 (25%) |
| Q3 (−2.4 to −1.0) | 1,995 (25%) |
| Q4 (−1.8 to +4.3) | 1,984 (25%) |
| History of Fracture >50 years [Number (%)] | |
| Any Non-vertebral | 3,118 (38.4) |
| Hip | 184 (2.3) |
* Quartile of BMD is age-adjusted by calculating quartile within each 5 year age group (see text)
Over 25 years of follow-up, a total of 1290 (15.9%) women experienced one or more hip fractures, and over 20 years of follow-up, 3267 (43.7%) had one or more non-vertebral fractures. (Figure 1).
Figure 1:
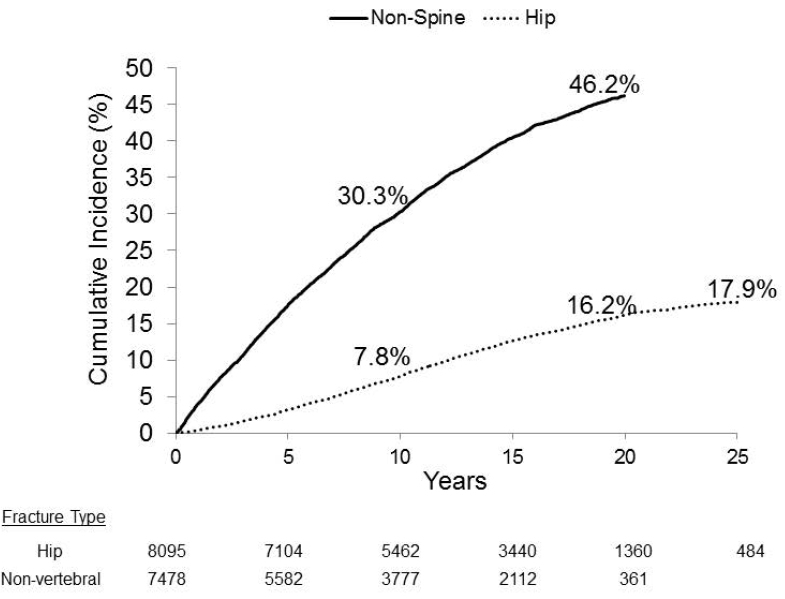
Cumulative incidence of hip fracture (25 years) and non-vertebral fractures (20 years). The number of subjects still active and without the event of interest at each time point is reported.
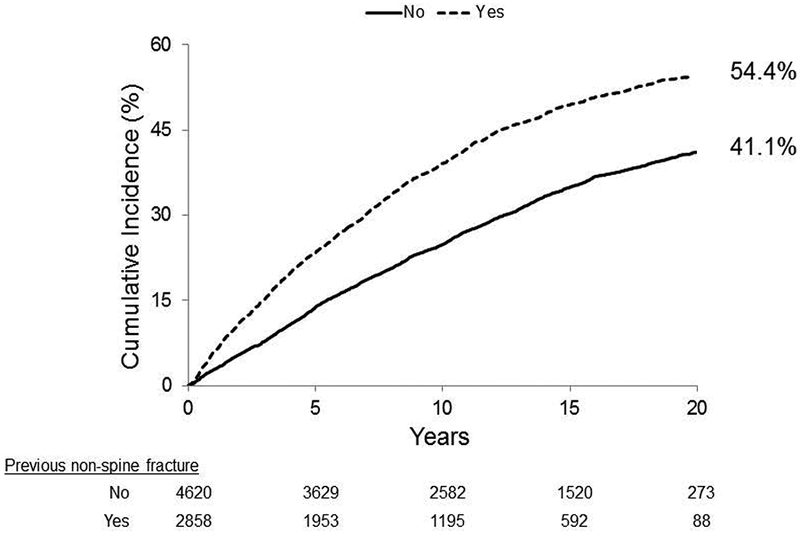
As expected, the cumulative incidence of both hip and non-vertebral fractures was related to age (Figures 2A and 2D). For hip fracture, the relationship to age was particularly strong: after accounting for the competing risk of mortality, 25-year incidence among women over age 80 at baseline was 22.6% compared with 13.9% in those under 70 (Figure 2A). For non-vertebral fracture, 20-year incidence among women over 80 years was 50.0% compared with 42.6% in those under 70 (Figure 2D).
Figure 2:
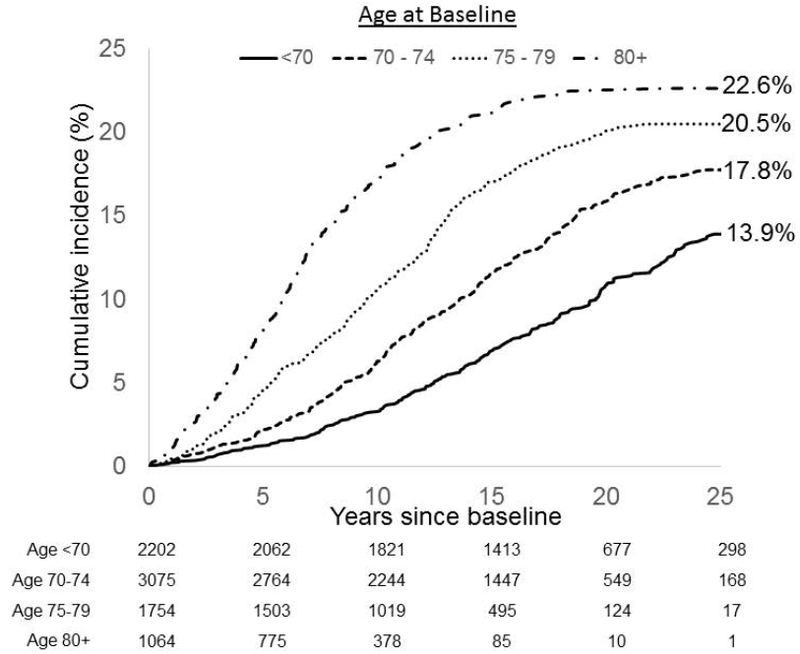

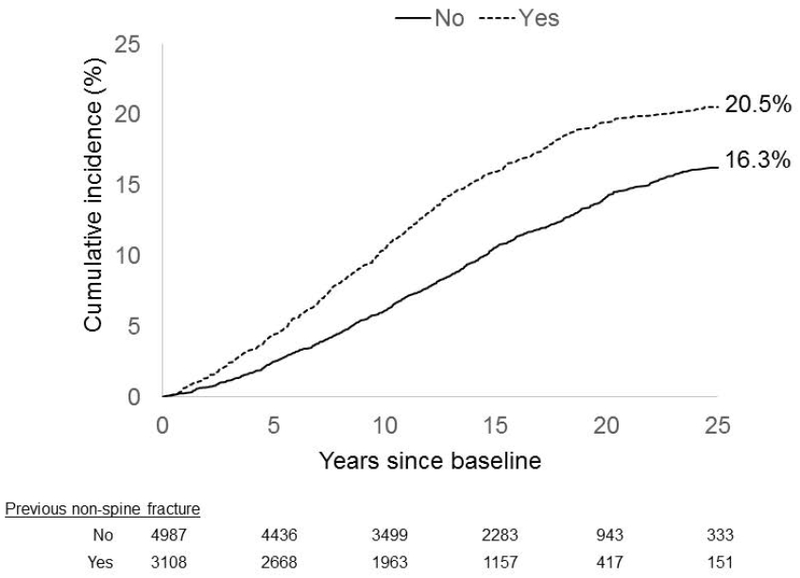
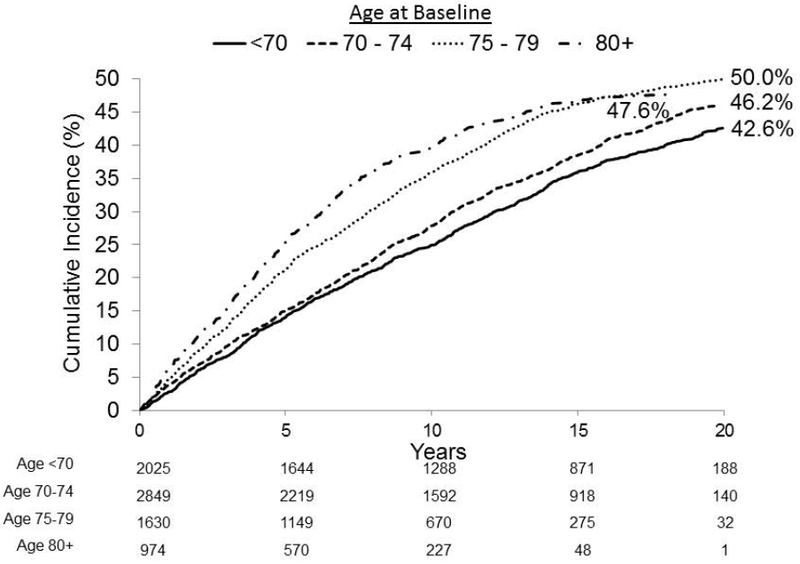

Cumulative incidence of hip (25 years, Figure 2A-C) and non-vertebral fracture (20 years, Figure 2D-F) by categories of individual risk factors including age (Figures 2A & 2D), age-adjusted femoral neck BMD quartiles (Figures 2B & 2E) and history of non-vertebral fractures (Figures 2C & 2F). For each panel the number of subjects still active and without the event of interest at each time point according to baseline age, BMD or fracture history are reported. Cumulative incidence of mortality by age-adjusted femoral neck BMD quartiles (Figure 2G)
Single BMD measure as a predictor of long-term fracture incidence
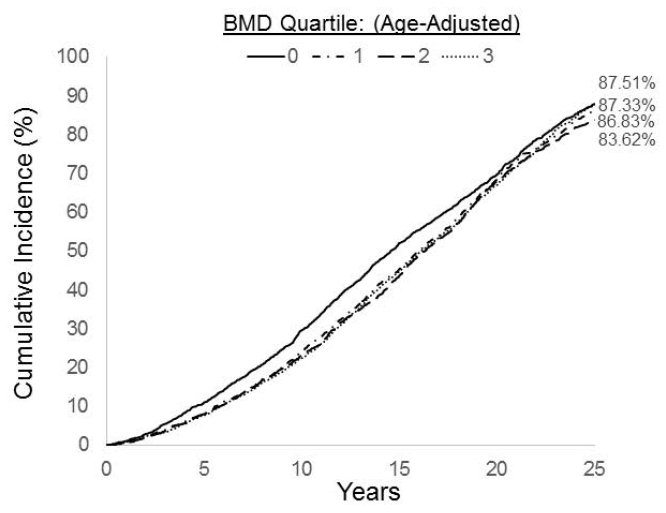
Femoral neck BMD was strongly predictive of long-term incidence of hip and non-vertebral fractures, even after age adjustment and accounting for the competing risk of mortality. For hip fracture, long-term incidence ranged from 29.6% in the lowest BMD quartile compared with 7.6% in the highest quartile (Figure 2B). For non-vertebral fracture, long-term incidence ranged from 59.7% in women in the lowest BMD quartile to 32.9% in the highest quartile (Figure 2E).
Table 2 shows the association between baseline BMD, fracture history, age and long-term risk of fracture. For hip fracture, there was an almost 5-fold increased risk (Relative Hazard (RH)=4.9; 95% CI: 4.1–6.0) between the lowest and highest (age-specific) quartile of BMD; this corresponded to a relative hazard of 2.0 (95% CI: 1.9–2.1) per SD decrease in BMD. For non-vertebral fracture, there was approximately a doubling of risk from the lowest to highest BMD quartile (RH=2.4 (95% CI: 2.2–2.7)) with a relative hazard of 1.5 (95% CI: 1.4, 1.5) per SD decrease in BMD (Table 2). Using competing risk models did not substantially alter results.
Table 2.
Risk of fractures over 20–25 years by history of non-vertebral fracture and and femoral neck BMD
| Predictor | Category | Age-adjusted RH (95% CI) |
|---|---|---|
| Hip Fracture (25 years) | ||
| Femoral Neck BMD (Quartiles) | Highest Quartile (Ref.) | 1.0 |
| 3rd vs. Highest Quartile | 2.0 (1.6, 2.5) | |
| 2nd vs. Highest Quartile | 3.0 (2.4, 3.6) | |
| Lowest Quartile vs. Highest | 4.9 (4.1, 6.0) | |
| Femoral Neck BMD Continuous Variable | Per SD decrease | 2.0 (1.9, 2.1) |
| History of Fractures | Any Non-vertebral | 1.4 (1.2, 1.5) |
| Hip | 1.6 (1.1, 2.2) | |
| Any Non-Vertebral Fracture (20 years) | ||
| Femoral Neck BMD (Quartiles) | Highest Quartile (Ref.) | 1.0 |
| 3rd vs. Highest Quartile | 1.4 (1.3, 1.6) | |
| 2nd vs. Highest Quartile | 1.7 (1.6, 1.9) | |
| Lowest Quartile vs. Highest | 2.4 (2.2, 2.7) | |
| Femoral Neck BMD Continuous Variable | Per SD decrease | 1.5 (1.4, 1.5) |
| History of Fractures | Any Non-vertebral | 1.6 (1.5, 1.7) |
| Hip | 1.6 (1.3, 2.0) | |
| Mortality (25 years) | ||
| Femoral Neck BMD (Quartiles) | Highest Quartile (Ref.) | 1.0 |
| 3rd vs. Highest Quartile | 0.97 (0.90, 1.04) | |
| 2nd vs. Highest Quartile | 1.00 (0.93, 1.08) | |
| Lowest Quartile vs. Highest | 1.10 (1.02, 1.18) | |
| Femoral Neck BMD Continuous Variable | Per SD decrease | 1.04 (1.02, 1.07) |
Figure 2G shows cumulative mortality by baseline (age-adjusted) BMD quartile. Comparing across quartiles, the only significant difference was that mortality was about 10% higher in those with BMD in the lowest quartile.
Past fracture as predictor of long-term fracture incidence
History of non-vertebral fracture was predictive of 25 year risk for hip fracture (RH=1.4, 95% CI:1.2–1.5) and also of 20 years risk for non-vertebral fracture (RH=1.6, 95% CI:1.5–1.7) (Table 2). History of hip fracture was slightly more predictive of 25 year risk of hip fracture (RH=1.6, 95% CI:1.1–2.2) than was history of any non-vertebral fracture (RH=1.4). History of non-vertebral and hip fracture were equally predictive of 20 year non-vertebral fracture risk (RH=1.6) (Table 2) although the confidence interval for hip fracture history was much larger (95% CI:1.5 to 1.7 for non-vertebral history vs 1.3 to 2.0 for hip fracture history) due to the much larger number of women with a history of non-vertebral fracture compared to hip fracture (38.4% vs 2.3%, Table 1).
Attenuation in prediction over time
Table 3 shows the RH/SD for BMD and fracture history for fractures occurring long after the BMD and fracture history assessment. These results confirm that these risk factors remain strong predictors of hip and non-vertebral fractures many years beyond the original risk factor assessment. The predictive value of FN BMD for hip fracture was 2.6 over the first 5 years of follow-up, and it remained statistically significant for fractures occurring at 20–25 years after BMD assessment (RH=1.8; 95% CI:1.4, 2.4). For non-vertebral fracture, femoral neck BMD predicted fracture risk over the entire 20 years period with no evidence of attenuation over time. Fracture history continued to predict hip fracture risk for the first 15 years but was no longer statistically significant after 15 years. For predicting non-vertebral fractures, the predictive value of fracture history attenuated over time but remained statistically significant even out to 20 years.
Table 3.
Relationship of BMD and fracture history to future risk over 5 year intervals (age-adjusted)
| 0 to 5 years RH (95% CI) |
5 to 10 years RH (95% CI) |
10 to 15 years RH (95% CI) |
15 to 20 years RH (95% CI) |
20 to 25 years RH (95% CI) |
|
|---|---|---|---|---|---|
| Hip Fracture | |||||
| FN BMD (RR/SD) | 2.6 (2.2, 3.0) | 2.0 (1.8, 2.3) | 1.9 (1.7, 2.2) | 1.6 (1.4, 1.9) | 1.8 (1.4, 2.4) |
| History of Non-Vert | 1.5 (1.2, 2.0) | 1.7 (1.4, 2.1) | 1.3 (1.1, 1.6) | 1.2 (0.91, 1.6) | 0.66 (0.44, 1.1) |
| Any Non-Vert Fracture | |||||
| FN BMD (RR/SD) | 1.4 (1.3, 1.5) | 1.5 (1.4, 1.6) | 1.5 (1.4, 1.6) | 1.5 (1.3, 1.7) | |
| History of Non-Vert | 1.7 (1.5, 1.9) | 1.7 (1.5, 1.9) | 1.4 (1.2, 1.7) | 1.3 (1.1, 1.7) | |
Analyzing fracture risk over varying cumulative periods of time (e.g. 0 to 10 years vs. 0 to 25 years), supported the finding of that the strength for BMD and fracture history was retained over 20–25 years (Supplemental-Table1).
Baseline BMD T-score and age jointly predicting long term hip fracture risk
Figure 3 shows the relationship between baseline femoral neck BMD T-score and age and 10 and 25 year cumulative incidence of hip fracture. These data show that BMD remains very strongly predictive within each age group. For example, among those over age 75, 25 year incidence of hip fracture increases from 7.1% in those with femoral neck T-score above −1.0 to 31.5% in those with T-score below −2.5. For predicting 10 year hip fracture incidence, BMD is similarly strong within each age group. Interestingly, for 25 year incidence of hip fracture, age becomes only weakly predictive of hip fracture risk, adjusted for hip BMD and prior fracture. For example, among those with femoral neck BMD T-score below −2.5, hip fracture incidence varies only slightly from 27.4% to 31.5% among the 3 age groups.
Figure 3:
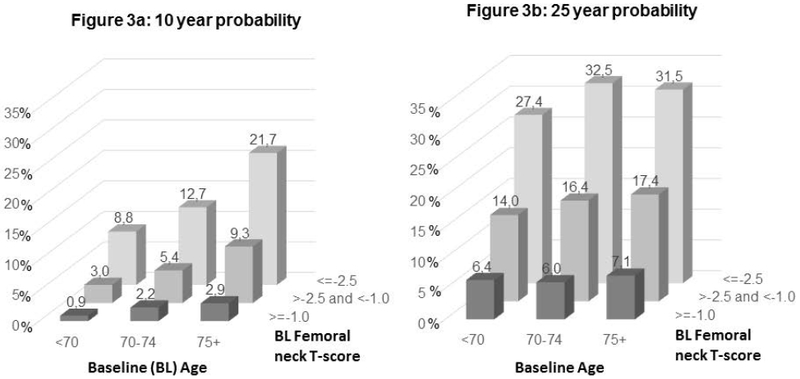
10 and 25 year cumulative incidence of hip fracture by baseline age and femoral neck BMD T-score
Discussion
We examined the ability of BMD and history of non-vertebral fracture to predict fractures over 20–25 years in older U.S. Caucasian women. We found that both risk factors remained strong predictors over 20–25 years, with remarkably little degradation in prediction over time. Previous analyses using the same cohort included the same predictors for hip fracture for a period up to 10 years2. Our current data which included non-vertebral (up to 20 years) and hip fractures (up to 25 years), are consistent with this earlier analysis and have important clinical implications. Other analyses in this data set have addressed the issue of optimal frequency of repeat BMD and while our analysis cannot directly address this question, they suggest that a single fracture risk assessment in a woman aged 65 and over may be useful in estimating her risk over 20–25 years. Therefore, unless a major change in health that impacts bone health occurs (e.g. initiation of osteoporosis treatment, use of glucocorticoids, marked weight loss, fracture occurrence, etc.), a single assessment of BMD may continue to be predictive of fracture risk for as long as 25 years.
Because of the long period of follow-up, as well as the age of our participants, our study is unique in allowing us to directly calculate remaining lifetime fracture probability (RLFP), particularly in the oldest participants where mortality during follow-up was high. Other studies of RLFP have had to rely on statistical modeling based on short-term fracture risk and mortality rates3. The Dubbo study, with a follow-up to 15 years, used statistical models to estimate RFLP to 25 years. They found a 25 year risk of hip fractures of 8.5%. However we found a much higher incidence of 17.9% in those over age 65, over twice as high, using direct data without statistical modeling. Thus the long term incidence may be much higher than previous studies have suggested.
In women over age 80, we found a 23% 25-year risk for hip fracture which is at least as high as that found in previous studies which extrapolated using statistical models based on shorter-term follow-up12,3. A study in 1998 found a RLFP for hip fracture of 19.3% in women at age 8013. Our direct calculation of 25 year risk in those over age 80 was even higher (23%), perhaps reflecting our direct (without models) assessment or further improvements in survival in those over age 80 over the last 15 years. Incorporating BMD into the calculation increases these RLFPs to alarmingly high levels: our results suggested that among women over 70 with femoral neck T-score below −2.5, RFLP for hip fracture is over 30%. Consideration of other risk factors would allow identification of individuals whose risk is even higher. A study in Switzerland estimated RLFP for hip fracture as high as 60 to 75% in a 75 year old woman with low BMD (e.g. T-score <−3)14. Such high risks have important clinical implications, strongly suggesting that physicians seeing older women, including those over 80 years, should pay close attention to fracture risk and implement strategies to reduce it.
Our results showing that non-vertebral fracture history predicts future fracture risk for as long as 20 to 25 years are consistent with a meta-analysis in 2004 that showed history of fracture predicted subsequent risk of osteoporotic fracture and hip fracture over shorter follow-up periods5. There has been some controversy about whether the history of hip fracture is superior to history of non-vertebral fractures in predicting risk of future hip fractures 15,6. In a large international analysis including over 50,000 community-dwelling women 16, the results showed some advantage to site-specific prediction, but the overall conclusion was that history of any non-vertebral fracture should be an important part of clinical risk factor assessment. Our results showed no important advantage to history of hip fracture compared to history of any non-vertebral fracture for predicting subsequent fracture. Moreover, a history of any fracture is much more common than a history of hip fracture, and therefore will be more useful on a population level as a predictor. With the benefit of actual longitudinal follow-up, our results support the use of history of any fracture for predicting future fracture risk. This is consistent with the use of a general fracture history in fracture risk predictive models such as FRAX4 and Garvin17.
While we showed that BMD alone predicted fracture risk, there is no doubt that taking into account other risk factors, and particularly considering time-dependent risk factors, would improve overall prediction. However, our goal was to examine the predictiveness of a single measure of BMD or fracture history over a very long period of time. Previous analyses in SOF and other datasets have aimed to find the best predictors for risk using a time-dependent approach in which changes in risk factors that occur over time are considered. Clearly taking into account events such as changes in health status, comorbid conditions, use of new medications (eg. bisphosphonates or glucocorticoids) would improve prediction. For example, in one recent analysis from SOF 25, risk factors assessed during follow-up, such as current use of bisphosphonates and glucocorticoids or recent history of falls, added significantly to hip fracture prediction. This supports the clinical value of acquiring more current data, including BMD, to optimize fracture prediction. Of interest to this analysis, in the time-dependent analysis, when BMD was considered first alone as a predictor then adjusted for 11 time-dependent risk factors, the relative risk for BMD was only slightly attenuated by multivariate, time-dependent adjustment. The fact that attenuation was only slight supports our conclusions that BMD alone is remarkably persistent as a predictor.
Our results showing that BMD predicts long-term risk of non-vertebral fractures are consistent with earlier analyses of SOF focusing on vertebral fractures, which showed that BMD predicts 15 year incidence of vertebral fractures18.
That risks are so high and can be predicted many years in advance in these older women has important clinical implications. Several studies have shown that osteoporosis treatments are effective in reducing fracture risk in older women 19–21. Despite this evidence, other studies have suggested that rates of treatment are dramatically declining 22,23, perhaps due to concerns about rare side effects. However, analyses strongly support the extremely favorable balance of benefits versus risks in older osteoporotic women 24.
Strengths of our study include the large population of community-dwelling older women and the uniquely long follow-up, allowing a direct estimate of cumulative incidence of hip and non-vertebral fracture. Despite these strengths, the study has some limitations. Firstly, our data do not address the value or optimal frequency of monitoring patients being treated for osteoporosis. Secondly, our analyses included only non-black United States women over age 65 and may not be generalizable to other ethnic groups or geographic regions, to younger women or to men. Some of the women in SOF were using bisphosphonates, raloxifene or hormone therapy and therefore our results may underestimate true risks in untreated populations. However, usage of medications for more than a short period of time was uncommon25 and therefore their impact on incidence is relatively slight. Another limitation is that this analysis does not address whether more recent fractures may more strongly increase short-term future risk as has been suggested in several recent studies26. Follow-up for non-vertebral fracture is available up to 20 years and not 25 as for hip fracture. Lastly, while incident fractures were adjudicated, fracture history was self-reported and not verified.
In conclusion, we show that hip BMD is a remarkably persistent predictor of hip and non-vertebral fractures over 20–25 years and that self-reported history of any fracture also remains predictive over the very long-term. By following this cohort of older women for so long, we show directly that lifetime risk of hip fracture in community-dwelling women over age 75 is extremely high. These results strongly support the value of risk assessment and consideration of treatment even in the oldest, highest risk women.
Supplementary Material
ACKNOWLEDGEMENTS
Study concept and design: Black, Cummings, Cauley
Acquisition of data: Black, Lui, Cummings.
Analysis and interpretation of data: Black, Napoli, Cauley, Lui, Ensrud, Hillier, Wagman, Fink, Schousboe
Drafting of the manuscript: Black, Napoli.
Critical revision of the manuscript for important intellectual content: all authors
Statistical analysis, Lui
Obtained funding: Black, Cummings.
Administrative, technical, or material support: L. Wu (University of California San Francisco) gave administrative and technical support. Dr. Eric Vittinghoff and Lisa Palermo provided statistical methodology support.
DISCLOSURES
• Financial Disclosures: Dr. Black reports receiving grant support from Alexion; consulting fees from Amgen, Merck, Asahi-Kasei and Radius. Dr. Napoli reports receiving consulting fees from Amgen, MSD, UCB, Eli Lilly.
• Dr. Wagman is an employee of Amgen
• Funding support: The Study of Osteoporotic Fractures (SOF) is supported by National Institutes of Health funding. The National Institute on Aging (NIA) provides support under the following grant numbers: R01 AG005407, R01 AR35582, R01 AR35583, R01 AR35584, R01 AG005394, R01 AG027574, and R01 AG027576. A research grant for part of this analysis was provided to UCSF by Amgen Inc. Amgen had no involvement in design of SOF nor the recruitment of patients and did not participate in the analysis nor have access to data.
REFERENCES
- 1.Marshall D, Johnell O, Wedel H. Meta-analysis of how well measures of bone mineral density predict occurrence of osteoporotic fractures. Bmj. 1996;312:1254–1259. [DOI] [PMC free article] [PubMed] [Google Scholar]
- 2.Taylor BC, Schreiner PJ, Stone KL, et al. Long-term prediction of incident hip fracture risk in elderly white women: study of osteoporotic fractures. Journal of the American Geriatrics Society. 2004;52(9):1479–1486. [DOI] [PubMed] [Google Scholar]
- 3.Nguyen ND, Ahlborg HG, Center JR, Eisman JA, Nguyen TV. Residual lifetime risk of fractures in women and men. Journal of bone and mineral research : the official journal of the American Society for Bone and Mineral Research. 2007;22(6):781–788. [DOI] [PubMed] [Google Scholar]
- 4.Kanis JA, Oden A, Johansson H, Borgstrom F, Strom O, McCloskey E. FRAX and its applications to clinical practice. Bone. 2009;44(5):734–743. [DOI] [PubMed] [Google Scholar]
- 5.Kanis JA, Johansson H, Oden A, et al. A family history of fracture and fracture risk: a meta-analysis. Bone. 2004;35:1029–1037. [DOI] [PubMed] [Google Scholar]
- 6.Center JR, Bliuc D, Nguyen TV, Eisman JA. Risk of subsequent fracture after low-trauma fracture in men and women. Jama. 2007;297(4):387–394. [DOI] [PubMed] [Google Scholar]
- 7.Schousboe JT, Fink HA, Lui LY, Taylor BC, Ensrud KE. Association Between Prior Non-Spine Non-Hip Fractures or Prevalent Radiographic Vertebral Deformities Known to be at Least 10 Years Old and Incident Hip Fracture. Journal of bone and mineral research : the official journal of the American Society for Bone and Mineral Research. 2006;21(10):1557–1564. [DOI] [PubMed] [Google Scholar]
- 8.Cummings SR, Nevitt MC, Browner WS, et al. Risk factors for hip fracture in white women. Study of Osteoporotic Fractures Research Group. The New England journal of medicine. 1995;332(12):767–773. [DOI] [PubMed] [Google Scholar]
- 9.Cummings SR, Black DM, Nevitt MC, et al. Bone density at various sites for prediction of hip fractures. The Study of Osteoporotic Fractures Research Group. Lancet. 1993;341:72–75. [DOI] [PubMed] [Google Scholar]
- 10.Putter H, Fiocco M, Geskus RB. Tutorial in biostatistics: competing risks and multi-state models. Statistics in medicine. 2007;26(11):2389–2430. [DOI] [PubMed] [Google Scholar]
- 11.Fine JP, Gray RJ. A proportional hazards model for the subdistribution of a competing risk. J Am Stat Assoc. 1999;94(446):496–509W. [Google Scholar]
- 12.Kanis JA, Johnell O, Oden A, et al. Long-term risk of osteoporotic fracture in Malmo. Osteoporosis international : a journal established as result of cooperation between the European Foundation for Osteoporosis and the National Osteoporosis Foundation of the USA. 2000;11(8):669–674. [DOI] [PubMed] [Google Scholar]
- 13.Oden A, Dawson A, Dere W, Johnell O, Jonsson B, Kanis JA. Lifetime risk of hip fractures is underestimated. Osteoporosis international : a journal established as result of cooperation between the European Foundation for Osteoporosis and the National Osteoporosis Foundation of the USA. 1998;8(6):599–603. [DOI] [PubMed] [Google Scholar]
- 14.Lippuner K, Johansson H, Kanis JA, Rizzoli R. Remaining lifetime and absolute 10-year probabilities of osteoporotic fracture in Swiss men and women. Osteoporosis international : a journal established as result of cooperation between the European Foundation for Osteoporosis and the National Osteoporosis Foundation of the USA. 2009;20(7):1131–1140. [DOI] [PubMed] [Google Scholar]
- 15.Morin SN, Lix LM, Leslie WD. The Importance of Previous Fracture Site on Osteoporosis Diagnosis and Incident Fractures in Women. Journal of bone and mineral research : the official journal of the American Society for Bone and Mineral Research. 2014. [DOI] [PubMed] [Google Scholar]
- 16.Gehlbach S, Saag KG, Adachi JD, et al. Previous fractures at multiple sites increase the risk for subsequent fractures: the Global Longitudinal Study of Osteoporosis in Women. Journal of bone and mineral research : the official journal of the American Society for Bone and Mineral Research. 2012;27(3):645–653. [DOI] [PMC free article] [PubMed] [Google Scholar]
- 17.Nguyen ND, Frost SA, Center JR, Eisman JA, Nguyen TV. Development of prognostic nomograms for individualizing 5-year and 10-year fracture risks. Osteoporosis international : a journal established as result of cooperation between the European Foundation for Osteoporosis and the National Osteoporosis Foundation of the USA. 2008;19(10):1431–1444. [DOI] [PubMed] [Google Scholar]
- 18.Cauley JA, Hochberg MC, Lui LY, et al. Long-term risk of incident vertebral fractures. Jama. 2007;298(23):2761–2767. [DOI] [PubMed] [Google Scholar]
- 19.Boonen S, McClung MR, Eastell R, El-Hajj Fuleihan G, Barton IP, Delmas P. Safety and efficacy of risedronate in reducing fracture risk in osteoporotic women aged 80 and older: implications for the use of antiresorptive agents in the old and oldest old. Journal of the American Geriatrics Society. 2004;52(11):1832–1839. [DOI] [PubMed] [Google Scholar]
- 20.Boonen S, Adachi JD, Man Z, et al. Treatment with denosumab reduces the incidence of new vertebral and hip fractures in postmenopausal women at high risk. The Journal of clinical endocrinology and metabolism. 2011;96(6):1727–1736. [DOI] [PubMed] [Google Scholar]
- 21.Boonen S, Black DM, Colon-Emeric CS, et al. Efficacy and safety of a once-yearly intravenous zoledronic acid 5 mg for fracture prevention in elderly postmenopausal women with osteoporosis aged 75 and older. Journal of the American Geriatrics Society. 2010;58(2):292–299. [DOI] [PMC free article] [PubMed] [Google Scholar]
- 22.Solomon DH, Johnston SS, Boytsov NN, McMorrow D, Lane JM, Krohn KD. Osteoporosis Medication Use after Hip Fracture in U.S. Patients between 2002 and 2011. Journal of bone and mineral research : the official journal of the American Society for Bone and Mineral Research. 2014. [DOI] [PMC free article] [PubMed] [Google Scholar]
- 23.Jha S, Wang Z, Laucis N, Bhattacharyya T. Trends in Media Reports, Oral Bisphosphonate Prescriptions, and Hip Fractures 1996–2012: An Ecological Analysis. Journal of bone and mineral research : the official journal of the American Society for Bone and Mineral Research. 2015;30(12):2179–2187. [DOI] [PMC free article] [PubMed] [Google Scholar]
- 24.Black DM, Rosen CJ. Clinical Practice Postmenopausal Osteoporosis. The New England journal of medicine. 2016;374(3):254–262. [DOI] [PubMed] [Google Scholar]
- 25.Napoli N, Schwartz AV, Palermo L, et al. Risk factors for subtrochanteric and diaphyseal fractures: the study of osteoporotic fractures. The Journal of clinical endocrinology and metabolism. 2013;98(2):659–667. [DOI] [PMC free article] [PubMed] [Google Scholar]
- 26.van den Bergh JP, van Geel TA, Geusens PP. Osteoporosis, frailty and fracture: implications for case finding and therapy. Nat Rev Rheumatol. 2012. [DOI] [PubMed] [Google Scholar]
Associated Data
This section collects any data citations, data availability statements, or supplementary materials included in this article.