

ABSTRACT
The accumulation of undegraded molecular material leads to progressive neurodegeneration in a number of lysosomal storage disorders (LSDs) that are caused by functional deficiencies of lysosomal hydrolases. To determine whether inducing macroautophagy/autophagy via small-molecule therapy would be effective for neuropathic LSDs due to enzyme deficiency, we treated a mouse model of mucopolysaccharidosis IIIB (MPS IIIB), a storage disorder caused by deficiency of the enzyme NAGLU (alpha-N-acetylglucosaminidase [Sanfilippo disease IIIB]), with the autophagy-inducing compound trehalose. Treated naglu–/ – mice lived longer, displayed less hyperactivity and anxiety, retained their vision (and retinal photoreceptors), and showed reduced inflammation in the brain and retina. Treated mice also showed improved clearance of autophagic vacuoles in neuronal and glial cells, accompanied by activation of the TFEB transcriptional network that controls lysosomal biogenesis and autophagic flux. Therefore, small-molecule-induced autophagy enhancement can improve the neurological symptoms associated with a lysosomal enzyme deficiency and could provide a viable therapeutic approach to neuropathic LSDs.
Abbreviations: ANOVA: analysis of variance; Atg7: autophagy related 7; AV: autophagic vacuoles; CD68: cd68 antigen; ERG: electroretinogram; ERT: enzyme replacement therapy; GAPDH: glyceraldehyde-3-phosphate dehydrogenase; GFAP: glial fibrillary acidic protein; GNAT2: guanine nucleotide binding protein, alpha transducing 2; HSCT: hematopoietic stem cell transplantation; INL: inner nuclear layer; LC3: microtubule-associated protein 1 light chain 3 alpha; MPS: mucopolysaccharidoses; NAGLU: alpha-N-acetylglucosaminidase (Sanfilippo disease IIIB); ONL: outer nuclear layer; PBS: phosphate-buffered saline; PRKCA/PKCα: protein kinase C, alpha; S1BF: somatosensory cortex; SQSTM1: sequestosome 1; TEM: transmission electron microscopy; TFEB: transcription factor EB; VMP/VPL: ventral posterior nuclei of the thalamus
KEYWORDS: Autophagic vacuoles, autophagy, ERG, lysosomal storage diseases, MPS IIIB, mucopolysaccharidosis type IIIB, retina, Sanfilippo syndrome, TFEB, trehalose
Introduction
The mucopolysaccharidoses (MPSs) are a group of inherited metabolic diseases caused by the deficiency or malfunction of lysosomal enzymes needed to break down glycosaminoglycans. Among MPSs, the subgroup MPS III (Sanfilippo syndrome) is comprised of 4 genetic subtypes (A through D) that are clinically indistinguishable; although there may be mild facial dysmorphism, infants at first appear healthy, then slowly lose developmental momentum [1]. They suffer behavioral problems and cognitive decline, which worsens into severe dementia, hyperactivity, aggressiveness, pica, sleep disturbances, and loss of vision and hearing; by the adolescent years most become immobile and develop swallowing difficulties and seizures [1–3]. Lifespan usually does not extend past the second decade. The symptoms correspond with degeneration of the cerebral cortex and other brain regions [4–6] as well as neuroinflammation [4,7]. The underlying cause of MPS IIIB, the subtype analyzed in the present work, is a deficiency of NAGLU/α-N-acetylglucosaminidase, an enzyme that participates in the degradation of heparan sulfate.
Several strategies are currently being tested for the treatment of MPSs and other lysosomal storage disorders, including enzyme replacement therapy (ERT), hematopoietic stem cell transplantation (HSCT), and gene therapy with unmodified [8–11] or modified enzymes [12,13]. Unfortunately, these approaches have inherent challenges because enzymes provided by HSCT or ERT have only limited ability to transit through the blood-brain barrier [14,15]. Promising results have been obtained with the injection of either gene therapy vectors [16] or the recombinant protein in a mouse model of MPS IIIB [14], but exogenous protein treatments stimulate the humoral immune response, which poses a problem for treatments based on long-term administration [14]. Thus, for MPS IIIB and many other lysosomal storage disorders, there is still an urgent and unmet need to develop therapeutic approaches to target and correct dysfunctional pathways.
Here we explore an alternative approach to treating MPS IIIB that involves enhancing the autophagic-lysosomal pathway to improve clearance of autophagic vacuoles. TFEB (transcription factor EB) is a master regulator of lysosomal pathways, governing lysosomal biogenesis and metabolism [17], autophagy [18], and lysosomal exocytosis [19] and proteostasis [20]. TFEB overexpression promotes lysosomal proliferation and enhances degradative capabilities against lysosomal or autophagic substrates (such as glycosaminoglycans, polyQ-expanded HTT (huntingtin), and ceroid lipopigments), and rescues affected neurons in animal models of proteinopathies [17,21–27]. Because impairment of autophagy has been described in several models of neuropathic lysosomal storage disorders caused by lysosomal enzyme deficiencies [28,29], we hypothesized that enhancement of autophagy might counteract disease progression in these disorders. We tested our hypothesis by using a mouse model of MPS IIIB (B6.129S6-Naglutm1Efn/J) and trehalose, a known activator of autophagy [30–40] that reaches the mouse brain when provided orally [41], and evaluated the efficacy of this strategy through electrophysiological, behavioral, neuropathological and molecular analyses.
Results
Trehalose slows disease progression and prolongs survival in MPS IIIB mice
LC-MS analysis confirmed the presence of trehalose in the brains from mice treated with 2% trehalose in drinking water (Fig. S1). To test whether trehalose treatment modifies MPS IIIB disease progression, male naglu−/- mice (KO) and age-matched wild-type (WT) mice (n = 16/group) were provided 2% trehalose in their drinking water, starting at one month of age. Trehalose treatment increased the median life span of the naglu–/ – mice by 6.4 weeks (P < 0.0001) (Figure 1(a)). Trehalose did not affect the body weight (Figure 1(b)) and did not cause any obvious adverse effects in WT mice, which is consistent with previous reports [34,37,41,42].
Figure 1.
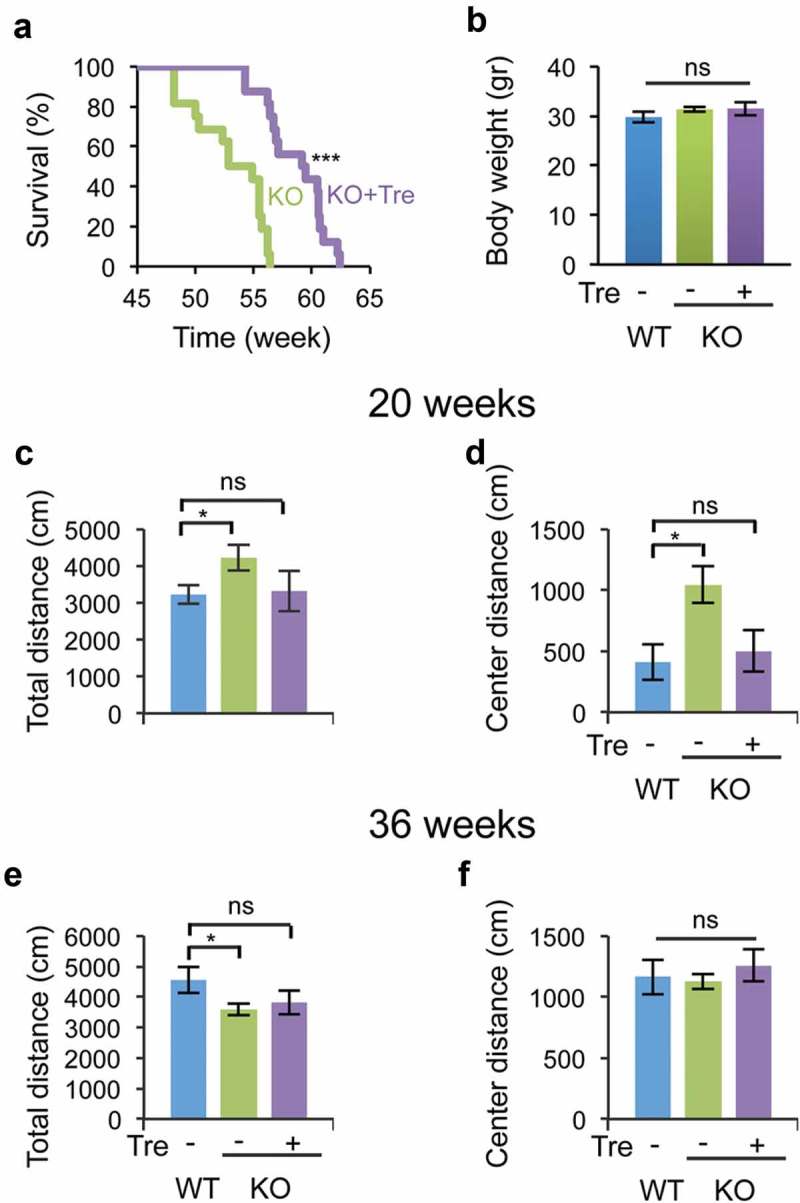
Trehalose treatment increases the life span and reduces hyperactivity and anxiety-related behavior in naglu−/- mice. Mice were weaned 21 days after birth and immediately treated with 2% trehalose in drinking water. (a) Trehalose increased median and maximum life span (> 6 weeks) of naglu−/- mice (N = 16). (b) Trehalose did not affect mouse body weight (36 weeks of age). (c–f) Open-field analysis of trehalose-treated and untreated naglu−/- mice compared with WT mice at 20 weeks of age (c–d) and 36 weeks of age (e–f). Data are means ± SE. *p ≤ 0.05. ns, not significant.
Previous work has shown that naglu–/ – mice display hyperactivity and anxiety-related behavior, which recapitulates the patients’ behavioral symptoms [43]. To test whether trehalose administration modifies these behavioral phenotypes in naglu–/ – mice, we performed open field analysis (OFA) at 20 and 36 weeks of age. At 20 weeks, naglu–/ – mice travelled a greater total distance (4223 ± 345 cm) and center distance (the distance travelled at the center of the open-field apparatus; 1043 ± 151 cm) than WT mice (3232 ± 254 cm and 411 ± 147 cm, respectively) (Figure 1(c–d)), confirming that NAGLU deficiency results in hyperactivity and reduced anxiety-related behavior in mice. In contrast, trehalose-treated naglu–/ – mice traveled similar distances (total distance = 3311 ± 546 cm; center distance = 501 ± 170 cm) as WT mice (Figure 1(c–d)). At 36 weeks, naglu–/ – mice travelled less total distance (3600 ± 198 cm) than WT mice (4555 ± 422 cm), which was not significantly modified by trehalose treatment (3808 ± 392 cm) (Figure 1(e)). The distance traveled at the center was not different between any pairs of groups at 36 weeks of age (WT mice, 1257 ± 131 cm; untreated naglu–/ – mice, 1128 ± 62 cm; trehalose-treated naglu–/ – mice, 1164 ± 142 cm) (Figure 1(f)). Taken together, the behavioral testing revealed that trehalose treatment rescues hyperactivity and normalizes the anxiety-related behavior of naglu–/ – mice at an early stage of disease progression.
naglu–/ – mice did not display any significant differences in rotarod, grip strength, inverted screen, or hot plate assays at 20 or 36 weeks of age compared to WT mice (data not shown). naglu–/ – mice did have significantly elevated auditory brainstem response hearing thresholds, which further increased with age (Fig. S2A). Trehalose treatment improved hearing in a subset of naglu–/ – mice, whose hearing threshold profiles at 24 weeks were restored to those of WT mice, whereas other naglu–/ – mice were unresponsive to the treatment (Fig. S2A and S2B).
Trehalose mitigates retinal rod pathway dysfunction in MPS IIIB mice
To determine whether trehalose treatment protects retinal neuron function from MPS IIIB-associated degeneration, we first performed electroretinogram (ERG) analyses at 28 and 46 weeks of age (n = 8 for trehalose-treated and untreated naglu–/ – mice and n = 7 for WT mice) (Figure 2(a–b)). Consistent with previous reports, naglu–/ – mice at 28 weeks had reduced amplitudes of the rod b-wave [43] and rod a-wave [44] compared to age-matched WT mice, suggesting dysfunction or degeneration of rod photoreceptors and possibly rod bipolar cells. By fitting the b-wave stimulus-response curve with the Naka-Ruston equation, we calculated the Bmax (a functional measure of the rod pathway; dotted line in Figure 2(c–d)) for WT mice as 363.5 ± 13.9 µV and for naglu–/ – mice as 276.0 ± 12.5 µV (24% reduction, P < 0.01, Figure 2(c)). This intergroup difference increased to 49% in the 46th week, indicating progressive dysfunction of the rod pathway (P < 0.01, Figure 2(d)).
Figure 2.
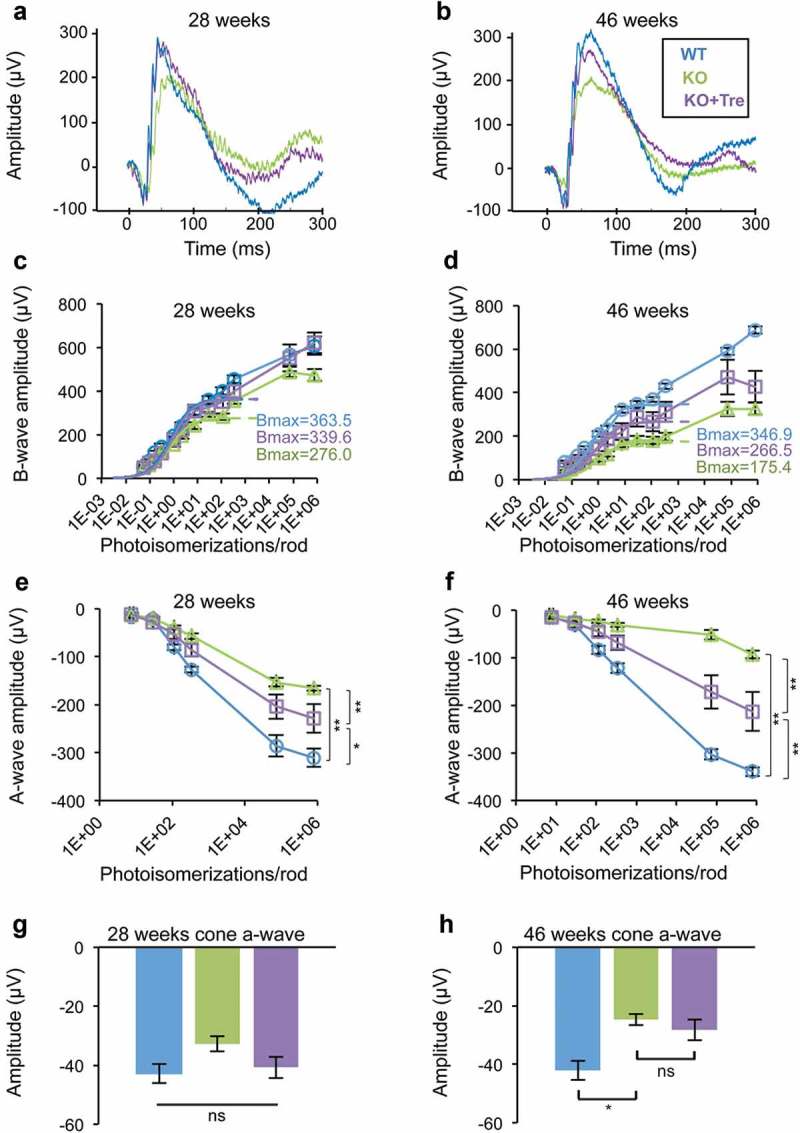
Trehalose treatment improves visual function in naglu−/- mice. (a and b) Representative raw electroretinogram (ERG) traces recorded from untreated (green) and trehalose-treated (purple) naglu−/- mice at 28 and 46 weeks of age. Trehalose-treated mice had slightly higher amplitude of the rod a-wave at 28 weeks, and higher amplitudes of the rod b- and a-waves at 46 weeks. (c and d) Stimulus-response plots showing amplitudes of the dark-adapted ERG b-wave. Data points within the rod operative range were fitted with sigmoidal curves using the Naka-Ruston equation. At 28 weeks of age, the treated naglu−/- mice had a similar maximum response (Bmax) compared to WT mice, which was significantly higher than that of the untreated naglu−/- mice (ANOVA, SNK p < 0.05). At 46 weeks of age, the maximum response of the treated naglu−/- mice was lower than that of the WT mice, but was higher than that of the untreated naglu−/- mice. (e and f) Stimulus-response plots showing amplitudes of the dark-adapted ERG a-wave. At 28 weeks of age, amplitudes of the a-wave recorded from the treated naglu−/- mice were significantly lower than those of the WT mice, but were higher than those of the untreated naglu−/- mice. The intergroup differences progressed further at 46 weeks. Trehalose treatment had no significant effect on cone a-wave. (g and h) There was no significant difference in the amplitude of the cone a-wave between the 3 groups at week 28. Both treated and untreated naglu−/- mice had lower amplitudes of the cone a-wave compared to the WT mice at week 46. (c–h) Data are means (n = 8) ± SE. *p ≤ 0.05, **p ≤ 0.01. ns, not significant.
naglu–/ – mice also showed significantly reduced amplitudes of a-wave at several stimulus levels (Figure 2(e–f)). The a-wave responses from the 2 brightest stimuli were fitted using a formula devised by Cideciyan and Jacobson [45] to determine the maximum response amplitude (Rmax) for each group (for detailed methodology see [46]). Rmax was 309.0 ± 9.1 µV for WT mice and 125.2 ± 6.0 µV for naglu–/ – mice at 28 weeks (60% reduction, P < 0.01). The Rmax was 294.3 ± 6.21 µV for WT mice and 44.8 ± 3.9 µV for naglu–/ – mice at 46 weeks (85% reduction, P < 0.01). Similar to that of the b-wave, the increased intergroup difference of a-wave over time suggests progressive degeneration of the rod photoreceptor.
Trehalose treatment mitigated dysfunction of the rod pathway (Figure 2(a–f)). Treated naglu–/ – mice showed higher amplitudes of rod ERG a- and b-waves at both time points, indicating functional rescue of degenerating rod photoreceptors and possibly of rod bipolar cells. At 28 weeks of age, trehalose-treated and untreated naglu–/ – mice had a Bmax of 339.6 ± 26.7 µV and 276.0 ± 12.5 µV, respectively (22% increase, P < 0.05) and an Rmax of 184.6 ± 28.9 µV and 125.2 ± 6.0 µV, respectively (47% increase, P < 0.01).
naglu–/ – mice also displayed reduced amplitude of the cone a-wave compared with WT mice, but this only became apparent at the 46th week (Figure 2(g–h)). Cone a-waves were −42.1 ± 3.3 µV for WT mice and −24.7 ± 1.9 µV for naglu–/ – mice (one-way ANOVA, Bonferroni post hoc, P < 0.05). This finding implies a rod-cone order of retinal dysfunction and is consistent with observations reported in MPS III patients, who often experience night blindness as their first symptom and exhibit a more severe reduction in their rod ERG compared to their cone ERG [5,47]. There was also a subtle reduction of cone b-wave in naglu–/ – mice compared with the WT, but this variation was statistically insignificant (Fig. S3A-B).
Table 1 shows the mean b-wave:a-wave ratios under various experimental conditions. Compared with the WT, naglu–/ – mice had generally higher b-wave:a-wave ratios. Such gains were more pronounced in rod-driven ERG (74 to 102% increase) than cone ERG (29 to 40% increase). This implies that the a-wave was more affected than the b-wave and indirectly supports the notion that photoreceptors, not bipolar cells, are the primary site of retinal dysfunction.
Table 1.
Ratios of b-wave:a-wave.
| Rod or cone origin | Group | b:a (28th week) | b:a (% of WT) | b:a (46th week) | b:a (% of WT) |
|---|---|---|---|---|---|
| Rod | WT | 3.56 | 100.0 | 4.39 | 100.0 |
| KO | 7.22 | 202.5 | 7.65 | 174.3 | |
| KO+Tre | 4.62 | 129.5 | 5.83 | 132.8 | |
| Cone | WT | 6.07 | 100.0 | 5.67 | 100.0 |
| KO | 7.83 | 129.0 | 7.95 | 140.3 | |
| KO+Tre | 6.03 | 99.4 | 6.27 | 110.7 |
Values for rod ERG were based on scotopic ERG data measured at stimulus strength of 112.2 isomerizations/rod, which was below the threshold for cones. Values for cone ERG were calculated from pair-flash data in which rod activity was suppressed. b:a, b-wave:a-wave ratio.
Trehalose reduces degeneration of rod photoreceptors and rod bipolar cells in MPS IIIB mice
Untreated naglu–/ – mice (n = 4/group) at 46 weeks of age showed retinal degeneration in the outer nuclear layer (ONL) and the inner nuclear layer (INL), in both central and peripheral regions of the retina, as revealed by markers of cone photoreceptors (GNAT2) and rod bipolar cells (PRKCA/PKCα) (Figure 3(a,b))Staining with TO-PRO showed that the thickness of the photoreceptor layer (Figure 3(c))which contains both cone and rod photoreceptors, was significantly reduced in untreated naglu–/ – mice compared to age-matched WT mice in both central and peripheral regions (central: 5.75 ± 0.36 cells vs. 10.5 ± 0.001 cells, P = 0.004; peripheral: 5 ± 0.31 cells vs. 8.75 ± 0.3 cells, P = 0.008). The trehalose-treated naglu–/ – group, however, retained near-wild-type levels of cells in the photoreceptor layer (ONL) in both the central and peripheral regions (treated versus untreated naglu–/ – mice: 9.25 ± 1.25 cells, P = 0.03; peripheral: 8.5 ± 1.9 cells, P = 0.05). Remarkably, retinas from trehalose-treated naglu–/ – mice were histologically indistinguishable from retinas from WT mice (central: P = 0.3; peripheral: P = 0.85). It is worth noting that the treatment had no adverse effect and did not change the number of photoreceptor cells in the WT mice (central: 10.25 ± 0.125, P = 0.76; peripheral: 9.5 ± 0.125, P = 0.32) (Figure 3(c))
Figure 3.
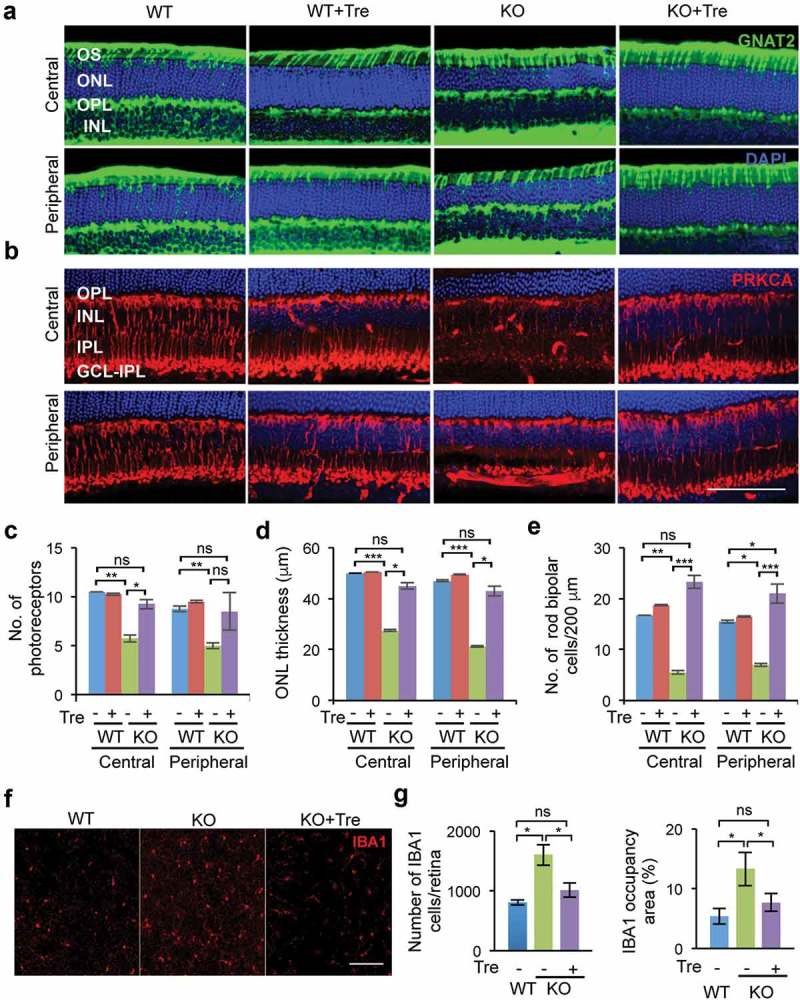
Trehalose treatment rescues retinal degeneration of naglu−/- mice. Immunofluorescence analyses of retinal neurons were performed using specific markers for cones (GNAT2, panel A, green) and for rod bipolar cell (PRKCA/PKCα, panel B, red) (b) in central and peripheral sections of the retina, together with the TO-PRO3 dye (blue) that stained both rod and cone nuclei. The animals were sacrificed at 46 weeks of age, after the second time point of the electroretinography measurement. Whole retinae of test mice (n = 4 per group) were collected and then hemisected. Using a vibrating microtome, the temporal half of the retina was vertically sectioned and stained. Sections containing the optic nerve head were analyzed. Quantification and statistical analysis of the images show a rescue in the number of both photoreceptors (c) and rod bipolar cells (d) in naglu−/- mice treated with trehalose compared to untreated mice. (e) The thickness of the photoreceptor layer was reduced in untreated naglu−/- mice, but was preserved in trehalose-treated naglu−/- mice. Staining for the inflammatory marker, IBA1, in flat retina sections (f) revealed fewer macrophages/microglia in treated naglu−/- mice compared to untreated mutant mice. The number of IBA1-positive cells/μm2 was significantly reduced in treated naglu−/- mice compared to untreated groups as shown in the graphs (g). Data are means ± SE. *p ≤ 0.05, **p ≤ 0.01 and ***p ≤ 0.001. ns, not significant. Scale bars: (a) and (b) 100 μm, (f) 200 μm.
These effects on cell number were reflected in the thickness of the outer nuclear layer (ONL) or photoreceptor layer, which was significantly lower in untreated naglu–/ – than in WT mice (central: 27.5 ± 0.36 µm and 50 ± 0.001 µm, P = 0.0005; peripheral: 21.25 ± 0.31 µm and 47 ± 0.306 µm, P = 0.000006). Trehalose treatment significantly increased the thickness of the ONL layer in naglu–/ – mice compared to the untreated mutant group (central: 45 ± 1.25 µm, P = 0.015; peripheral: 43 ± 1.92 µm, P = 0.031), rendering it indistinguishable from that of WT mice (central: P = 0.35; peripheral: P = 0.64). Trehalose treatment did not alter the thickness of the photoreceptor layer (ONL) in the WT mice (central: 50.5 ± 0.125 µm, P = 0.35; peripheral: 49.5 ± 0.125 µm, P = 0.107) (Figure 3(d))Quantitative image analysis of the ONL layer using the cone photoreceptor marker GNAT2, showed that there was no significant change in the cone photoreceptors in the naglu–/ – mice (Figure 3(a) and Fig. S4A) and that the treatment with trehalose did not affect the cone photoreceptors in mice of either genotype (Fig. S4A). Thus, the decrease in the thickness of the ONL layer and reduced total number of photoreceptors in the absence of any loss of cone photoreceptors strongly suggests that there is a significant loss in rod cells.
In the inner nuclear layer (INL), untreated naglu–/ – mice had significantly fewer rod bipolar cells (RBCs) than WT (central: 5.5 ± 0.36 and 16.75 ± 0.0001, respectively, P = 0.004; peripheral: 7 ± 0.31 and 15.5 ± 0.3, P = 0.006). Again, trehalose treatment did not adversely affect the number of rod bipolar cells in the inner nuclear layer (INL) of WT mice (central: 18.75 ± 0.12, P = 0.43; peripheral: 16.5 ± 0.12, P = 0.67) (Figure 3(b,e))The trehalose-treated naglu–/ – group showed far less degeneration of rod bipolar cells in both central and peripheral regions of the retina (central: 23.25 ± 0.11, P = 0.0006; peripheral 21 ± 0.11, P = 0.0009). Indeed, the rod bipolar cell density in treated naglu–/ – mice did not differ significantly from that of the WT mice (central: P = 0.06; peripheral: P = 0.03) (Figure 3(e))
Activated microglial cells were immunolabeled with Iba-1 to determine the amount of inflammation in flat-mounted retinae at 46 weeks of age. Confocal microscopy showed increased inflammation in the retina of naglu–/ – mice as measured by the number of IBA1-positive cells and IBA1 signal occupancy area; treatment with trehalose, however, resulted in significantly lower levels of both IBA1-positive cells (P = 0.01) and occupancy area (P = 0.02), down to levels indistinguishable from that of WT mice (Figure 3(f–g)) Quantification of GFAP-positive Muller cells in the flat retina from trehalose-treated or untreated naglu–/ – mice, and WT controls showed no significant differences between the experimental groups (Fig. S4B and S4C).
Trehalose treatment decreases astrocyte activation and lowers inflammation in the brain of MPS IIIB mice
We euthanized 4 naglu–/ – mice and 4 age-matched WT controls at 20 and 40 weeks of age to collect brains for cryosectioning (section thickness = 40 μm), immunostaining for GFAP (astrocytes) and CD68 (microglia), and imaging for thresholding analyses of immunoreactivity. The barrel field region in the somatosensory cortex (S1BF) and the ventral posteromedial/ventral posterolateral (VPM/VPL) nuclei of the thalamus were selected as 2 regions particularly affected in this disease, as noted previously [7]. Quantification of GFAP immunostaining and occupancy area (Figure 4(a)) in 30 fields/animal (n = 4 animals/group) showed that astrocytes were intensely activated in the S1BF region in naglu–/ – mice at 20 and 40 weeks of age, which was significantly mitigated by trehalose treatment at 20 weeks (P ≤ 0.05) but not at 40 weeks (P > 0.05). Similarly, the intensity of GFAP immunoreactivity was significantly lower in VPM/VPL nuclei of the thalamus of 20-week-old treated naglu–/ – mice compared to untreated naglu–/ – mice (P ≤ 0.05), but not at 40 weeks of age (P > 0.05) (Figure 4(a)). The significant reduction in astrocytosis at 20 weeks of age was confirmed with immunoblot analysis of whole brain homogenates (Figure 4(b)). There was no difference in GFAP protein levels between trehalose-treated and untreated naglu–/ – mice at 40 weeks of age by immunoblot analysis (data not shown).
Figure 4.
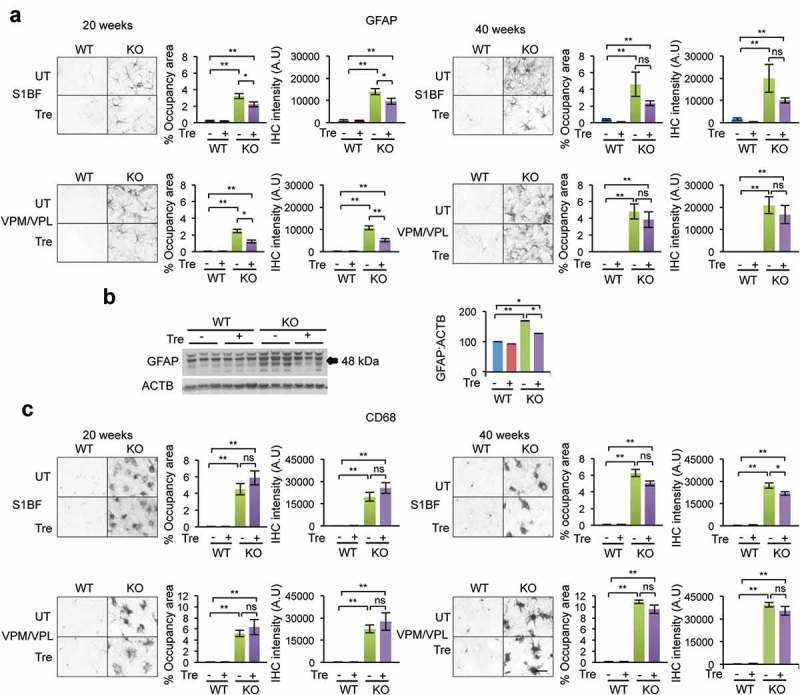
Immunohistochemistry analysis of neuroinflammatory markers in the cortex and thalamus. Immunostaining for astrocytes (GFAP) (a) and microglial cells (CD68) (C) in the somatosensory cortex (S1BF) and the ventral posterior nuclei of the thalamus (VPM/VPL) in trehalose-treated and untreated naglu−/- mice and their respective WT controls. Quantification of GFAP immunoreactivity revealed a significant reduction in astrocytosis in both the cortical and thalamic regions of naglu−/- mice that were treated with trehalose compared to non-treated mutant mice (a). Immunoblot of the whole brain lysate confirmed the significant reduction of astrocytosis at 20 weeks (b). (c) Quantifying CD68 immunoreactivity revealed a small trend in reduction in microglial activation upon trehalose treatment in the cortical region of 40-weeks-old naglu−/- mice. Data are means ± SE. *p ≤ 0.05, **p ≤ 0.01. ns, not significant. Scale bar: 50 μm. A.U, arbitrary units.
CD68-positive microglial cells predominantly exhibited a phagocytic morphology in untreated naglu–/ – mice as early as 20 weeks (Figure 4(c)). Compared to untreated naglu–/ – mice, the levels of CD68 immunoreactivity were not significantly reduced in the S1BF of trehalose-treated naglu–/ – mice at 20 or 40 weeks of age. Similarly, CD68 immunoreactivity in the thalamus of treated naglu−/- mice did not differ from untreated naglu−/- mice at either 20 or 40 weeks of age (Figure 4(c)).
Trehalose increases clearance of autophagic vacuoles in the cortex and cerebellum of MPS IIIB mice
Transmission electron microscopy (TEM) image analysis of naglu–/ – mice revealed marked accumulation of storage material in autophagic vacuoles (AV) by 40 weeks of age, in both cortical neurons and Purkinje cells (Figure 5(a,b)). Trehalose treatment significantly reduced the number of large autophagic vacuoles (indicated with arrows in magnified images) in the cortex (0.2 ± 0.11; 0.9 ± 0.12 AV/cell; n = 20 cells; P = 0.0002) and cerebellum (0.8 ± 0.2; 4.7 ± 0.94 AV/cell; n = 10 cells; P = 0.002) (Figure 5(a–b)). Large inclusions within microglia in the cortex were also seen in naglu–/ – mice (Figure 5(c)), as previously reported [48]. These inclusions were not found in trehalose-treated naglu–/ – mice (Figure 5(c)), which might be due to an increase in autophagic flux. Indeed, the conversion rate of the cleaved and unlipidated form of MAP1LC3B/LC3B (microtubule-associated protein 1 light chain 3 beta) to its lipidated form (LC3-II:LC3-I, a conventionally used marker of autophagy) increased significantly (P = 0.003) in trehalose-treated naglu–/ – mice (Figure 5(d)), but the level of SQSTM1/p62, a marker of autophagosomes, was not changed (P = 0.3) (Figure 5(e)) despite increased transcription (Sqstm1 is a TFEB direct target [49]; see below and Figure 7(c–d)), indicating autophagic degradation. Together, these observations indicate that trehalose treatment promoted autophagic flux in the brains of naglu–/ – mice.
Figure 5.
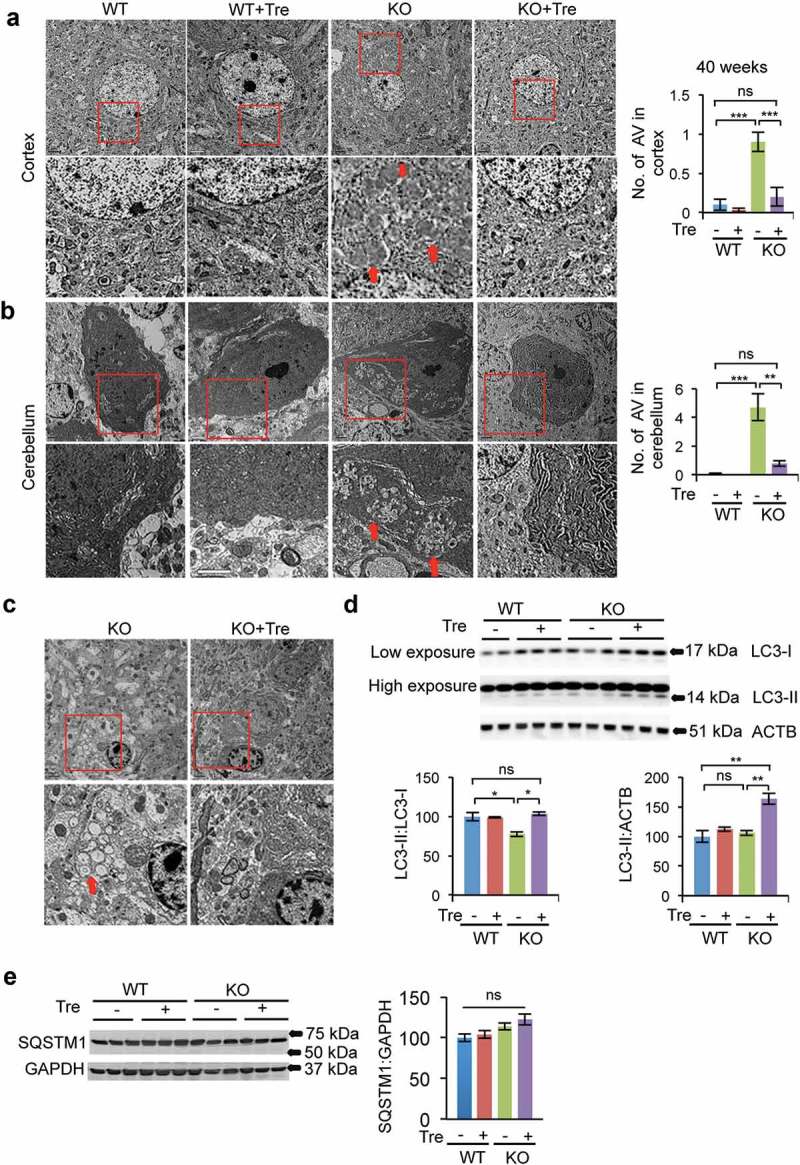
Rescue of vacuolization in brain tissue of naglu−/- mice upon trehalose treatment. TEM images of the cortex (a) and cerebellum (b) from 40-weeks-old naglu−/- mice showed an increased presence of autophagic vacuoles, the site of storage of undigested material, compared to WT controls. Trehalose administration significantly reduced the abundance of autophagic vacuoles in samples from naglu−/- mice, thereby normalizing cellular vacuolization. N = 20 cells per group in cortex and 10 cells per group in cerebellum. The autophagic vacuoles in microglia of the naglu−/- mice were cleared upon trehalose treatment (c). (d) The LC3-II:LC3-I ratio was increased significantly upon trehalose administration. (e) SQSTM1/p62 levels were not changed upon trehalose administration. Data are means ± SE. *p ≤ 0.05, **p ≤ 0.01, ***p ≤ 0.001. ns, not significant. Scale bar: 2 μm.
Figure 7.
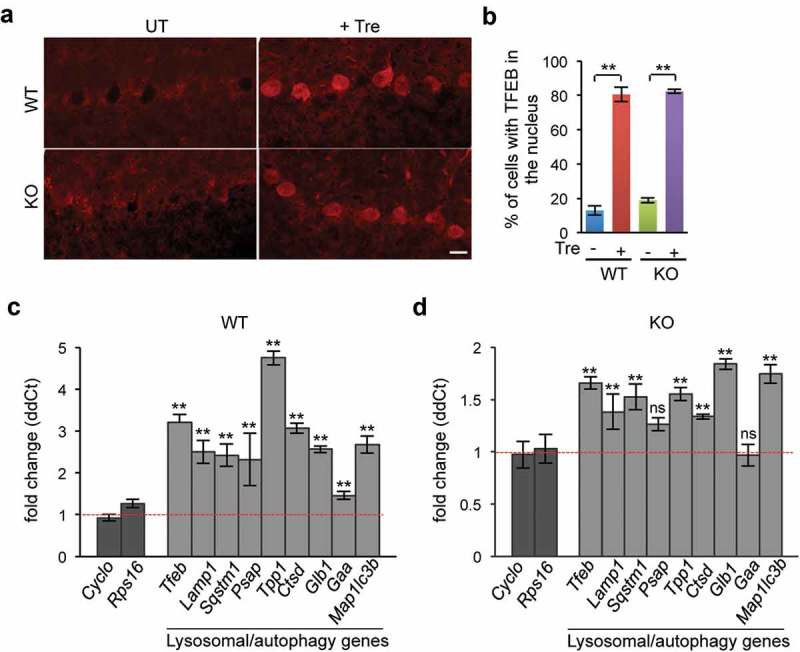
Trehalose promotes TFEB nuclear translocation and activation of the TFEB transcriptional network in vivo. (a) Immunofluorescence of Purkinje cells showing that TFEB was translocated to the nucleus upon trehalose treatment in both WT and naglu−/- mice. (b) Quantification of the number of cells with TFEB in the nucleus in the indicated genotypes and conditions. (c–d) RT-qPCR analysis of mRNAs extracted from WT (c) or KO (d) brain homogenates showing increased transcriptional levels of TFEB target genes of the autophagy-lysosomal system upon trehalose treatment (n = 3 per group). Data are means ± SE. **p ≤ 0.01. ns, not significant. Scale bar: 30 μm.
We also checked whether trehalose improved the clearance of ubiquitin-positive inclusions, which have been previously described in the brain of naglu–/ – mice [50]. Immunohistochemistry analysis of the cortex of naglu–/ – mice showed appearance of these inclusion bodies which, differently from the autophagic vacuoles, was not affected by trehalose treatment (Fig. S5).
Trehalose induces autophagy in photoreceptor cells
We used photoreceptor-derived 661W cells and mouse embryonic fibroblasts (MEFs) to investigate in more detail the relationship between trehalose and autophagy. Transient transfection with plasmids expressing GFP-RFP-LC3 or GFP-RFP-SQSTM1 showed a decreased GFP:RFP ratio upon trehalose treatment, indicating increased protein degradation due to fusion of autophagosomes with lysosomes (Figure 6(a–c)). We then used shRNAs to knock down the autophagy gene Atg7 (Fig. S6). We infected 661W and MEF cells with an Atg7 shRNA vector or a control vector and performed treatments with trehalose and/or bafilomycin A1. In both cell types, the LC3-II:LC3-I and LC3-II:GAPDH ratio was significantly increased by treatment with trehalose, and such increase was reduced upon Atg7 knockdown (Figure 6(d-f,h-j)). SQSTM1/p62 levels were also increased upon trehalose administration (Figure 6(g–k)). Additional treatment with bafilomycin A1 further increased the LC3-II:LC3-I and LC3-II:GAPDH ratios, which is an indication of an increase in autophagy flux (rather than a block in autophagic clearance) upon trehalose treatment (Figure 6(e–f,i–j)). Because the genes encoding LC3B and SQSTM1 are transcriptional targets of TFEB [18,49], a possible explanation for the observed increased levels of LC3 and SQSTM1 upon trehalose treatment is increased transcription due to increased TFEB activation (see below Figure 8(c–d)).
Figure 6.
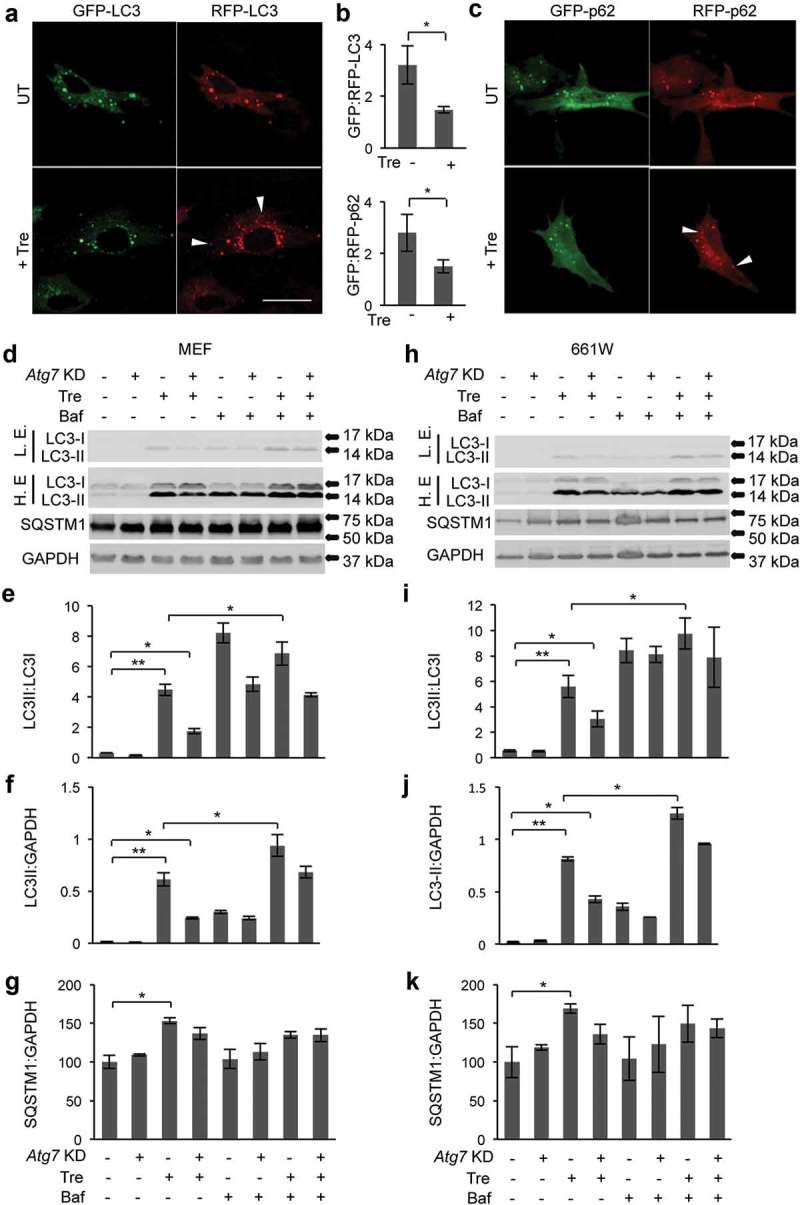
Induction of autophagic flux in photoreceptor cells upon trehalose treatment. (a–c) 661W cells transiently transfected with a plasmid encoding GFP-RFP-LC3 (a) or GFP-RFP-SQSTM1 (c) and treated with trehalose for 72 h showed a decrease in GFP:RFP ratio, indicating increased autophagic flux (b). Arrowheads indicate puncta that are RFP-positive and GFP-negative. (d–f) Knockdown of Atg7 in MEF cells and photoreceptors treated with trehalose decreased LC3-II:LC3-I and LC3-II:GAPDH ratios and did not change SQSTM1/p62 levels. Additional treatment with bafilomycin A1 increased the LC3-II:LC3-I ratio, indicating that treatment with trehalose induces autophagic flux (d–f and h–j). Data are means ± SE. *p ≤ 0.05, **p ≤ 0.01, ***p ≤ 0.001. ns, not significant. Scale bar: 20 μm.
Figure 8.
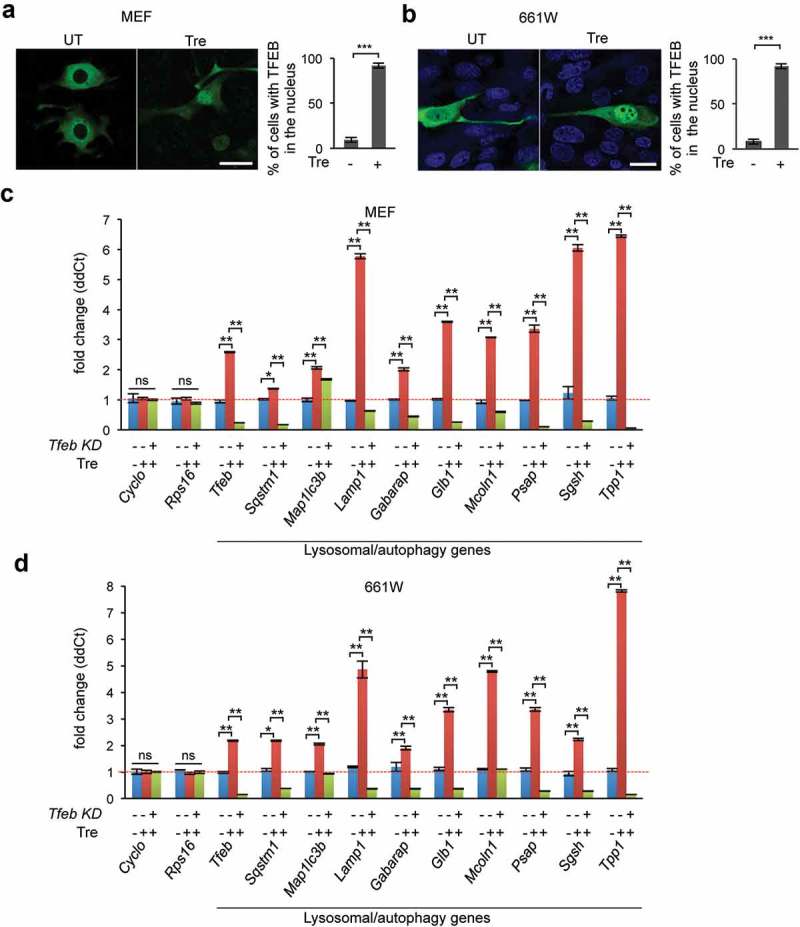
Trehalose promotes transcriptional activation of autophagy and lysosomal genes via TFEB. (a–b) MEF cells (a) and photoreceptor cells (b) were transiently transfected with a plasmid encoding TFEB-GFP and treated with trehalose, which resulted in nuclear translocation of TFEB (n = 40–45 cells/condition). (c-d) RT-qPCR analysis showing increased transcriptional levels of TFEB genes of the autophagy-lysosomal system upon trehalose treatment in MEF cells (c) and in photoreceptor cells (d) (n = 3 per group). Knockdown of Tfeb counteracted trehalose-induced transcriptional activation of autophagy-lysosomal genes, demonstrating that trehalose enhances lysosomal function via TFEB. Data are means ± SE. **p ≤ 0.01, ***p ≤ 0.001. Scale bars: 20 μm.
Trehalose activates the TFEB transcriptional network in the brain of MPS IIIB mice
To determine whether the amelioration of neuropathology and restored clearance of autophagic vacuoles observed in trehalose-treated naglu–/ – mice were associated with activation of TFEB, we first investigated whether trehalose promotes TFEB nuclear translocation (a marker of TFEB activation [17]) in naglu–/ – mice. Confocal microscopy analysis of mouse brain sections stained for endogenous TFEB showed that the percentage of cells with TFEB in the nucleus increased dramatically upon oral trehalose administration (Figure 7(a–b)). To investigate whether trehalose treatment enhances TFEB activity in the naglu–/ – brain, we performed real-time qPCR analysis of a set of TFEB transcriptional targets using mRNAs extracted from the brain of trehalose-treated and control mice. The results showed that trehalose treatment significantly increased the transcription of TFEB autophagy-lysosomal target genes in the brain of both WT (Figure 7(c)) and naglu–/ – mice (Figure 7(d)).
Trehalose activation of the autophagy-lysosomal network is TFEB dependent
Confocal microscopy analysis of 661W and MEF cells transfected with a plasmid encoding TFEB-GFP confirmed significantly increased nuclear translocation of TFEB upon trehalose treatment (Figure 8(a–b)). To test whether trehalose-mediated activation of the autophagy-lysosomal network is dependent on TFEB, we used a Tfeb shRNA [51] to knock down Tfeb in MEF cells and photoreceptor cells. Viral-infected cells (MEF-Tfeb-KD and 661W-Tfeb-KD) were selected with antibiotics for 10 days and then treated with trehalose for 24 h. qPCR analysis of transcripts from untreated and trehalose-treated MEF-Tfeb-KD, 661W-Tfeb-KD and control cells showed that treatment with trehalose enhanced the transcription of TFEB target genes, which was hampered by Tfeb knockdown in both cell lines (Figure 8(c–d)). These results demonstrate that trehalose enhances the autophagy-lysosomal pathway via activation of TFEB.
Discussion
This work demonstrates the therapeutic potential of small-molecule drug-induced autophagy enhancement in a mouse model of neurodegenerative disease caused by the deficiency of a lysosomal enzyme. Oral administration of trehalose, a known pharmacological enhancer of autophagy, increases the life span and normalizes several behavioral and neuropathological features of MPS IIIB mice, most notably rescuing their retinal degeneration. Because no disease-modifying therapies are currently available for MPS IIIB or related disorders, this study establishes a viable new approach to pharmacotherapy that could be tested either alone or in combination with other approaches under development [5,12–15,52].
We recently demonstrated that loss of function in rod photoreceptors in MPS IIIB mice is followed by a loss of function of the cones [44]. We have now shown that trehalose treatment rescues the impaired electroretinogram response and preserves the layered structure of the retina. Improvement of retinal function and preservation of tissue structure correlates with a substantial reduction of inflammation in the retina, which was paralleled by a reduction of gliosis in different regions of the brain. It is worth noting that such reduction was observed at an earlier, but not later, time point. The finding that mouse survival is extended despite no apparent differences in neuroinflammation late in the life of these mice may suggest that neuroinflammation itself is not a driving cause of mouse death. Importantly, trehalose treatment cleared autophagic vacuoles that accumulated in both neurons and microglial cells. Because such accumulation of autophagic vacuoles is considered a primary cause of neuronal degeneration [53–57], the observed clearance is likely to be the key event underlying the improved disease phenotype. Furthermore, reduction of autophagic vacuoles was accompanied by increased activity of TFEB, a master regulator of lysosomal biogenesis and function [17]. Trehalose-mediated increase of autophagic flux was blocked by Atg7 knockdown, and trehalose-mediated transcriptional induction of the autophagy-lysosomal network was blocked by Tfeb knockdown, thus demonstrating that trehalose effects rely on TFEB and an active autophagy pathway. These results strongly suggest that enhancement of the autophagy-lysosomal pathway can be effective in counteracting neurodegeneration in lysosomal storage diseases caused by enzyme deficiency. Whether or not the observed rescue of retinal degeneration depends directly on increased autophagy remains to be investigated.
Trehalose has been tested as an experimental therapy in various models of neurodegenerative diseases that are characterized by formation of protein aggregates, and may exert its effects via several different possible mechanisms of action. Trehalose has peculiar physical-chemical properties that confer chaperone-like activities [42], such as the ability to stabilize mutant proteins [41,42,58]. Moreover, protein aggregates in neurodegenerative diseases are substrates of autophagy [21,36,59,60], a pathway that is enhanced by trehalose [30–40]. Finally, trehalose protects neurons by reducing cytotoxic reactive oxygen species [38,61]. Together with our data from this study, these findings indicate that trehalose administration can be regarded as a viable potential strategy for neurodegenerative diseases that are characterized by accumulation of intracellular material due to impairment of enzyme-based catabolic pathways such as lysosomal degradation of glycosaminoglycans. Consistent with previous studies investigating the long-term effects of trehalose [34], our data demonstrate that trehalose treatment is more effective at an early stage of disease progression. While the effects of trehalose on neuronal function have not been measured previously, our electrophysiological studies show that reduction of inflammation and protection of photoreceptors are accompanied by improved neuronal function.
Trehalose enhances autophagy by activation of AMPK through inhibition of the SLC2A8/GLUT8 receptor [62,63]. We have recently shown that trehalose activates TFEB through inhibition of AKT, a negative regulator of TFEB [64]. A growing body of evidence shows that TFEB-mediated enhancement of clearance via lysosomal biogenesis and increased autophagic flux counteracts the accumulation of different proteinaceous materials and slows disease progression in various animal models of disease [21–25,37,65]. Notably, in these studies, clearance of the abnormally accumulated material exerts protective effects against neuronal death, regardless of the nature of the stored material and the pathway by which it would normally be degraded. Our data show that oral trehalose administration protects neurons from the pathological accumulation of glycosaminoglycans and that autophagic vacuoles – the putative sites of glycosaminoglycan accumulation – are dramatically cleared from neurons. Thus, if appropriately stimulated, neurons can restore the clearance of intralysosomal material even in the absence of catabolic enzymes, most likely through processes such as lysosomal exocytosis [19]. It is noteworthy that possible therapeutic applications of trehalose may be challenged by the presence of trehalase, a specific trehalose-degrading enzyme, in the intestine, kidney, and other organs in mammals [66]. It remains to be investigated if the protective effects observed upon trehalose oral administration are entirely due to direct exposure of the trehalose fraction that is able to reach the brain or if additional, secondary pathways possibly triggered by dietary trehalose may also play a protective role.
Enzyme replacement therapy and gene therapy have been considered the most promising routes for therapeutic intervention in lysosomal storage disorders, particularly those caused by enzyme deficiency [5,12–15]. However, some of these enzymes – including NAGLU – are not able to cross the blood-brain barrier [13], which precludes systemic administration of the deficient enzyme as a direct route of enzyme supply. To overcome this hurdle, direct injection of corrective viruses to the cerebrospinal fluid and viral intraparenchymal injections are being investigated [67–69]. The promising preclinical results from this approach have led to it being tested in humans (a current example is described at ClinicalTrial.gov under ID No. NCT02053064). Another recent pre-clinical study demonstrated that viral-mediated gene therapy could be used to co-opt the liver to express a modified enzyme that can permeate the blood-brain-barrier, which was effective in treating a mouse model of MPS IIIA [70]. Longer-term studies will be needed to investigate the safety and effectiveness of these approaches. Other proposed treatments, including substrate reduction and use of anti-inflammatory reagents, can contribute to mitigating aspects of MPS pathology [12,52,71]. Because of its exceptionally good toxicological profile [72,73], trehalose might be safely used in combination therapies to investigate its additive or synergistic effects with other therapeutics.
In conclusion, this study successfully tests for the first time trehalose in a neurodegenerative disease that is not a proteopathy. MPS IIIB is indeed characterized by the intralysosomal accumulation of a NAGLU degradation substrate, heparan sulfate. No prior data could indicate whether or not a drug therapy of autophagic enhancement would have any effects on a neurodegenerative disease characterized by non-proteinaceous undegraded material. Our study reveals that trehalose in fact exerts clearance effects and therefore opens completely unexplored avenues for the possible treatment of lysosomal storage disorders caused by the deficiency of lysosomal enzymes. In addition, no treatment tested so far in pre-clinical studies of MPS (including gene therapy, enzyme replacement therapy, bone marrow transplantation or substrate reduction therapy) has been reported to modify retinal degeneration and loss of vision. Results from our study show that trehalose treatment accomplishes both, in a MPS IIIB model. Because much of the quality of life of patients suffering from MPS IIIB is associated with loss of vision, our study finally introduces a possible avenue to mitigate this devastating clinical outcome.
Materials and methods
Animals
The mouse colony was established and expanded by mating 7 female heterozygous B6.129S6-NaglutmEfn/J and 7 male C57BL6/J obtained from the Jackson Laboratory. The naglu−/- KO mice were maintained on the C57BL6/J background by mating B6.129S6-NaglutmEfn/J heterozygous male and female mice, with only male WT and naglu−/- KO subsequently used in our experiments. Genotyping was done using the primers indicated in the Jackson Laboratory. All the mice procedures were performed following the IACUC protocol and animal welfare approved by Baylor College of Medicine.
Open-field analysis
The open-field test was used to evaluate locomotor activity and emotional response [74]. The apparatus was a transparent square cage. naglu−/- KO mice and their WT age-matched littermates were grouped in trehalose-treated and untreated groups (n = 12 mice per group). Prior to the experiment mice were placed in the experimental room for 30 min for acclimation. Each mouse was placed in the open-field apparatus and recorded for 30 min. Total distance traveled (cm) and distance travelled in the center area was measured when mice were 20-weeks and 36-weeks old. Mice were weighted before performing the second time point of behavioral analyses.
Electroretinography
Scotopic ERGs were recorded bilaterally from naglu−/- KO mice and their WT littermates when they were 28 and 46 weeks of age. Prior to testing, mice were allowed to adapt to the dark overnight. Under dim red light, mice were anesthetized with a weight-based intraperitoneal injection of solution containing ketamine (46 mg/ml), xylazine (9.2 mg/ml), and acepromazine (0.77 mg/ml). Both pupils were dilated with a drop each of 1% tropicamide and 2.5% phenylephrine, and the corneas anesthetized with 0.5% proparacaine hydrochloride. Mice were placed inside a Ganzfield dome coated with highly reflective white paint (Munsell Paint, New Windsor, NY) on a heating pad maintained at 39°C. A drop of 2.5% methylcellulose gel (Goniosoft; Ocusoft Inc, 743–20) was applied to the eye and a blunt platinum rod electrode placed in contact with the center of each cornea. Ground and reference platinum subdermal electrodes were gently inserted in the tail and the forehead, respectively. The mice were then kept in complete darkness for 5 min for stabilization.
Half-millisecond square flashes for scotopic a-wave and b-wave measurements were produced by cyan light-emitting diodes of 503-nm peak wavelength, calibrated with a photometer (International Light Technology, ILT1700) and converted to the unit photoisomerizations/rod (R*/rod) [75,76] where 1 scot cd m^2 = 581 photoisomerizations/rod/sec. At the lowest intensity, 25 responses were averaged with a delay of 2 sec between each flash. As the intensity of the flash increased, fewer responses were averaged with a longer delay between flashes. At the end of the scotopic protocol, a pair of 1500W xenon lamps (Novatron, 2103FC) attenuated with apertures and diffusers was used to produce 2 saturating light stimuli. The cone ERG was studied by a paired-flash method using the xenon flashes. An initial conditioning flash saturates both rods and cones 2 sec before a probe flash. The ERG recorded by the probe flash is attributed to responses driven by the cones because cones recover faster than rods.
Electrical signals were amplified with a Grass P122 amplifier (Grass Instruments; West Warwick, RI) and band pass filtered from 0.1 to 1,000 Hz. Data were digitized with a National Instruments data acquisition unit (National Instruments, USB-6216) at a 10-kHz sampling rate, and analyzed with custom Matlab codes (MathWorks; Natick, MA). To remove oscillatory potentials before fitting, the scotopic b-wave was digitally filtered using the filtfilt function in Matlab (low-pass filter; Fc = 60 Hz). The a-wave was measured from baseline to trough of the initial negative deflection (unfiltered) and the b-wave was measured from the a-wave trough to the peak of the subsequent positive. Statistical analyses were performed using ANOVA with SNK post-hoc or unpaired t-test where appropriate.
Auditory brainstem response (ABR) measurements
Briefly, 2-, 4- and 6-month-old mice (N = 4–6 per genotype/treatment group) were anesthetized using an intraperitoneal injection of ketamine (100 mg/kg) and xylazine (10 mg/kg) and immobilized in a head holder. Normal body temperature was maintained throughout the procedure by placing the mice on a heating pad. Pure tone stimuli from 4 kHz to 48 kHz were generated using Tucker Davis Technologies System 3 digital signal processing hardware and software (Tucker Davis Technologies; Alachua, FL), and the intensity of the tone stimuli was calibrated using a type 4938 1/4″ pressure-field calibration microphone (Brüel and Kjær, Nærum, Denmark).
Response signals were recorded with subcutaneous needle electrodes inserted at the vertex of the scalp, the postauricular region (reference) and the back leg (ground). Auditory thresholds were determined by decreasing the sound intensity of each stimulus from 90 dB to 10 dB in 5 dB steps until the lowest sound intensity with reproducible and recognizable waves in the response was reached.
Mean hearing thresholds ± standard deviations (dB SPL) were plotted as a function of stimulus frequency (kHz). Statistical analysis consisted of one-way analyses of variance (ANOVAs) to reveal overall trends accompanied by two-tailed Student’s t-tests at individual frequencies to evaluate frequency-specific effects. T-test p values were adjusted for multiple comparisons using the Holm method. R (version 2.13) was used for all statistical analyses.
Pathology and immunostaining
Brain: Mice were deeply anesthetized using Isothesia (Isoflurane) solution (Henry Schein Animal Health, 029404) and their brains were removed intact and hemisected before making a cut rostral to cerebellum to remove it using scalpel blades. Half was frozen in liquid nitrogen and stored in −80ºC for protein extraction; the other half of the brain was immediately fixed in freshly made 4% paraformaldehyde in Dulbecco’s phosphate-buffered saline without calcium and magnesium (PBS; GeneDEPOT, CA008-050). After 24 h, brains were moved to 30% sucrose solution and kept on a shaking plate at 4ºC until the tissue sank. Immunohistochemistry was performed on 40-μm thick floating sections using an antibody against GFAP (Dako, 1:8000) for astrocytes, CD68 for microglia (AbD Serotec, MCA1957; 1:2000), ubiquitin for polyubiquitinated proteins (Dako, Z045801-5; 1:2000) and TFEB (Proteintech, 13372–1-AP; 1:300).
Retina: Mouse eyes were enucleated under deep anesthesia, before the mice were euthanized by an overdose of anesthesia. The eyes were marked for orientation and carefully dissected to isolate the whole retina, which was then incubated in 4% paraformaldehyde in PBS at room temperature for 45 min for fixation. The whole retina was first hemisected, then the temporal half of each retina was cut into 40-µm vertical sections. Sections were stained free-floating using PRKCA/PKCα antibody (BD Transduction Laboratories; 610107; 1:250) as a marker for rod bipolar cells. Cone and rod photoreceptor nuclei in the outer nuclear layer were visualized using the fluorescent nuclear dye TO-PRO3 (ThermoFisher Scientific, T3605; 1:3000) and cone cell bodies were immuno-labeled with antibody against GNAT2 (Santa Cruz Biotechnology, Sc-390; 1:100). Activated microglia were immune-labeled with IBA1 antibody (Wako Chemicals, 01919741; 1:500)
Images were acquired with Zeiss LSM software using 40x and 63x oil-immersion objectives. Two designated regions within the sections, representing central and peripheral retina, were photographed. To measure the number of cone photoreceptors (GNAT2 +ve cells) and rod bipolar cells (PRKCA +ve cells), cells with positive staining were counted in 200-µm length, using the ruler and cell counter in ImageJ software. The dimensions of the outer nuclear layer and the inner nuclear layer were measured using ImageJ.
Transmission electron microscopy
Mice were anesthetized and perfused intracardially with PBS followed by 2% formaldehyde + 2.5% glutaraldehyde in 0.1 M sodium cacodylate buffer (pH 7.4). Brains were carefully removed and the cortex and cerebellum were cut into smaller pieces and further fixed in the same fixative for 24 h. Slices were then post-fixed in 1% OsO4 in 0.1 M cacodylate for 1 h, stained with saturated uranyl acetate in 50% ethanol, dehydrated, and embedded in electron microscopy embedding media Spurr’s low viscosity resin (Electron Microscopy Sciences, 14300). Sections were cut longitudinally at 60-nm thickness on an RMC MT6000 ultra-microtome. The cortical and cerebellar sections were examined with a Hitachi H7500 transmission electron microscope and images were captured using a Gatan US1000 high-resolution digital camera and Digital Micrograph software (v1.82.366).
Immunoblotting
Brian tissues were homogenized using radioimmunoprecipitation assay buffer (RIPA buffer; 50 mM Tris HCl, pH7.0, with protease inhibitors (Roche, 4693132001) and phosphatase inhibitor complete cocktail 2 and 3 (Sigma, P5726-1ML and P0044-1ML). Proteins (20–30 micrograms) were resolved on 4–12% Bis-Tris precast gel (Invitrogen, NP0343BOX) and immune-detected for LAMP1 (Santa Cruz Biotechnology, sc-19992; 1:500), GFAP (abcam, ab7260; 1:1000), ATG7 (Cell Signaling Technology, 2631; 1:500), ACTB (Santa Cruz Biotechnology, sc-47778; 1:1000), GAPDH (Cell Biolabs, ARK-001; 1:2000) and LC3B (Novus Biologicals, NB100-2220; 1:1000).
Virus generation and infection
Lentiviral vectors (shRNA-ATG7; Sigma, TRCN0000375421) and shRNA-TFEB [51] and their respective packaging vectors (psPAX2 and pMD2G; Addgene, 12260 and 12259) were cotransfected into HEK293T cells in a 4:3:1 molar ratio, respectively. The medium was changed 16 h following transfection to low-volume medium (5 mL for a 10-cm dish). The medium was collected again at 48 h following transfection, replaced with fresh medium (5 mL) and collected again at 72 h. Viral supernatant was cleared from cell debris via centrifugation (10 min at 1789 xg) as well as filtration through a 0.45-µM polyethersulfone membrane (VWR, 28144–007). Viruses were added to the receiving cells in complete medium with polybrene (Santa Cruz Biotechnology, sc-134220; 8 ug/mL) and incubated at 37ºC for 48 h. Cells were selected for more than a week in puromycine-containing medium (ThermoFisher Scientific, A1113802; 400 µg/mL).
Measurement of trehalose
Mice were anesthetized with isoflurane and perfused with PBS. Brains were extracted, snap-frozen in liquid nitrogen, and stored at −80ºC. For sample homogenization, frozen brains were pulverized with a mortar in liquid nitrogen and mixed. An aliquot was collected in a glass homogenizer (potter) and 1 ml of acetonitrile, methanol and water (2:2:1) kept at −20ºC was added. The samples were thawed in ice, and homogenized. The obtained solution were collected in 1.5-ml microcentrifuge tubes and centrifuged at 10,000 g for 10 min at 4ºC. The pallets were dissolved in RIPA buffer and protein concentration was determined by BCA protein assay kit (ThermoFisher Scientific, 23225). Supernatants were collected in 15-ml falcon tubes and lyophilized using a freeze dryer lyophilizer. Samples were finally reconstituted in 250 µl water:methanol (1:1) solution and placed in the LC autosampler set at 6ºC for LC-MS analysis.
LC-MS analyses were performed on an Ekspert nanoLC400 (Eksigent, 5033460C; Singapore) coupled with a Triple TOF 6600 (AB Sciex; Singapore). Chromatography was performed using HALO C18, 2.7 µm, 90 A, 0.5 x 50 mm with a pre-column Zorbax 300SB-C18, 5 µm, 5 × 0.3mm (Agilent Technologies, 5065–9913). Isocratic flow at 12 µl/min was performed using a mobile phase composed of acetonitrile:methanol:water (45:45:10) with 5 mM ammonium acetate and 0.1% formic acid. Injection volume was 10 µl (full loop injection mode).
Acquisition in MS was performed in positive with the following parameters: mass over charge (m/z) range 300–400, T source 200C, Ion Spray Voltage 5500, Declustering Potential (DP) 80. Extracted ion chromatograms were generated with a tolerance of 10 parts per million at 343.12 m/z (trehalose plus a proton) and 360.15 m/z (trehalose plus NH4+). The latest was used for quantification due to higher ionization efficiency.
Statistics
Results are shown as mean ± standard error. Student’s t test was used for comparison of two groups and one-way analysis of variance (ANOVA) was used for multiple comparisons. Log-rank test was performed at the following website: S. A. Joosse, “Log-rank test” 2016, http://in-silico.net/tools/statistics/survivor. A P value ≤ 0.05 was considered statistically significant.
Funding Statement
This work was supported by NIH grant NS079618 (to M.S.) and grants from the Team Sanfilippo Foundation and Swiss Sanfilippo Foundation (to M.S.). P.L. was also supported by the Brain Disorders and Development Training grant (T32NS043124-13). This project was supported in part by the Hamill Foundation and by IDDRC grant number 1U54 HD083092 from the Eunice Kennedy Shriver National Institute of Child Health & Human Development (Cores: Mouse Neurobehavior, Integrated Microscopy and RNA in situ hybridization core) a Shared Instrumentation grant from the NIH (1S10 OD016167). This project was also was supported in part by Hong Kong Polytechnic University grants G-YBQT and 1-ZE6H.
Acknowledgments
We thank T. Eissa, C. Schaaf, M. Wangler, H. Jafar-Nejad, H. Nelvagal and V. Brandt for critical reading of the manuscript. We thank Debra Townley, Zhuo Yang, Cecilia Ljungberg and the members of the PSDL for technical assistance. We also thank Dr. Brugarolas for sharing the mouse shRNA-TFEB and Drs. Al-Ubaidi and Jin for providing us with 661W cells.
Disclosure statement
No potential conflict of interest was reported by the authors.
Supplementary material
Supplemental data for this article can be accessed here.
References
- [1].Lorincz AE. The mucopolysaccharidoses: advances in understanding and treatment. Pediatr Ann. 1978. February;7(2):104–122. PubMed PMID: 415287. [PubMed] [Google Scholar]
- [2].Heron B, Mikaeloff Y, Froissart R, et al. Incidence and natural history of mucopolysaccharidosis type III in France and comparison with United Kingdom and Greece. Am J Med Genet Part A. 2011. January;155a(1):58–68. PubMed PMID: 21204211. [DOI] [PubMed] [Google Scholar]
- [3].Mumford RA, Mahon LV, Jones S, et al. Actigraphic investigation of circadian rhythm functioning and activity levels in children with mucopolysaccharidosis type III (Sanfilippo syndrome). J Neurodev Disord. 2015;7(1):31 PubMed PMID: 26388955; PubMed Central PMCID: PMCPMC4574189. [DOI] [PMC free article] [PubMed] [Google Scholar]
- [4].Meyer A, Kossow K, Gal A, et al. Scoring evaluation of the natural course of mucopolysaccharidosis type IIIA (Sanfilippo syndrome type A). Pediatrics. 2007. November;120(5):e1255–61. PubMed PMID: 17938166. [DOI] [PubMed] [Google Scholar]
- [5].Ashworth JL, Biswas S, Wraith E, et al. Mucopolysaccharidoses and the eye. Surv Ophthalmol. 2006. Jan-Feb;51(1):1–17. PubMed PMID: 16414358. [DOI] [PubMed] [Google Scholar]
- [6].Husain AM, Escolar ML, Kurtzberg J.. Neurophysiologic assessment of mucopolysaccharidosis III. Clin Neurophysiol. 2006. September;117(9):2059–2063. PubMed PMID: 16884953. [DOI] [PubMed] [Google Scholar]
- [7].Tamagawa K, Morimatsu Y, Fujisawa K, et al. Neuropathological study and chemico-pathological correlation in sibling cases of Sanfilippo syndrome type B. Brain Dev. 1985;7(6):599–609. PubMed PMID: 3938624. [DOI] [PubMed] [Google Scholar]
- [8].Rafi MA, Zhi Rao H, Passini MA, et al. AAV-mediated expression of galactocerebrosidase in brain results in attenuated symptoms and extended life span in murine models of globoid cell leukodystrophy. Mol Ther. 2005. May;11(5):734–744. PubMed PMID: 15851012. [DOI] [PubMed] [Google Scholar]
- [9].Fraldi A, Hemsley K, Crawley A, et al. Functional correction of CNS lesions in an MPS-IIIA mouse model by intracerebral AAV-mediated delivery of sulfamidase and SUMF1 genes. Hum Mol Genet. 2007. November 15;16(22):2693–2702. PubMed PMID: 17725987. [DOI] [PubMed] [Google Scholar]
- [10].Cearley CN, Wolfe JH. A single injection of an adeno-associated virus vector into nuclei with divergent connections results in widespread vector distribution in the brain and global correction of a neurogenetic disease. J Neurosci. 2007. September 12;27(37):9928–9940. PubMed PMID: 17855607. . [DOI] [PMC free article] [PubMed] [Google Scholar]
- [11].Passini MA, Bu J, Fidler JA, et al. Combination brain and systemic injections of AAV provide maximal functional and survival benefits in the Niemann-Pick mouse. Proc Natl Acad Sci U S A. 2007. May 29;104(22):9505–9510. PubMed PMID: 17517638; PubMed Central PMCID: PMCPMC1874225. [DOI] [PMC free article] [PubMed] [Google Scholar]
- [12].Gilkes JA, Heldermon CD. Mucopolysaccharidosis III (Sanfilippo Syndrome)- disease presentation and experimental therapies. Pediatr Endocrinol Rev. 2014. September;12(Suppl 1):133–140. PubMed PMID: 25345095. [PubMed] [Google Scholar]
- [13].Kan SH, Aoyagi-Scharber M, Le SQ, et al. Delivery of an enzyme-IGFII fusion protein to the mouse brain is therapeutic for mucopolysaccharidosis type IIIB. Proc Natl Acad Sci U S A. 2014. October 14;111(41):14870–14875. PubMed PMID: 25267636; PubMed Central PMCID: PMCPmc4205671. [DOI] [PMC free article] [PubMed] [Google Scholar]
- [14].Hemsley KM, Hopwood JJ. Delivery of recombinant proteins via the cerebrospinal fluid as a therapy option for neurodegenerative lysosomal storage diseases. Int J Clin Pharmacol Ther. 2009;47(Suppl 1):S118–23. PubMed PMID: 20040322. [DOI] [PubMed] [Google Scholar]
- [15].Prasad VK, Kurtzberg J. Emerging trends in transplantation of inherited metabolic diseases. Bone Marrow Transplant. 2008. January;41(2):99–108. PubMed PMID: 18176609. [DOI] [PubMed] [Google Scholar]
- [16].Di Domenico C, Villani GR, Di Napoli D, et al. Intracranial gene delivery of LV-NAGLU vector corrects neuropathology in murine MPS IIIB. Am J Med Genet Part A. 2009. June;149a(6):1209–1218. PubMed PMID: 19449420. [DOI] [PubMed] [Google Scholar]
- [17].Sardiello M, Palmieri M, di Ronza A, et al. A gene network regulating lysosomal biogenesis and function. Science (New York, NY). 2009. July 24;325(5939):473–477. PubMed PMID: 19556463. [DOI] [PubMed] [Google Scholar]
- [18].Settembre C, Di Malta C, Polito VA, et al. TFEB links autophagy to lysosomal biogenesis. Science (New York, NY). 2011. June 17;332(6036):1429–1433. PubMed PMID: 21617040; PubMed Central PMCID: PMCPmc3638014. [DOI] [PMC free article] [PubMed] [Google Scholar]
- [19].Medina DL, Fraldi A, Bouche V, et al. Transcriptional activation of lysosomal exocytosis promotes cellular clearance. Dev Cell. 2011. September 13;21(3):421–430. PubMed PMID: 21889421; PubMed Central PMCID: PMCPmc3173716. [DOI] [PMC free article] [PubMed] [Google Scholar]
- [20].Song W, Wang F, Savini M, et al. TFEB regulates lysosomal proteostasis. Hum Mol Genet. 2013. May 15;22(10):1994–2009. PubMed PMID: 23393155. [DOI] [PubMed] [Google Scholar]
- [21].Tsunemi T, Ashe TD, Morrison BE, et al. PGC-1alpha rescues Huntington’s disease proteotoxicity by preventing oxidative stress and promoting TFEB function. Sci Transl Med. 2012. July 11;4(142):142ra97 PubMed PMID: 22786682; PubMed Central PMCID: PMCPmc4096245. [DOI] [PMC free article] [PubMed] [Google Scholar]
- [22].Decressac M, Mattsson B, Weikop P, et al. TFEB-mediated autophagy rescues midbrain dopamine neurons from alpha-synuclein toxicity. Proc Natl Acad Sci U S A. 2013. May 7;110(19):E1817–26. PubMed PMID: 23610405; PubMed Central PMCID: PMCPmc3651458. [DOI] [PMC free article] [PubMed] [Google Scholar]
- [23].Decressac M, Björklund A. TFEB: pathogenic role and therapeutic target in Parkinson disease. Autophagy. 2013. August;9(8):1244–1246. PubMed PMID: 23715007; PubMed Central PMCID: PMCPmc3748195. [DOI] [PMC free article] [PubMed] [Google Scholar]
- [24].Xiao Q, Yan P, Ma X, et al. Neuronal-targeted TFEB accelerates lysosomal degradation of APP, reducing abeta generation and amyloid plaque pathogenesis. J Neurosci. 2015. September 2;35(35):12137–12151. PubMed PMID: 26338325; PubMed Central PMCID: PMCPmc4556784. [DOI] [PMC free article] [PubMed] [Google Scholar]
- [25].Polito VA, Li H, Martini-Stoica H, et al. Selective clearance of aberrant tau proteins and rescue of neurotoxicity by transcription factor EB. EMBO Mol Med. 2014. September;6(9):1142–1160. PubMed PMID: 25069841; PubMed Central PMCID: PMCPmc4197862. [DOI] [PMC free article] [PubMed] [Google Scholar]
- [26].Bouche V, Espinosa AP, Leone L, et al. Drosophila Mitf regulates the V-ATPase and the lysosomal-autophagic pathway. Autophagy. 2016. March 3;12(3):484–498. PubMed PMID: 26761346; PubMed Central PMCID: PMCPMC4835958. [DOI] [PMC free article] [PubMed] [Google Scholar]
- [27].Sardiello M. Transcription factor EB: from master coordinator of lysosomal pathways to candidate therapeutic target in degenerative storage diseases. Ann N Y Acad Sci. 2016. May;1371(1):3–14. PubMed PMID: 27299292. [DOI] [PMC free article] [PubMed] [Google Scholar]
- [28].Lieberman AP, Puertollano R, Raben N, et al. Autophagy in lysosomal storage disorders. Autophagy. 2012. May 1;8(5):719–730. PubMed PMID: 22647656; PubMed Central PMCID: PMCPMC3378416. [DOI] [PMC free article] [PubMed] [Google Scholar]
- [29].Settembre C, Fraldi A, Rubinsztein DC, et al. Lysosomal storage diseases as disorders of autophagy. Autophagy. 2008. January;4(1):113–114. PubMed PMID: 18000397. [DOI] [PubMed] [Google Scholar]
- [30].Castillo K, Nassif M, Valenzuela V, et al. Trehalose delays the progression of amyotrophic lateral sclerosis by enhancing autophagy in motoneurons. Autophagy. 2013. September;9(9):1308–1320. PubMed PMID: 23851366. [DOI] [PubMed] [Google Scholar]
- [31].Ejlerskov P, Rasmussen I, Nielsen TT, et al. Tubulin polymerization-promoting protein (TPPP/p25alpha) promotes unconventional secretion of alpha-synuclein through exophagy by impairing autophagosome-lysosome fusion. J Biol Chem. 2013. June 14;288(24):17313–17335. PubMed PMID: 23629650; PubMed Central PMCID: PMCPmc3682534. [DOI] [PMC free article] [PubMed] [Google Scholar]
- [32].Ghavami S, Shojaei S, Yeganeh B, et al. Autophagy and apoptosis dysfunction in neurodegenerative disorders. Prog Neurobiol. 2014. January;112:24–49. PubMed PMID: 24211851. [DOI] [PubMed] [Google Scholar]
- [33].Gomes C, Escrevente C, Costa J. Mutant superoxide dismutase 1 overexpression in NSC-34 cells: effect of trehalose on aggregation, TDP-43 localization and levels of co-expressed glycoproteins. Neurosci Lett. 2010. May 21;475(3):145–149. PubMed PMID: 20363292. . [DOI] [PubMed] [Google Scholar]
- [34].Li Y, Guo Y, Wang X, et al. Trehalose decreases mutant SOD1 expression and alleviates motor deficiency in early but not end-stage amyotrophic lateral sclerosis in a SOD1-G93A mouse model. Neuroscience. 2015. July 9;298:12–25. PubMed PMID: 25841320. [DOI] [PubMed] [Google Scholar]
- [35].Lin F, Qin ZH. Degradation of misfolded proteins by autophagy: is it a strategy for Huntington’s disease treatment? J Huntington’s Dis. 2013;2(2):149–157. PubMed PMID: 25063512. [DOI] [PubMed] [Google Scholar]
- [36].Sarkar S, Rubinsztein DC. Huntington’s disease: degradation of mutant huntingtin by autophagy. FEBS J. 2008. September;275(17):4263–4270. PubMed PMID: 18637946. [DOI] [PubMed] [Google Scholar]
- [37].Zhang X, Chen S, Song L, et al. MTOR-independent, autophagic enhancer trehalose prolongs motor neuron survival and ameliorates the autophagic flux defect in a mouse model of amyotrophic lateral sclerosis. Autophagy. 2014. April;10(4):588–602. PubMed PMID: 24441414; PubMed Central PMCID: PMCPmc4091147. [DOI] [PMC free article] [PubMed] [Google Scholar]
- [38].Beranger F, Crozet C, Goldsborough A, et al. Trehalose impairs aggregation of PrPSc molecules and protects prion-infected cells against oxidative damage. Biochem Biophys Res Commun. 2008. September 12;374(1):44–48. PubMed PMID: 18602368. [DOI] [PubMed] [Google Scholar]
- [39].Aguib Y, Heiseke A, Gilch S, et al. Autophagy induction by trehalose counteracts cellular prion infection. Autophagy. 2009. April;5(3):361–369. PubMed PMID: 19182537. [DOI] [PubMed] [Google Scholar]
- [40].Schaeffer V, Goedert M. Stimulation of autophagy is neuroprotective in a mouse model of human tauopathy. Autophagy. 2012. November;8(11):1686–1687. PubMed PMID: 22874558; PubMed Central PMCID: PMCPMC3494601. [DOI] [PMC free article] [PubMed] [Google Scholar]
- [41].Tanaka M, Machida Y, Niu S, et al. Trehalose alleviates polyglutamine-mediated pathology in a mouse model of Huntington disease. Nat Med. 2004. February;10(2):148–154. PubMed PMID: 14730359. [DOI] [PubMed] [Google Scholar]
- [42].Sarkar S, Chigurupati S, Raymick J, et al. Neuroprotective effect of the chemical chaperone, trehalose in a chronic MPTP-induced Parkinson’s disease mouse model. Neurotoxicology. 2014. September;44:250–262. PubMed PMID: 25064079. [DOI] [PubMed] [Google Scholar]
- [43].Heldermon CD, Hennig AK, Ohlemiller KK, et al. Development of sensory, motor and behavioral deficits in the murine model of Sanfilippo syndrome type B. PLoS One. 2007;2(8):e772 PubMed PMID: 17712420; PubMed Central PMCID: PMCPmc1945015. [DOI] [PMC free article] [PubMed] [Google Scholar]
- [44].Tse DY, Lotfi P, Simons DL, et al. Electrophysiological and histological characterization of rod-cone retinal degeneration and microglia activation in a mouse model of mucopolysaccharidosis type IIIB. Sci Rep. 2015;5:17143 PubMed PMID: 26607664; PubMed Central PMCID: PMCPmc4660851. [DOI] [PMC free article] [PubMed] [Google Scholar]
- [45].Cideciyan AV, Jacobson SG. An alternative phototransduction model for human rod and cone ERG a-waves: normal parameters and variation with age. Vision Res. 1996. August;36(16):2609–2621. PubMed PMID: 8917821. [DOI] [PubMed] [Google Scholar]
- [46].Simons DL, Boye SL, Hauswirth WW, et al. Gene therapy prevents photoreceptor death and preserves retinal function in a Bardet-Biedl syndrome mouse model. Proc Natl Acad Sci U S A. 2011. April 12;108(15):6276–6281. PubMed PMID: 21444805; PubMed Central PMCID: PMC3076852. [DOI] [PMC free article] [PubMed] [Google Scholar]
- [47].Caruso RC, Kaiser-Kupfer MI, Muenzer J, et al. Electroretinographic findings in the mucopolysaccharidoses. Ophthalmology. 1986. December;93(12):1612–1616. PubMed PMID: 3101020. [DOI] [PubMed] [Google Scholar]
- [48].Ohmi K, Greenberg DS, Rajavel KS, et al. Activated microglia in cortex of mouse models of mucopolysaccharidoses I and IIIB. Proc Natl Acad Sci U S A. 2003. February 18;100(4):1902–1907. PubMed PMID: 12576554; PubMed Central PMCID: PMCPmc149931. [DOI] [PMC free article] [PubMed] [Google Scholar]
- [49].Palmieri M, Impey S, Kang H, et al. Characterization of the CLEAR network reveals an integrated control of cellular clearance pathways. Hum Mol Genet. 2011. October 1;20(19):3852–3866. PubMed PMID: 21752829. [DOI] [PubMed] [Google Scholar]
- [50].Ohmi K, Zhao H-Z, Neufeld EF. Defects in the medial entorhinal cortex and dentate gyrus in the mouse model of Sanfilippo syndrome type B. PLoS One. 2011;6(11):e27461 PubMed PMID: 22096577; PubMed Central PMCID: PMCPMC3212581. [DOI] [PMC free article] [PubMed] [Google Scholar]
- [51].Peña-Llopis S, Vega-Rubin-de-Celis S, Schwartz JC, et al. Regulation of TFEB and V-ATPases by mTORC1. EMBO J. 2011. July 29;30(16):3242–3258. PubMed PMID: 21804531; PubMed Central PMCID: PMCPMC3160667. [DOI] [PMC free article] [PubMed] [Google Scholar]
- [52].Malinowska M, Wilkinson FL, Bennett W, et al. Genistein reduces lysosomal storage in peripheral tissues of mucopolysaccharide IIIB mice. Mol Genet Metab. 2009. November;98(3):235–242. PubMed PMID: 19632871. [DOI] [PubMed] [Google Scholar]
- [53].Xie Y, Zhou B, Lin M-Y, et al. Progressive endolysosomal deficits impair autophagic clearance beginning at early asymptomatic stages in fALS mice. Autophagy. 2015. October 3;11(10):1934–1936. PubMed PMID: 26290961. [DOI] [PMC free article] [PubMed] [Google Scholar]
- [54].Gontier G, George C, Chaker Z, et al. Blocking IGF signaling in adult neurons alleviates Alzheimer’s disease pathology through amyloid-beta clearance. J Neurosci. 2015. August 19;35(33):11500–11513. PubMed PMID: 26290229. [DOI] [PMC free article] [PubMed] [Google Scholar]
- [55].Komatsu M, Waguri S, Chiba T, et al. Loss of autophagy in the central nervous system causes neurodegeneration in mice. Nature. 2006. June 15;441(7095):880–884. PubMed PMID: 16625205. [DOI] [PubMed] [Google Scholar]
- [56].Rubinsztein DC, DiFiglia M, Heintz N, et al. Autophagy and its possible roles in nervous system diseases, damage and repair. Autophagy. 2005. April;1(1):11–22. PubMed PMID: 16874045. [DOI] [PubMed] [Google Scholar]
- [57].Ahmed I, Liang Y, Schools S, et al. Development and characterization of a new Parkinson’s disease model resulting from impaired autophagy. J Neurosci. 2012. November 14;32(46):16503–16509. PubMed PMID: 23152632; PubMed Central PMCID: PMCPmc3508432. [DOI] [PMC free article] [PubMed] [Google Scholar]
- [58].Seki T, Abe-Seki N, Kikawada T, et al. Effect of trehalose on the properties of mutant {gamma}PKC, which causes spinocerebellar ataxia type 14, in neuronal cell lines and cultured Purkinje cells. J Biol Chem. 2010. October 22;285(43):33252–33264. PubMed PMID: 20705605; PubMed Central PMCID: PMCPmc2963337. [DOI] [PMC free article] [PubMed] [Google Scholar]
- [59].Schneider JL, Cuervo AM. Chaperone-mediated autophagy: dedicated saviour and unfortunate victim in the neurodegeneration arena. Biochem Soc Trans. 2013. December;41(6):1483–1488. PubMed PMID: 24256241; PubMed Central PMCID: PMCPmc4000258. [DOI] [PMC free article] [PubMed] [Google Scholar]
- [60].Cuervo AM, Wong ES, Martinez-Vicente M. Protein degradation, aggregation, and misfolding. Move Disord. 2010;25 Suppl 1:S49–54. PubMed PMID: 20187257. [DOI] [PubMed] [Google Scholar]
- [61].Fernandez-Estevez MA, Casarejos MJ, Lopez Sendon J, et al. Trehalose reverses cell malfunction in fibroblasts from normal and Huntington’s disease patients caused by proteosome inhibition. PLoS One. 2014;9(2):e90202 PubMed PMID: 24587280; PubMed Central PMCID: PMCPmc3934989. [DOI] [PMC free article] [PubMed] [Google Scholar]
- [62].Mayer AL, Higgins CB, Heitmeier MR, et al. SLC2A8 (GLUT8) is a mammalian trehalose transporter required for trehalose-induced autophagy. Sci Rep. 2016. December 6;6:38586. [DOI] [PMC free article] [PubMed] [Google Scholar]
- [63].DeBosch BJ, Heitmeier MR, Mayer AL, et al. Trehalose inhibits solute carrier 2A (SLC2A) proteins to induce autophagy and prevent hepatic steatosis. Sci Signal. 2016. February 23;9(416):ra21 PubMed PMID: 26905426; PubMed Central PMCID: PMCPMC4816640. . [DOI] [PMC free article] [PubMed] [Google Scholar]
- [64].Palmieri M, Pal R, Nelvagal HR, et al. mTORC1-independent TFEB activation via Akt inhibition promotes cellular clearance in neurodegenerative storage diseases. Nat Commun. 2017. February 6;8:14338. [DOI] [PMC free article] [PubMed] [Google Scholar]
- [65].Xiao Q, Yan P, Ma X, et al. Enhancing astrocytic lysosome biogenesis facilitates Abeta clearance and attenuates amyloid plaque pathogenesis. J Neurosci. 2014. July 16;34(29):9607–9620. PubMed PMID: 25031402; PubMed Central PMCID: PMCPmc4099542. . [DOI] [PMC free article] [PubMed] [Google Scholar]
- [66].Richards AB, Krakowka S, Dexter LB, et al. Trehalose: a review of properties, history of use and human tolerance, and results of multiple safety studies. Food Chem Toxicol. 2002. July;40(7):871–898. PubMed PMID: 12065209. [DOI] [PubMed] [Google Scholar]
- [67].Ribera A, Haurigot V, Garcia M, et al. Biochemical, histological and functional correction of mucopolysaccharidosis type IIIB by intra-cerebrospinal fluid gene therapy. Hum Mol Genet. 2015. April 1;24(7):2078–2095. PubMed PMID: 25524704. [DOI] [PubMed] [Google Scholar]
- [68].Delgadillo V, O’Callaghan Mdel M, Gort L, et al. Natural history of Sanfilippo syndrome in Spain. Orphanet J Rare Dis. 2013;8:189 PubMed PMID: 24314109; PubMed Central PMCID: PMCPmc3879199. [DOI] [PMC free article] [PubMed] [Google Scholar]
- [69].Katz ML, Tecedor L, Chen Y, et al. AAV gene transfer delays disease onset in a TPP1-deficient canine model of the late infantile form of Batten disease. Sci Transl Med. 2015. November 11;7(313):313ra180 PubMed PMID: 26560358. [DOI] [PMC free article] [PubMed] [Google Scholar]
- [70].Sorrentino NC, D’Orsi L, Sambri I, et al. A highly secreted sulphamidase engineered to cross the blood-brain barrier corrects brain lesions of mice with mucopolysaccharidoses type IIIA. EMBO Mol Med. 2013. May;5(5):675–690. PubMed PMID: 23568409; PubMed Central PMCID: PMCPmc3662312. [DOI] [PMC free article] [PubMed] [Google Scholar]
- [71].Mirza M, Volz C, Karlstetter M, et al. Progressive retinal degeneration and glial activation in the CLN6 (nclf) mouse model of neuronal ceroid lipofuscinosis: a beneficial effect of DHA and curcumin supplementation. PloS One. 2013;8(10):e75963 PubMed PMID: 24124525; PubMed Central PMCID: PMCPmc3790850. [DOI] [PMC free article] [PubMed] [Google Scholar]
- [72].Food and Agriculture Organization/World Health Organization Expert Committee on Food Additives. Evaluation of certain food additives and contaminants. World Health Organ Tech Rep Ser. 2001;901:i-viii, x, 1–107 PubMed PMID: 11588830. [PubMed] [Google Scholar]
- [73].Traynor BJ, Bruijn L, Conwit R, et al. Neuroprotective agents for clinical trials in ALS: a systematic assessment. Neurology. 2006. July 11;67(1):20–27. PubMed PMID: 16832072. [DOI] [PubMed] [Google Scholar]
- [74].Prut L, Belzung C. The open field as a paradigm to measure the effects of drugs on anxiety-like behaviors: a review. Eur J Pharmacol. 2003. February 28;463(1–3):3–33. PubMed PMID: 12600700. [DOI] [PubMed] [Google Scholar]
- [75].Saszik SM, Robson JG, Frishman LJ. The scotopic threshold response of the dark-adapted electroretinogram of the mouse. J Physiol. 2002. September 15;543(Pt 3):899–916. PubMed PMID: 12231647; PubMed Central PMCID: PMC2290546. [DOI] [PMC free article] [PubMed] [Google Scholar]
- [76].Abd-El-Barr MM, Pennesi ME, Saszik SM, et al. Genetic dissection of rod and cone pathways in the dark-adapted mouse retina. J Neurophysiol. 2009. September;102(3):1945–1955. PubMed PMID: 19587322; PubMed Central PMCID: PMC2746771. [DOI] [PMC free article] [PubMed] [Google Scholar]
Associated Data
This section collects any data citations, data availability statements, or supplementary materials included in this article.