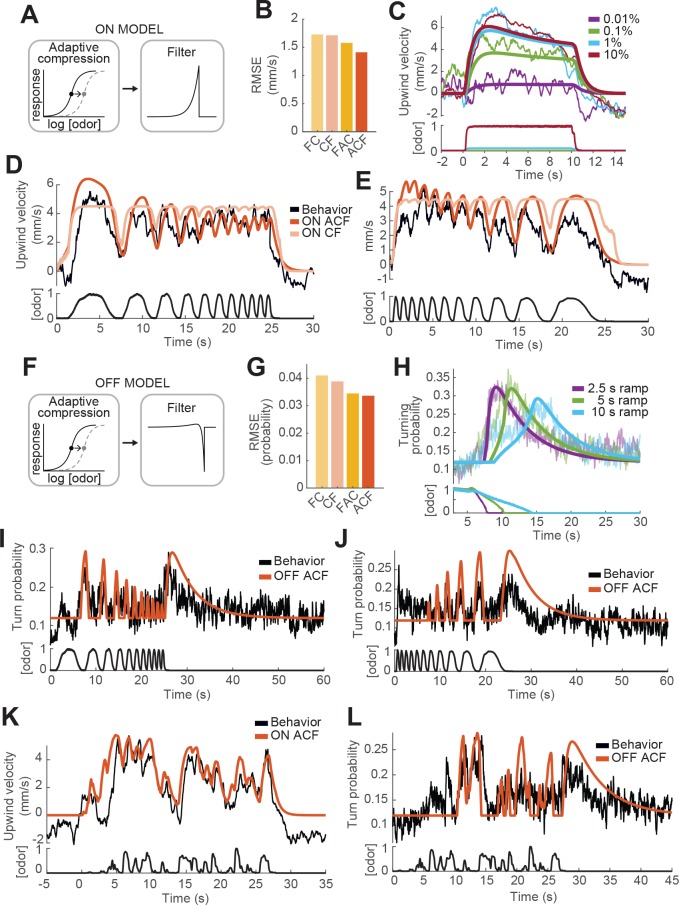
Figure 4. Computational modeling of ON and OFF response functions.
(A) ON model schematic featuring adaptive compression followed by linear filtering. (B) Root mean squared error between predictions of four ON models and behavioral data. FC: filter then compress; CF: compress then filter; FAC: filter then adaptive compression; ACF: adaptive compression then filtering. (C) Upwind velocity of real flies (top thiner traces; average; same data in Figure 3A) and predictions of the ACF ON model (top thicker traces) to square pulses of ACV at different concentrations. Bottom traces: stimuli, normalized to maximal amplitude. Note that adaptation appears only at higher concentrations and that responses saturate between 1% and 10% ACV. (D) Upwind velocity of real flies (top black trace; average; same data in Figure 3E), and predictions of ACF (red) and CF (pink) ON models to an ascending frequency sweep. Bottom trace: stimulus. Note that the model without adaptation (CF) exhibits saturation not seen in the data. (E) Same as D for a descending frequency sweep stimulus (same data in Figure 3G). (F) OFF model schematic featuring adaptive compression followed by differential filtering. (G) Root mean squared error between predictions of four OFF models and behavioral data. (H) Turn probability of real flies (top thiner traces; average; same data in Figure 3D) and predictions of the ACF OFF model (top thicker traces) to odor ramps of different durations. Bottom traces: stimuli. (I) Turn probability (top black trace; average; same data in Figure 3F), and predictions of ACF OFF model (top red trace) to an ascending frequency sweep. Bottom trace: stimulus. (J) Same as I for a descending frequency sweep stimulus (same data in Figure 3H). (K) Upwind velocity (top black trace; average; same data in Figure 3I), and predictions of ACF ON model to the ‘plume walk’ stimulus (see Results). Bottom trace: stimulus. RMSE = 1.355. (L) Same as K for the same stimulus, showing turning probability of real flies (top black trace; average; same data in Figure 3J) and predictions of the ACF OFF model (top red trace). Bottom trace: stimulus. RMSE = 0.038. Plume walk responses were not used to fit the models.

