Abstract
One of the major causes of eye blindness is identified to be as diabetic retinopathy, which if not detected in earlier stage would cause a serious issue. Long-term diabetes causes diabetic retinopathy. The significant key factor leading to diabetic retinopathy is exudates which affect the retina part and causes eye defects. Thus the first and foremost task in the automated detection of macular oedema is to detect the presence of these exudates. The authors use image processing techniques to detect the optic disc, exudates and the presence of macular oedema. Their method has the sensitivity 96.07%, selectivity 97.36%, and accuracy 96.62% for the exudates detection and in the case of macular oedema detection the sensitivity 97.75%, selectivity 100%, and accuracy 98.86% is achieved. The performance comparison with other methods reveals that their method can be used as a screening process for diabetic retinopathy. In addition to that, the algorithm can help to detect macular oedema.
Keywords: eye, vision defects, diseases, feature extraction, medical signal processing, biomedical optical imaging
Keywords: exudates, macular oedema, eye blindness, diabetic retinopathy, long-term diabetes, eye defects, image processing, optic disc detection, sensitivity, selectivity, accuracy
1. Introduction
The inadequate secretion of insulin or the improper utilisation of insulin by the body leads to the chronic disease diabetes. In the earlier stage of progression of this disease, it damages blood vessels present in the retina region, affecting them and in turn causes diabetic retinopathy, hindering the eyesight of the patient. Twenty years later, almost all type 1 patients and about 60% of type 2 patients will develop diabetic retinopathy [1]. Retinal analysis can be done by analysing the images of the retina called fundus images [2]. More than 50% of diabetic patients can be saved from blindness if the screening process is done to them at an earlier stage [3]. The manual analysis of those images will be time-consuming and only 40–60% of diabetic retinopathy patients can be examined by ophthalmologist yearly [4]. Therefore, automated digital image analysis techniques will be required for screening of diabetic affected population. This will reduce the burden of the ophthalmologist mostly in underdeveloped nations, where the ophthalmologist available will be less and screening cost is cut down.
The bulging of retinal capillaries results in microaneurysms (Mas), a tiny blood colour spot. The leakage of retinal blood vessels results in haemorrhages, and the deposit of fats or lipids into the retina give rise to exudates. The above are the pathologies present in the retina during the progression of the disease. Exudates are the fundamental reason for macular oedema and the initial process in the automated method to spot macular oedema is the identification of exudates.
2. Related work
More research work has been conducted to detect the presence of pathologies in diabetic retinopathy. Osareh et al. [5] investigated an automated method for identifying exudates in their studies; a multilayer neural network is used to classify exudates or no exudates with the selected feature vectors. Walter et al. [6] used morphological methods to spot the same. Sopharak et al. [7] discussed the same with an algorithm in which non-dilated images are the input. M. Shahin et al. [8] located some pathologies present in the retina and their area measurement is used for retinopathy classification. The vascular changes on the retina can be used for retinopathy screening [9]. The studies [10–12] also explained the detection of exudates with the retinal analysis.
The macula is present nearer to the optic disc. The macula is very dark in colour and contains fovea at its centre. The fovea is responsible for fine vision. The contrast of macula is very dull. The positional information with respect to other retinal structures is used to detect the macula [13]. Tariq et al. [14] described a system for detection of maculopathy and its stages using the classifier based on Gaussian mixture model (GMM). The classifier identified the exudates with the help of feature set and the various stages of maculopathy are classified with macula coordinates. Medhi et al. [15] explained the detection of maculopathy by determining the macula and fovea location using the red plane image. Deepak and Sivaswamy [16] examined the symmetry of the macular region and grade maculopathy using the technique rotational asymmetric motion pattern. Lim et al. [17] explained a technique using Marker-controlled watershed transform to grade maculopathy. Rahim et al. [18] and Vanathi et al. [19] analysed the same with different approaches. Various methods for detection of fovea, hard exudates, and maculopathy stages were reviewed by Kevin Noronha and Prabhakar Nayak [20]. Most of the techniques use training and classification stages that need more computing power. In the suggested method, mathematical morphology-based techniques are used for the detection of exudates and the marked macular circles are used for detection of macular oedema. The novelty of our method is it has less computation complexity and needs less computing power to find the exudates for the identification of diabetic maculopathy in fundus images.
3. Materials and methods
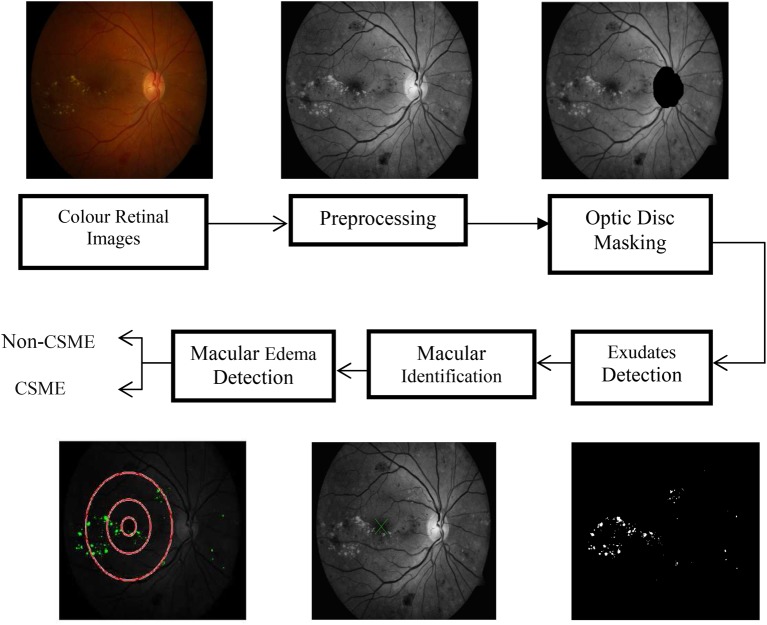
The DIARETDB1 database is used in this research. It consists of 89 colour fundus images obtained from Kuopio University Hospital. These images play an important role in detecting macular oedema since most images with exudates appear near the macula. The digital fundus camera is used to collect the images in 50° line of vision. The size of the image used is 1500 × 1152 pixels. All the 89 images of the database are used for the detection of exudates and the severity of macular oedema. Our suggested method is clearly displayed in Fig. 1. The colour image of the retina is the input to our algorithm. Pre-processing is the process of making those images suitable for processing to further stages. Then the detection and removal of the optic disc are focused since it is having the same intensity, colour, and contrast as of exudates. The segmentation of exudates and macular identification are finally investigated. The macula containing the exudates causes a condition called macular oedema, a vision attacking disease. The investigation of critically significant macular oedema (CSME) present or not is valuable information given to the ophthalmologist to treat macular oedema.
Fig. 1.
Step by step diagram of the suggested method
4. Pre-processing
The background pixels are removed to focus the foreground pixels. These pixels are enhanced in such a way that the unwanted pixels are eliminated from the required image for processing to go to the next stage. The image's green component helps to strengthen the detection of pathologies on the retina. The irrelevant pixels are removed by the median filter and the contrast is upgraded. The pre-processing steps are shown in Fig. 2.
Fig. 2.
Pre-processing steps
a Colour image of retina containing exudates
b Green channel conversion
c Contrast upgraded image
5. Removal of optic disc
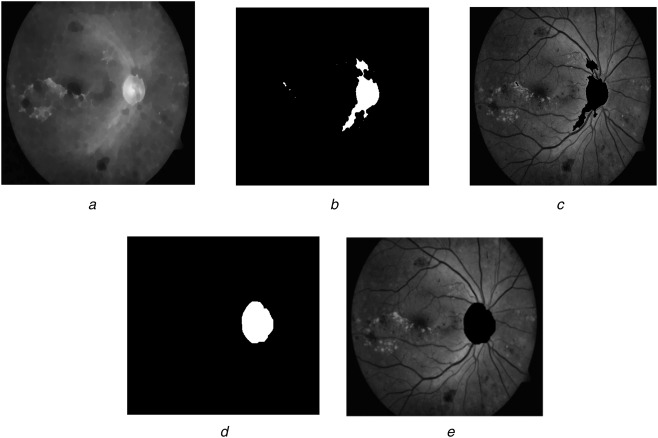
This is an important task to get the exudate pixels correctly. Its diameter plays an important role to localise the macula responsible for the central vision of the human. The morphological closing is performed on Ig in order to suppress the blood vessels as in Fig. 3a
| (1) |
where SE1 is the disc-shaped structuring element with 15 as radius, which is greater than the width of the vessels and φ as the closing operator. The thresholding followed by filling operation is applied to the image c1.The thresholding T is performed with varying threshold levels of 0.3, 0.4, or 0.5
| (2) |
Fig. 3.
Optic disc elimination
a Blood vessel removed image
b Two-folded image
c High intensities removed image
d Dilated optic disc
e Optic disc removed the image
This image is shown in Fig. 3b and set to 0 before overlaid on the original image Ig to remove high intensities and shown in the image (c3) as in Fig. 3c.Then a morphological reconstruction R is applied to c3 which results in c4
| (3) |
The reconstructed image is detected from the contrast upgraded image Ig to the threshold level of Otsu algorithm (automatic selection). The optic disc is found by detecting the biggest circular region among the high-intensity bright objects. The circularity check is found by the compactness C = 4πA/P2, where A is an area of the region and P is the perimeter. The largest circular object c5 is dilated to obtain all the pixels of the optic disc c6 shown in Fig. 3d
| (4) |
where δ is the dilated operator with SE2 being the structuring element object of the disc pattern and size varying with the image as in Fig. 3d. These pixels are set to zero in the original image as shown in Fig. 3e. Normally no exudates are present near to the optic disc. Out of the 89 images of the DIARETDB1 database, our algorithm detected 85 of them correctly and four images were not detected due to poor illumination.
6. Segmentation of exudates
The term exudates represent both hard and soft exudates. They are yellow or white in colour. Exudates appear in different sizes and shapes. The vascular structure is removed from the image c7 by performing closing operation given in the following equation:
| (5) |
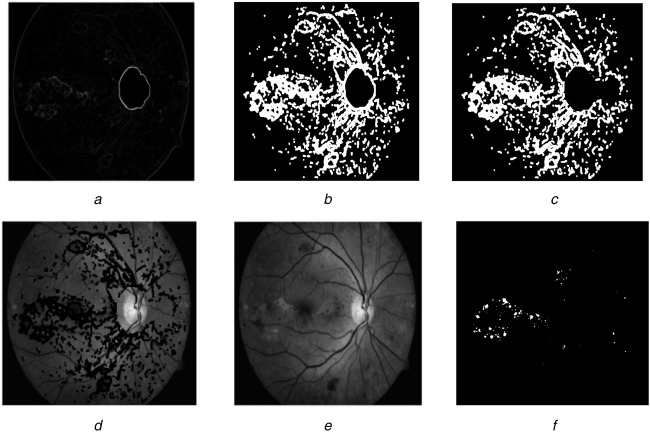
A columnwise neighbourhood operation using 7 × 7 neighbourhood is applied to get the standard deviation of the image c9 which results in the possible candidate regions. This is shown in Fig. 4a. Then a thresholding operation is applied with the threshold level 〈0.01 0.02 or 0.03〉 to remove low variation of the image. Later the thresholded pixels are dilated with the structuring element SE3 of shape disc with a size of 6 to include neighbourhood pixels as given in the following equation:
| (6) |
Fig. 4.
Exudate detection
a Standard deviation image
b Dilated thresholded image without border
c Optic disc removed imaged
d Zero set pixels superimposed on original image
e Reconstructed image
f Exudates segmented image
To determine the border of the exudates alone, dilated image's border is eliminated to obtain c11 (Fig. 4b). The optic disc region already found (c6) is dilated with a structuring element of radius 10 is removed from the image c11 (Fig. 4c). The resulting image pixels are set to zero and superimposed on the contrast-enhanced image Ig to form c12. Then c12 is applied to a morphological reconstruction with respect to the original image to obtain c13. This image deducted from Ig was thresholded at threshold value 〈0.04, 0.05, 0.06, 0.07 or 0.08〉 to give the exudates segmentation result (Fig. 4f)
| (7) |
The image obtained from (7) will be sent for validation. By varying the different values of the threshold used in our algorithm, the system's performance will not be significantly changed. Those values are selected to yield the highest values of the sensitivity and specificity. No exudates present in the images are considered as healthy or normal images.
7. Detection of macula
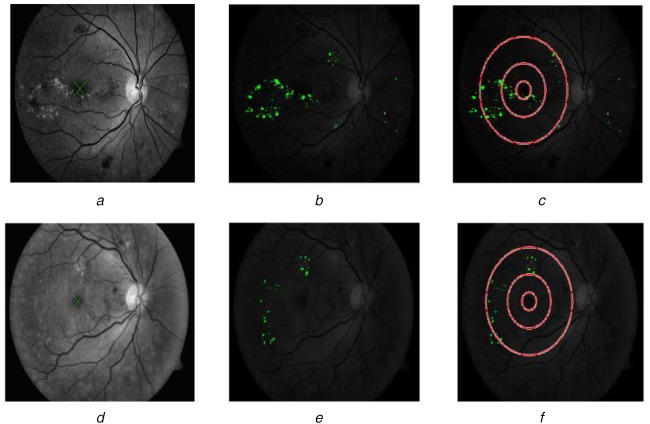
The positional information with respect to the optic disc is used to localise the macula. As stated before, the blood vessel removed image c1 is used to detect the macula. The macula is the darkest area and the distance from the middle of the optic disc is the near radius of the latter multiplied by five. Image c1 is binarised and the darkest pixels near the optic disc are clustered and the biggest formed cluster is considered as the macula. Macular circles with an optic disc diameter of one-third, one and two as radii are drawn on the exudates detected or indicated image. The exudates present on and inside of inner two macular circles indicate the presence of CSME (Fig. 5(c)), a severe condition which causes immediate blindness. On the other hand, the presence of exudates outside the inner two macular circles is the non-CSME condition (Fig. 5f). The presence/absence of CSME is a valuable information given to the ophthalmologist to treat macular oedema.
Fig. 5.
Macular oedema detection
a Macular detection
b Exudates segmentation result imposed on original image
c CSME image
d Macular detection
e Exudates segmentation result imposed on original image
f Non-CSME image
8. Results
The assessment of the automated computer-assisted method is a very important task. The evaluation and validity of the algorithm are tested using the DIARETDB1 database. The 51 images containing exudates, 49 of them are detected correctly in our method and the remaining two images were not detected. The 38 images containing no exudates, 37 images are detected correctly and remaining one is not detected. To evaluate the proposed method statistically, the performance is calculated as follows. True positive (tp) is the count indicating the exudate regions correctly detected, the non-exudate regions correctly detected are true negative (tn), false positive (fp) are the non-exudate regions detected as exudates, false negative (fn) are the exudate regions detected as non-exudates
The sensitivity (Se) of the suggested method is 96.07% specificity (Sp) is 97.36% and accuracy is 96.62% for the exudate detection.
9. Discussions
The results of our algorithm are correlated with other previous methods for exudate detection and are displayed in Table 1. The result reveals that the suggested method scored higher values than the studies [5–7, 12] in relation to the sensitivity [5, 11, 12] and specificity for exudate detection. The severity of the macular oedema is tested with the macular circles drawn near the macular region. The macula is detected in 87 images of 89 images present in the database and in two images it is not detected because of low contrast. The sensitivity of 97.75%, specificity of 100% and accuracy of 98.86% were observed in the case of macular oedema detection. Fig. 6 shows CSME and non-CSME images. The result of macular oedema detection correlated with other methods is displayed in Table 2. The British Diabetic Association (BDA) determines that the screening method for diabetic retinopathy should attain the sensitivity rate >80% and specificity rate >95%. The performance comparison is done with the research works which are nearer to the BDA values. Our method achieved the BDA figures.
Table 1.
Results of suggested algorithm correlated with other studies for exudate detection
Fig. 6.
Segmentation examples
a Pre-processed image
b Exudates segmentation result
c Another pre-processed image
d Exudates segmentation result
Table 2.
Results of suggested algorithm correlated with other studies for macular oedema detection
| Author | Techniques | Sensitivity, % | Specificity, % | Accuracy, % | Number of images | Dataset used |
|---|---|---|---|---|---|---|
| Tariq et al. [14] | filter bank and GMM | 97.2 | 98.32 | 97.89 | 1281 | STARE & MESSIDOR |
| Medhi et al. [15] | image processing | 98.05 | 98.86 | — | — | — |
| Deepak and Sivaswamy [16] | rotational asymmetric motion pattern | 95 | 90 | — | 400 | MESSIDOR |
| Lim et al. [17] | marker-controlled watershed transform |
80.9 | 90.2 | — | 88 | MESSIDOR |
| Rahim et al. [18] | fuzzy image processing | 86.8 | 100 | 93 | 600 | Novel |
| suggested method | image processing | 97.75 | 100 | 98.86 | 89 | DIARETDB1 |
10. Conclusion
The preventable high-risk macular oedema requires the detection and treatment in earlier times. A computer-assisted screening technique of automated type is presented for diabetic retinopathy and detection of macular oedema. The proposed method comprised of pre-processing, masking of the optic disc, exudates detection, and macular oedema detection. Morphological techniques are utilised in the process of optic disc and exudates detection. The macula is localised with the help of positional knowledge with respect to the optic disc. The darkest area near to it is clustered to identify the macular region. Macular circles are drawn in the exudates detected image to classify the CSME or non-CSME condition of maculopathy. The evaluation of the method is done using the DIARETDB1 database. The improved result of the suggested method correlated with other techniques is the complete elimination of all the optic disc pixels and the carefully chosen different parameters involved in the experiment. The proposed method can be used as a screening process for diabetic retinopathy and detection of macular oedema. Earlier detection and treatment of these diseases can prevent the blindness to the diabetic population. Furthermore, this will reduce the burden of ophthalmologist and cost of the screening process. The future work will include the detection of other pathologies of diabetic retinopathy Mas, haemorrhages and more efficient method for detection of macular oedema.
11. Acknowledgment
The authors would like to thank DIARETDB1 team for allowing them to use their database in this Letter.
12. Funding and declaration of interests
None declared.
13 References
- 1. Causes and risk factors of diabetic retinopathy. United States National Library of Medicine, 15 September 2009.
- 2.Wild S., Roglic G., Green A., et al. : ‘Global prevalence of diabetes: estimates for the year 2000 and projections for 2030’, Diabetes Care, 2004, 27, pp. 1047–1053 (doi: 10.2337/diacare.27.5.1047) [DOI] [PubMed] [Google Scholar]
- 3.Patton N., Aslam T.M., MacGillivray T., et al. : ‘Retinal image analysis: concepts, applications, and potential’, Retinal Eye Res., 2006, 25, pp. 99–127 (doi: 10.1016/j.preteyeres.2005.07.001) [DOI] [PubMed] [Google Scholar]
- 4.Ege B.M., Hejlesen O.K., Larsen O.V., et al. : ‘Screening for diabetic retinopathy using computer-based image analysis and statistical classification’, Comput. Methods Programs Biomed., 2000, 62, pp. 165–175 (doi: 10.1016/S0169-2607(00)00065-1) [DOI] [PubMed] [Google Scholar]
- 5.Osareh A., Shadgar B., Markham R.: ‘A computational intelligence based approach for detection of exudates in diabetic retinopathy images’, IEEE Trans. Inf. Technol. Biomed., 2009, 13, pp. 535–545 (doi: 10.1109/TITB.2008.2007493) [DOI] [PubMed] [Google Scholar]
- 6.Walter T., Klein J., Massin P., et al. : ‘A contribution to image processing to the diagnosis of diabetic retinopathy, detection of exudates in color fundus images of the human retina’, IEEE Trans. Med. Imaging, 2002, 21, (10), pp. 1236–1243 (doi: 10.1109/TMI.2002.806290) [DOI] [PubMed] [Google Scholar]
- 7.Sopharak A., Uyyanonvara B., Barman S., et al. : ‘Automatic detection of diabetic retinopathy exudates from non-dilated retinal images using mathematical morphology methods’, Comput. Med. Imaging Graph., 2008, 32, (8), pp. 720–727 (doi: 10.1016/j.compmedimag.2008.08.009) [DOI] [PubMed] [Google Scholar]
- 8.Shahin E.M., Taha E.T., AI-Nuaimy W., et al. : ‘Automated detection of diabetic retinopathy in blurred digital fundus images’. 8th Int. Computer Engineering Conf. (ICENCO), Cairo, Egypt, December 2012, ISBN: 978-1-4673-5566-7 [Google Scholar]
- 9.Narasimha-Iyer H., Roysam A.C.B., Tanenbaum H.L., et al. : ‘Integrated analysis of vascular and nonvascular changes from color retinal fundus image sequences’, IEEE Trans. Biomed. Eng., 2007, 54, (8), pp. 1436–1445 (doi: 10.1109/TBME.2007.900807) [DOI] [PubMed] [Google Scholar]
- 10.Sánchez C.I., Hornero R., López M.I., et al. : ‘A novel automatic image processing algorithm for detection of hard exudates based on retinal image analysis’, Med. Eng. Phys., 2008, 30, pp. 350–357 (doi: 10.1016/j.medengphy.2007.04.010) [DOI] [PubMed] [Google Scholar]
- 11.García M., Sánchez C.I., López M.I., et al. : ‘Neural network based detection of hard exudates in retinal images’, Comput. Methods Programs Biomed., 2009, 93, pp. 9–19 (doi: 10.1016/j.cmpb.2008.07.006) [DOI] [PubMed] [Google Scholar]
- 12.Zhang X., Thibault G., Decencière E., et al. : ‘Exudate detection in color retinal images for mass screening of diabetic retinopathy’, Med. Image Anal., 2014, 18, pp. 1026–1043 (doi: 10.1016/j.media.2014.05.004) [DOI] [PubMed] [Google Scholar]
- 13.Tobin K.W., Chaum E., Govindasamy V.P., et al. : ‘Detection of anatomic structures in human retinal imagery medical imaging’, IEEE Trans. Med. Imaging, 2007, 26, pp. 1729–1739 (doi: 10.1109/TMI.2007.902801) [DOI] [PubMed] [Google Scholar]
- 14.Tariq A., Akram M.U., Shaukat A., et al. : ‘Automated detection and grading of diabetic maculopathy in digital retinal images’, J. Digit. Imaging, 2013, 26, (4), pp. 803–812 (doi: 10.1007/s10278-012-9549-4) [DOI] [PMC free article] [PubMed] [Google Scholar]
- 15.Medhi J.P., Dhandapat S.: ‘An effective fovea detection and automatic assessment of diabetic maculopathy in color fundus images’, Comput. Biol. Med., 2016, 74, pp. 30–44 (doi: 10.1016/j.compbiomed.2016.04.007) [DOI] [PubMed] [Google Scholar]
- 16.Deepak K.S., Sivaswamy J.: ‘Automatic assessment of macular edema from color retinal images’, IEEE Trans. Med. Imaging, 2012, 31, (3), pp. 766–776 (doi: 10.1109/TMI.2011.2178856) [DOI] [PubMed] [Google Scholar]
- 17.Lim S.T., Zaki W.M.D.W., Hussain A., et al. : ‘Automatic classification of diabetic macular edema in digital fundus images’. 2011 IEEE Colloquium on Humanities, Science, and Engineering (CHUSER), Penang, Malaysia, December 2011, pp. 265–269 [Google Scholar]
- 18.Rahim S.S., Palade V., Shuttleworth J., et al. : ‘Automatic screening and classification of diabetic retinopathy and maculopathy using fuzzy image processing’, Brain Inf., 2016, 3, pp. 249–267 (doi: 10.1007/s40708-016-0045-3) [DOI] [PMC free article] [PubMed] [Google Scholar]
- 19.Sundaresan V., Ram K., Joshi N., et al. : ‘Computer-assisted grading of diabetic macular edema on retinal color fundus images’. 37th Annual Int. Conf. of the IEEE Engineering in Medicine and Biology Society (EMBC), Milan, Italy, 25–29 August 2015, pp. 4330–4333 [DOI] [PubMed] [Google Scholar]
- 20.Noronha K., Prabhakar Nayak K.: ‘Automated diagnosis of diabetes maculopathy: a survey’, J. Med. Imaging Health Inf., 2013, 3, pp. 1–8 (doi: 10.1166/jmihi.2013.1127) [Google Scholar]


