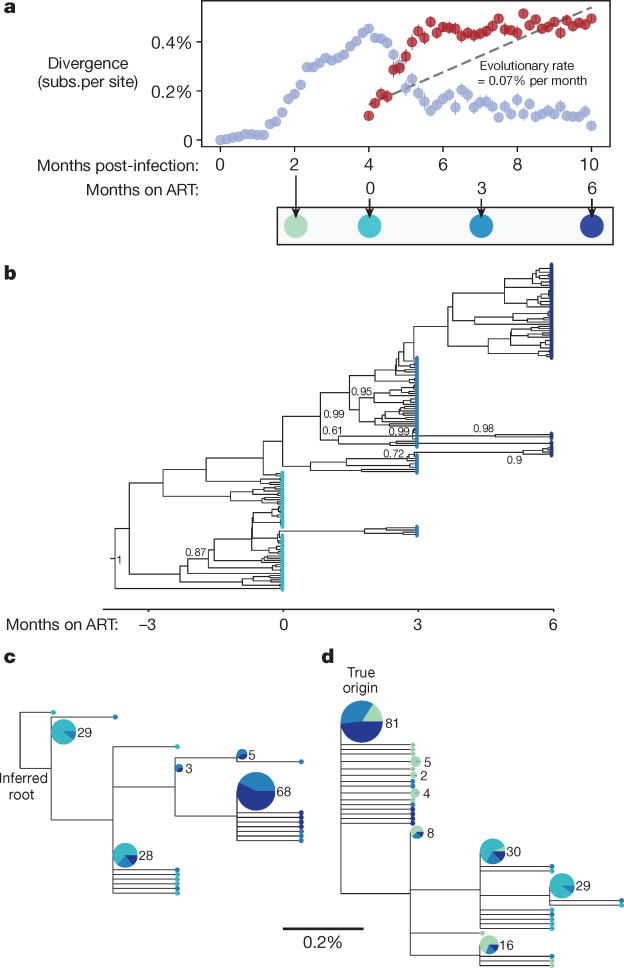
Figure 2. Simulated decay of labile infected cell population creates misleading appearance of viral replication and evolution in first six months of treatment.
A simulated sample of 50 sequences of length 587 base pairs (bp) is shown at each time point (see Methods); these values were chosen for consistency with the number and length of haplotypes presented in the phylogenetic analysis of ref. 7. a, Genetic divergence is measured, as in ref. 7, as the average fraction of sites differing from the most common genotype found at treatment initiation (red symbols). Although simulated treatment halts all viral replication, decay of labile infected cells over the first year of treatment causes the sampled viral population to diverge genetically from this common genotype. If divergence is instead measured from the infection origin (light blue symbols), the true pattern is unmasked: evolution proceeds before treatment, but then reverses during early treatment as an increasing number of ancestral reservoir sequences are sampled. Bars show s.e. b, A time-structured tree, constructed as in Fig. 1 of ref. 7 from sequences sampled at and after initiation of ART, creates the misleading appearance of clocklike evolution. Posterior clade probabilities >60% shown. c, A maximum-likelihood tree, constructed and rooted as in Extended Data Fig. 2 of ref. 7, recapitulates this pattern. A clock-like evolutionary signal is detected (0.07% substitutions per site per month, R2 = 0.54, P < 10−25). d, When sequences sampled before initiation of ART are also included in the maximum-likelihood tree and the root is placed at the true origin of infection, no clock-like signal is detected. Posterior clade probabilities >60% shown. In c and d, leaf sizes and labels indicate multiplicity of each genotype in the sample; leaves without numbers occur only once; and segments show the proportion sampled at each time, using the colour scheme below a.

