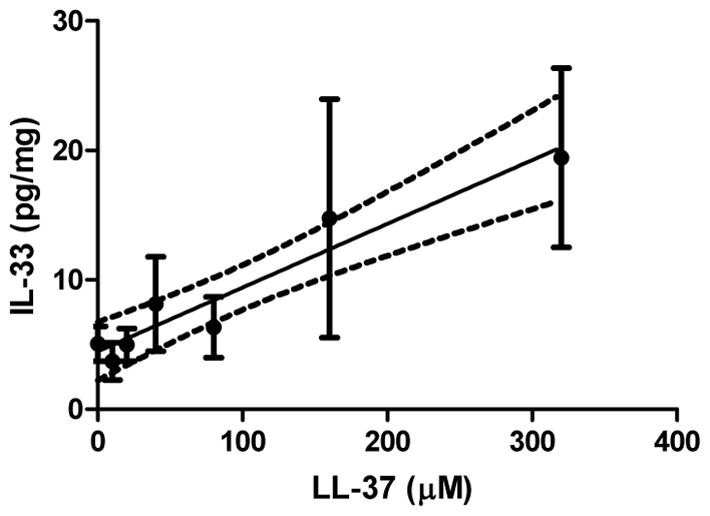
Figure 1. IL-33 expression rises linearly in response to increasing concentrations of LL-37 challenge.

The solid line represents the linear least squares regression of the IL-33 expression level against the concentration of LL-37 administered intravesically in wild type mice. Points represent the mean, while the error bars indicate the standard deviation. The dashed lines represent the 95% confidence interval of the linear regression.
