Abstract
The first step in chromatin-based epigenetic assays involves the fragmentation of chromatin to facilitate precise genomic localization of the associated DNA. Here, we report the development of a droplet microfluidic device that can rapidly and efficiently digest chromatin into single nucleosomes starting from whole-cell input material offering simplified and automated processing compared to conventional manual preparation. We demonstrate the digestion of chromatin from 2,500-125,000 Jurkat cells using micrococcal nuclease for enzymatic processing. We show that the yield of mononucleosomal DNA can be optimized by controlling enzyme concentration and incubation time, with resulting mononucleosome yields exceeding 80%. Bioinformatic analysis of sequenced mononucleosomal DNA (MNase-seq) indicated a high degree of reproducibility and concordance (97-99%) compared with conventionally processed preparations. Our results demonstrate the feasibility of robust and automated nucleosome preparation using a droplet microfluidic platform for nucleosome positioning and downstream epigenomic assays.
Introduction
In eukaryotic organisms, meters of genomic DNA must be compacted to fit into a micron-sized cell nucleus.1, 2 This is accomplished by the formation of nucleoprotein complexes—termed chromatin for their readily stainable nature—that permit high packing ratios. However, this arrangement must still allow for controlled access to the DNA for template-dependent functions such as gene transcription, DNA replication, and repair.3–6 Dynamic and highly regulated compaction and decompaction of DNA reflects changes in the density of nucleosomes, the fundamental repeating unit of chromatin. With ~147 base pairs (bp) of DNA coiling around an octamer of histones H2A, H2B, H3 and H4, loosely organized nucleosomes form a beads-on-a-string array structure connected by linker DNA.3–6 Nucleosomes usually occupy positions on DNA sequences that are correlated to specific functions.2, 3, 7 They are commonly depleted from active promoter, enhancer, or terminator regions, forming nucleosome-depleted regions (NDRs) or nucleosome-free regions (NFRs) that allow for easier access of transcriptional machineries to these genes8, 9; while in intragenic regions nucleosomes have a more random and continuous distribution that is proposed to assist in maintaining genome stability by occluding DNA-binding proteins.4, 10 Dynamic nucleosome repositioning occurs in response to cellular and environmental cues under the control of histone chaperones and chromatin remodeling complexes, which are regulated by a wide variety of mechanisms including, but not limited to, chromatin-binding factors and enzyme complexes, covalent modifications of DNA bases, histone and nonhistone proteins, as well as coding and noncoding RNA species.9 Of specific interest to our work, several recent demonstrations of microfluidic platforms have begun to show promise for low-input epigenomic applications.11–16
Given their foundational role in chromatin organization, specific assays for nucleosome positioning can provide the most direct correlate of gene expression since their position is the integrated result of the interplay of the entire collection of DNA- and histone-modifications, and other regulatory mechanisms. A common nucleosome mapping approach involves chromatin digestion using micrococcal nuclease (MNase) to yield mononucleosomal DNA followed by next-generation sequencing (MNase-seq)7, 17–19. MNase is a Ca2+-dependent endo-exonuclease that preferentially cleaves exposed linker DNA until it encounters a barrier such as a stably bound protein and/or a nucleosome where the histone core protects the packed DNA sequence from being digested.20, 21 Mono-, di-, and poly-nucleosomes are generated after chromatin digestion by MNase at appropriate concentrations for a certain period. Following next-generation sequencing of libraries directed to nucleosomal DNA from digested chromatin, mapping sequenced reads of (mono-) nucleosomal DNA to a reference genome localizes protein-binding regions and nucleosome positions at up to single base pair resolution.17 Furthermore, some form of controllable chromatin fragmentation is also critical for identifying NDRs/NFRs (e.g., by ATAC-seq22–24 and FAIRE-seq25–27) and for determining the precise genomic position of regulatory proteins, as well as histone- and DNA-modifications (e.g., by ChIP-seq28–30). However, macroscale nucleosome preparation, and more generally all chromatin digestion assays, have drawbacks—particularly in terms of throughput and ease of use, which can limit applicability in the analysis of challenging and often sample-limited clinical specimens. We therefore set out to design a microfluidic device to automate MNase-based chromatin processing in a way that was automated and compatible with variable cell input amounts.
Droplet microfluidics have emerged as a valuable approach for various biochemical assays, including single-cell analysis, diagnostics, DNA sequencing, and drug screening.31–34 The basic principle involves the segmentation of an aqueous sample with an inert, immiscible oil such that each of the resulting droplets functions as an independent microreactor.35, 36 The volume of the droplets typically range from femtoliters to nanoliters, leading to extremely small reagent consumption and amenability to rare samples, such as stem cells and circulating tumor cells.37–43 Recent developments in the field have demonstrated exquisite control over fluid addition and removal, as well as droplet coalescence.44–52 Additionally, rapid mixing within droplets allows more efficient chemical and biological reactions, and corresponding shorter operation times.35, 53–55
In this manuscript, we describe the development and optimization of a droplet microfluidic device that efficiently digests chromatin to give a high yield of mononucleosomal DNA, which is the desired input material for ChIP- or MNase-seq applications. The automated device simultaneously lyses and digests whole cells to give product DNA that is indistinguishable from that obtained using benchtop processing. We also demonstrate the applicability of the approach to variable and very small cell inputs, with final validation achieved by genome-wide MNase-seq analysis that, again, shows identical performance to bulk-processed cells. The additional validation of both PCR-free and PCR-amplified sequencing library construction makes this device of high potential value as the first step of sample preparation for a number of current and emerging epigenetic assays.
Experimental
Microfluidic device fabrication
Microfluidic devices were generated using standard photolithography and soft lithography methods. Transparent photolithography masks were designed in AutoCAD (Fig. S1) and then printed by CAD/Art Services, Inc. (Bandon, OR). Negative photoresists SU8 2025 and 2050 (MicroChem Corp, Westborough, MA) were deposited onto silicon wafers (University Wafer, Boston MA) according to manufacturer recommendations. Briefly, SU8 2025 was first spin coated (PWM 32, Headway Research, Inc) onto the silicon wafer at 2000 rpm for 30 seconds to give a 40-μm thick layer. After soft baking, the resist layer was exposed to a UV lamp (Optical Associates, Incorporated) through the first-layer photomask. After post-exposure baking, the patterned wafer was developed in propylene glycol monomethyl ether acetate (PGMEA) (Sigma-Aldrich, St. Louis, MO) and dried under nitrogen. SU8 2050 was then spin coated onto the patterned wafer at 1150 rpm for 30 seconds to give a 160-μm thick layer. After soft baking, the resist was exposed to UV through the second-layer photomask and then developed as described above.
Microfluidic devices were fabricated by casting poly(dimethylsiloxane) (PDMS) over the two-layer SU8 master. The PDMS base and elastomer curing agent (Momentive RTV 615 kit, R.S. Hughes, Carol Stream, IL) were mixed at a mass ratio of 10:1 and degassed under vacuum before the mixture was poured over the master. After curing for at least one hour at 70°C, PDMS replicas were cut and peeled from the master. Tubing inserting holes were punched with blunt-tip biopsy needles (18 gauge for inlets, 20 gauge for the outlet and electrolyte inlets). After punching holes, the devices were then sonicated in water for 5 min and dried with nitrogen to remove any PDMS debris. In parallel, a base layer was created on a glass slide by spinning a degassed, 10:1 PDMS base:elastomer mixture onto a glass microscope slide. This base layer was partially cured for 8 min before the microfluidic replica was placed on top with gentle pressure, followed by a final 30 min bake to fully bond the microfluidic device.
Microfluidic device operation
Solutions were delivered to the chip through 24-gauge PTFE tubing (Cole-Parmer, Vernon Hills, IL) controlled by syringe pumps (Pump 11 Pico Plus Elite, Harvard Apparatus). The immiscible oil phase was the fluorinated oil Novec 7500 (3M, St. Paul, MN) with 2% (w/w) perfluoropolyether polyethylene glycol block co-polymer surfactant (RAN Biotechnologies, Inc. Beverly, MA). The tubing to deliver cells to the chip was treated with 1% (w/v) Pluronic F127 (Sigma-Aldrich, St. Louis, MO)-containing PBS solution overnight and prefilled with PBS buffer. Electrolyte channels on the microfluidic device were filled with a 3M sodium chloride solution. Two clamps from electrodes of an in-house built DC-AC converter (12V DC input, 0-360V AC at 36 kHz as output), which was connected to a power supply (DC regulated power supply, TENMA T2-6628), were connected to the syringe needles supplying the electrolyte channels to form a complete circuit for the AC electric field.
Prior to experiments, microfluidic devices were treated with Aquapel (Pittsburgh Glass Works, Pittsburgh, PA) as described previously56 to give a hydrophobic coating throughout sample processing. Optiprep (Sigma-Aldrich, St. Louis, MO) was added to PBS buffer to obtain a final density of 1.07 g/mL at a 21.9% (v/v) concentration. Cells were resuspended in this density-adjusted PBS buffer to reduce clumping and settling in the tubing. Cell suspensions were drawn into the pre-treated tubing separated from the pre-filled buffer by a plug of air. Lysis buffer (pH 7.9) contained 10 mM HEPES, 1.5 mM magnesium chloride (MgCl2), 10 mM potassium chloride (KCl), and 0.5% (w/v) IGEPAL-CA630 (Sigma-Aldrich, St. Louis, MO). Digestion buffer (pH 7.5) contained 20 mM Trizma hydrochloride (Tris-HCl), 15 mM sodium chloride (NaCl), 60 mM KCl, 5 mM calcium chloride (CaCl2), 0.15 mM spermine, and 0.5 mM spermidine. Quenching buffer (pH 8) contained 100 mM Tris-HCl, 20 mM ethylenediaminetetraacetic acid (EDTA), 200 mM NaCl, 2% Triton-X 100, and 0.2% sodium dodecyl sulfate (SDS). The combined lysis/digestion buffer was prepared by mixing 30 μL MNase (2000 GU/μL; New England Biolabs, Ipswich, MA), 120 μL digestion buffer, and 300 μL lysis buffer.
The fluorinated oil wets the hydrophobic channels preferentially and cuts the slower aqueous streams into droplets. Flow rates of oil (6 μL/min), cell suspension (2 μL/min), lysis-digestion reagent (2 μL/min), and quenching buffer (4 μL/min) were optimized to ensure that droplets with appropriate size were generated and quenching buffer was injected into every droplet. Droplets were collected via a 30-gauge PTFE tubing (Cole-Parmer) into a 1.5-mL tube (Eppendorf DNA LoBind, Fisher Scientific, Waltham, MA). Device operation was visualized using a high-speed camera (Phantom Miro Ex2 or Phantom VEO 640L) mounted onto either a stereoscope (Leica M80) or microscope (Leica DMi8).
Preparation of off-chip control samples
To prepare off-chip samples for comparison with those processed on-chip, an identical volume of cell suspension was added to a clean 1.5-mL tube and mixed with an equivalent volume of combined lysis/digestion buffer. Digestion was performed in bulk for the same time as droplets were incubated on-chip for enzymatic processing, and the reaction was similarly stopped by addition of quenching buffer.
Cell Culture and Sample Preparation
Jurkat acute T-cell leukemia cells (Clone E61, ATCC® TIB152, American Type Culture Collection, Manassas, VA) were cultured at 37°C with 5% CO2 in the vendor recommended media (RPMI-1640 supplemented with 10% v/v fetal bovine serum). The cells were pelleted at 800×g for 5 min at 4°C, washed with cold PBS buffer, and resuspended into the density-adjusted PBS buffer to a defined concentration, as described below. After resuspension, cells were stored on ice until chromatin digestion. Digestion experiments were carried out with 30 μL volumes of cell suspension, unless otherwise stated.
Characterization of fragmented chromatin
After quenching and collection, droplets were coalesced by adding 50-μL 1H,1H,2H,2H-perfluoro-1-octanol (Sigma-Aldrich, St. Louis, MO). Aqueous and oil phases were separated by centrifugation at 8000 rpm for 1 min at room temperature in a tabletop microcentrifuge (Centrifuge 5418, Eppendorf, Hauppauge, NY). RNase A (10 mg/mL, Sigma-Aldrich, St. Louis, MO) and Proteinase K (10 mg/mL, ThermoFisher Scientific, Grand Island, NY) were added consecutively to the aqueous phase of both on- and off-chip processed samples to degrade RNA and proteins by incubating at 65 °C for 1 hour and 2 hours, respectively. The aqueous phases were then collected into clean tubes and DNA purified using a QIAquick PCR purification kit (Qiagen). The concentration of purified DNA was determined using the Qubit dsDNA assay (ThermoFisher Scientific, Grand Island, NY). The size distribution of the fragmented chromatin (nucleosomal DNA) was characterized using a Bioanalyzer (Agilent). All samples were diluted to or below 500 pg/μL consistent with Bioanalyzer sample submission requirements. The percentage of mononucleosomal DNA in the total DNA was obtained from the Bioanalyzer software.
Library preparation, sequencing, and bioinformatic analysis
For PCR-free library preparation, purified DNA was loaded into 1.5% agarose gel and was separated at 110V for 1 h. The mononucleosomal DNA (~147 bp) was excised from the gel and purified using the Qiagen gel extraction kit. DNA concentration was determined by the Qubit dsDNA assay, and 1 μg DNA was used for library preparation using the Illumina TruSeq® DNA PCR-Free Sample Preparation kit with a slight modification. DNA was purified using 1.8x (volumetric ratio to each library) Agencourt Ampure XP beads (Beckman Coulter, Inc.) after the end repair step, and the final library was purified using 0.55x Agencourt Ampure XP beads.
For PCR-based library preparation, 10 ng DNA was used with the NuGEN Ovation Ultralow library system V2 (San Carlos, CA). DNA was end-repaired and ligated following manufacturer instructions. After the ligation reaction, the 200-300 bp range of DNA was collected by the Agencourt RNAClean XP beads and amplified by PCR. The amplified library was purified, and the size distribution of library DNA determined by the Fragment Analyzer (Advanced Analytical Technologies, Inc.) and the concentration determined by the Qubit dsDNA assay. Four indexed libraries were pooled and sequenced 51 bp from both ends in 4 lanes of Hiseq4000 (Illumina Inc.) in the Mayo Clinic Center for Individualized Medicine Medical Genomics Facility.
Reads were aligned to the hg19 genome assembly using BWA and visualized using Integrative Genomics Browser (IGV).57 Nucleosome peaks were identified and analyzed by Dynamic Analysis of Nucleosome Position and Occupancy by Sequencing (DANPOS) as described previously.58,59
Results and discussion
Overview of the droplet microfluidic nucleosome preparation workflow
We report a droplet microfluidic device that enables automated, enzymatic chromatin processing that is amenable to variable-sized, whole cell input material (Figure 1a). Unfixed Jurkat cells are combined with a stream of combined lysis/digestion buffer immediately before being encapsulated into aqueous droplets at a T-junction geometry.60 All solution flows were controlled by syringe pumps. The flow rates of cell and lysis digestion buffer were the same, and a higher oil flow rate allowed segmentation (Figure 1b and video S1). The tube delivering cells onto the device was pre-treated with Pluronic F-127 to reduce cells sticking to the tube.61 A short serpentine mixing element was incorporated immediately after droplet formation to facilitate rapid mixing of cells, detergent and MNase solutions. Incubation time for cell lysis and chromatin digestion was achieved by a series of delay channels62 (video S2 and S3), with the number of delay channels increasing for longer incubation times. MNase is a Ca2+-dependent enzyme, so the digestion reaction was quenched by picoinjecting51 an EDTA buffer into passing droplets (video S4). A saltwater-filled electrode was used to supply an AC electric field that transiently destabilized the droplet interface to allow injection of this quenching buffer. Finally, processed droplets were collected in a 1.5-mL centrifuge tube for characterization of the resulting chromatin. The complete experimental setup, including syringe pumps and the stereoscope, is shown in Figure 1c.
Figure 1.
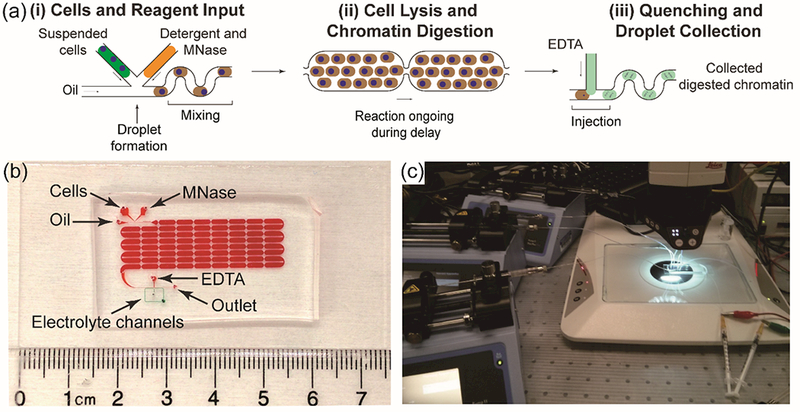
(a) Schematic of the automated, droplet-based microfluidic nucleosome preparation process. The whole procedure contains three steps: (i) loading cells, detergent, and MNase to the device for droplet generation, (ii) droplets traveling down the delay channel for chromatin digestion to complete, (iii) injecting EDTA solution to droplets to quench the enzymatic processing and collect products. (b) The 8-row device. Delay line and electrolyte channels are highlighted with red and green food dyes, respectively. (c) The complete setup for droplet microfluidic nucleosome preparation.
Multifaceted characterization of on-chip digestion efficiency
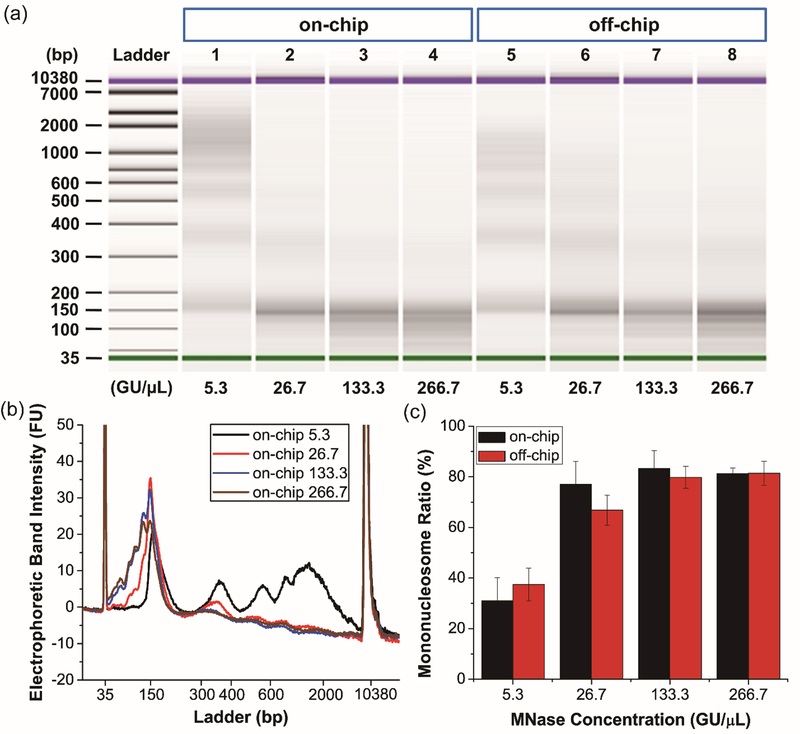
Common to standard benchtop chromatin processing is the optimization of MNase concentration and digestion time. For many applications, including nucleosome positioning assay and ChIP, DNA fragments approximating the size of DNA associated with a single nucleosome are most ideal, with ≥80% mononucleosomal DNA being an empirical benchmark.63 To identify optimal conditions for on-chip digestion, we first titrated the concentration of MNase with a fixed delay/incubation time in the droplet microfluidic device and performed fragment analysis on purified DNA from the resulting digested chromatin. In parallel with on-chip experiments, identical digestion conditions were probed in an off-chip control experiment performed manually in Eppendorf tubes. Using a device that allowed for approximately 210 s of incubation, MNase concentrations varying from 5.3 to 266.7 GU/μL were introduced to an input of 125,000 Jurkat cells, with results shown in Figure 2. As expected, the amount of DNA fragments corresponding to the size of DNA associated with a single nucleosome (~150 bp) increased as the concentration of MNase was increased (Figure 2a). At the lowest MNase concentration, the chromatin was under-digested, with purified DNA fragment bands clearly representing the length of DNA associated with mono-, di-, and tri-nucleosomes, in addition to much larger chromatin fragments (Figure 2b, the black trace). As the concentration of MNase was increased, large fragments of chromatin were further digested to yield predominantly mononucleosomes, with >80% integrated intensity being present in the mononucleosomal DNA band at concentrations equal or greater than 133.3 GU/μL. Further increasing the MNase concentration did not result in appreciable gains in mononucleosome yield (Figure 2c). Importantly, off-chip controls showed an identical trend towards higher mononucleosome yield with increasing enzyme concentration (also see Figure S2), indicating that there was no bias or artifacts introduced in droplet microfluidic chromatin processing. While not significantly different across all conditions per student t-test, the on-chip chromatin processing gave equivalent if not improved mononucleosome yield compared with off-chip controls. Closer inspection of the DNA fragment analysis for the two highest MNase concentrations showed further digestion to yield DNA sizes smaller than the typical mononucleosome. The slightly over-digested mononucleosomal DNA is desirable for the nucleosomal positioning assays described later in this manuscript but may not be optimal for other applications. However, since a 10-fold range of MNase concentration (i.e., from 26.7 to 266.7 GU/μL) generated mononucleosomes in the tested conditions, our method permits the selection of the MNase concentration most suitable for any particular application. In this study, given the desire to minimize reagent consumption, the concentration of 133.3 GU/μL was selected for further device operation.
Figure 2.
Characterization of chromatin digestion efficiency with different MNase concentrations. (a) Electropherogram of digested chromosomal DNA collected from cells processed in the droplet microfluidic devices (on-chip, lane 1-4) and 1.5-mL microcentrifuge tubes (off-chip, lane 5-8). MNase concentrations are listed on the bottom. (b) Electrophoretic band intensity profiles of on-chip samples. The peaks at 35 bp and 10380 bp are internal standards. (c) Mononucleosome yields from all samples. Error bars are standard deviation of n=3 replicates.
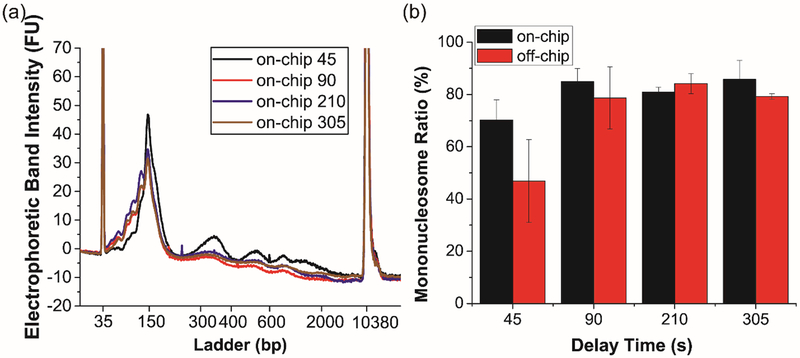
After determining a suitable MNase concentration, we turned to optimization of incubation time. Shorter incubation periods are not only advantageous from a time perspective, but shorter delays also reduce device footprint and the potential for complications of backpressure or fabrication. Devices having four different incubation times (45, 90, 210, and 305 s) were designed and fabricated using the aforementioned protocol. A cell input of 125,000 Jurkat cells were introduced to the device and combined with 133.3 GU/μL MNase in the lysis/digestion buffer, and DNA from the resulting chromatin was analyzed for fragment size distribution (Figure 3 and Figures S3 and S4). At the shortest incubation time (45 s), bands for mono-, di-, and tri-nucleosomal DNA were apparent, in addition to larger fragments (Figure 3a). However, longer delay times showed increasing mononucleosome yield (Figure 3b). Again, it is important to note that the droplet microfluidic device was equivalent or superior to the off-chip control experiments—particularly at shorter incubation times as the mononucleosome yield from samples processed on chip for 45 s was significantly higher from that of off chip (p < 0.05). This observation might be explained by the efficient mixing within droplet due to counter-rotating recirculation zones.35 To balance the incubation time with mononucleosome yield especially the desire to obtain more slightly over-digested mononucleosomes, the device design offering a delay time of 210 s was selected for subsequent experiments.
Figure 3.
Characterization of chromatin digestion efficiency with different lengths of delay time. (a) Electrophoretic band intensity profiles of on-chip samples. The peaks at 35 bp and 10380 bp represent internal standards. (b) Mononucleosome yields from all samples. Error bars are standard deviation of n=3 replicates.
Validation of flexible sample input
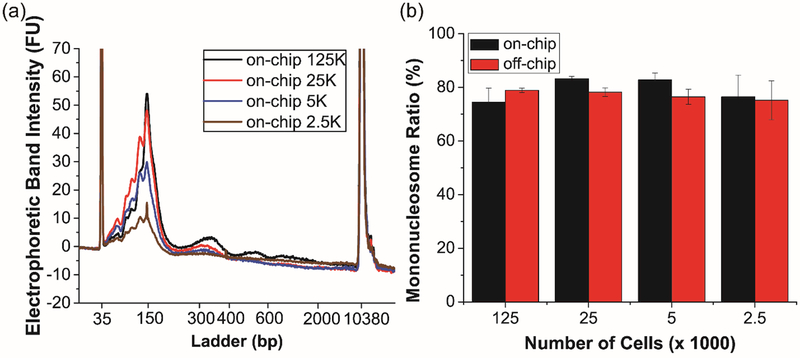
To demonstrate flexibility in terms of cell input, we investigated the chromatin digestion efficiency using samples varying from 2,500 to 125,000 cells. Jurkat cell inputs were combined on-chip with 133.3 GU/μL of MNase and allowed to be enzymatically digested for 210 s. For consistency, these variable cell numbers were suspended in a fixed volume of density-adjusted PBS buffer. Importantly, this fixed-volume approach holds over a large input range—until a large number of droplets would have more than a single cell per Poisson statistics. Furthermore, this protocol should be amenable to clinical samples where the cell number is not precisely known. DNA fragment analysis from the resulting chromatin revealed high (~80%) mononucleosome yields across all cell inputs, with differences found not to be significant via single factor ANOVA test (p > 0.05) (Figure 4a). Again, for all cell inputs, the mononucleosome yield was equivalent to or better than that observed in off-chip controls (Figure 4b and Figures S5 and S6). Importantly, the mononucleosome yield obtained from the droplet microfluidic device is independent of cell input, and the resulting input material can be optimized for downstream applications, including ChIP and nucleosome positioning assays. It is also important to note that the minimum number of cells used in these studies is limited by the analytical characterization methods, such as the Bioanalyzer. Cells are encapsulated into droplets according to Poisson statistics and under our cell concentrations and oil and buffer flow rates cells are almost always incorporated at a single cell level (i.e. one cell per drop, with many empty drops, too). Therefore, cell digestion is almost always occurring at the single cell level and there is no reason to anticipate that this device could not be used in conjunction with single cell sequencing for single cell nucleosome positioning experiments.
Figure 4.
Validation of chromatin digestion with flexible cell inputs. (a) Electrophoretic band intensity profiles of on-chip samples. The peaks at 35 bp and 10380 bp are internal standards. (b) Mononucleosome yields from all samples. Error bars are standard deviation of n=3 replicates.
Nucleosome positioning analysis enabled by droplet microfluidically-prepared mononucleosomal DNA
Fragment analysis suggested that DNA of appropriate length and quality was produced by the droplet microfluidic MNase-digestion device; however, the ultimate validation of the resulting DNA for epigenetic analysis was further demonstrated by nucleosome positioning analysis. To ensure enough input DNA material for sequencing, the total amount of Jurkat cells for each separate digestion was increased to 500,000 (suspended in 50 μL of buffer) so that >1 μg of DNA could be collected. Libraries for sequencing were then prepared using both PCR-free and PCR-amplified library generation protocols. The PCR-free library procedure has the advantage that it eliminates potential biases from the PCR procedure,64–66 whereas the PCR-amplified procedure is important to test for future applications of low input nucleosome positioning. In parallel, off-chip-prepared mononucleosomal DNA was also prepared into libraries via PCR and PCR-free. Following library preparation, samples were analyzed via next-generation sequencing on an Illumina Hi-Seq 4000 platform with one sample run per lane to obtain sufficient depth for high-resolution determination of nucleosome positioning and total nucleosome count.
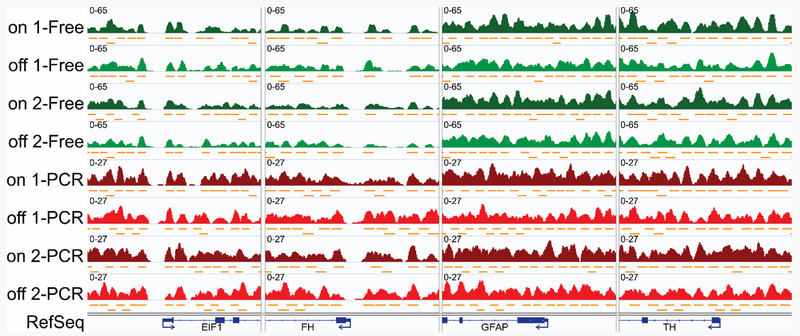
PCR-free libraries resulted in 240 ± 6 million (mean ± standard deviation) uniquely mapped reads per sample (on-chip: 236 and 245 million; off-chip: 245 and 234 million). After the removal of duplicate reads, PCR-amplified libraries generated 168 ± 4 million uniquely mapped reads per sample (on-chip: 162 and 171 million; off-chip: 168 and 170 million). The resulting nucleosome positioning analyses are shown in Figure 5 and Figure 6, allowing comparison of on-chip and off- chip chromatin digestion, as well as PCR-free and PCR-amplified library preparation. IGV traces of genomic regions for the constitutively expressed genes EIF1 (eukaryotic translation initiation factor 1) and FH (fumarate hydratase) consistently show phased and well-positioned nucleosomes flanking the NFR associated with each gene’s transcription start site (TSS) (Figure 5). This is consistent with these genes being under active transcriptional regulation. By comparison, NFRs are not observed at the TSS for the genes GFAP (glial fibrillary acidic protein) and TH (tyrosine hydroxylase), which are developmentally repressed in T cells. Further genome-wide aggregation analysis revealed remarkably well-conserved nucleosome positioning flanking the TSSs of all genes (Figure 6), with at least 5 well-positioned nucleosomes with little fuzziness flanking the TSS over a genomic region of ±1.5 kB. This observation is consistent with literature precedent using bulk-prepared nucleosomal DNA.2, 9 Importantly, mononucleosomal DNA from both the microfluidically prepared and manually prepared chromatin yielded highly similar numbers of sequencing reads and very similar patterns of nucleosome positioning. This indicates an efficacy in using the droplet microfluidic device to generate qualified mononucleosomes for next-generation sequencing compared to traditional, manual processing.
Figure 5.
Nucleosome profiles exemplified by four loci. Cells were digested by droplet microfluidic devices (“on”) and in tubes (“off”), and the libraries were constructed with (“PCR”, red) and without (“Free”, green) PCR amplification. Note NFRs and the well-positioned nucleosomes flanking them near the TSSs of the consitutively expressed genes EIF1 (positive strand) and FH (negative strand). NFRs are not present near the TSSs of the developmentally repressed genes GFAP and TH (both expressed from the negative strand).
Figure 6.
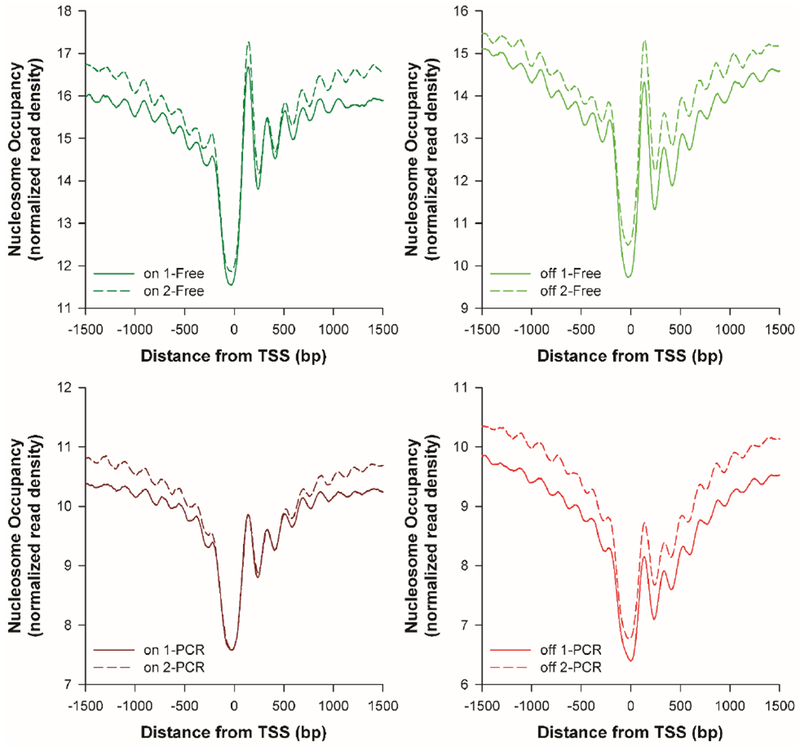
Normalized genome-wide nucleosome occupancy near TSSs in Jurkat cells processed on- and off-chip, libraries constructed with (“PCR”, red) or without (“Free”, green) PCR amplification.
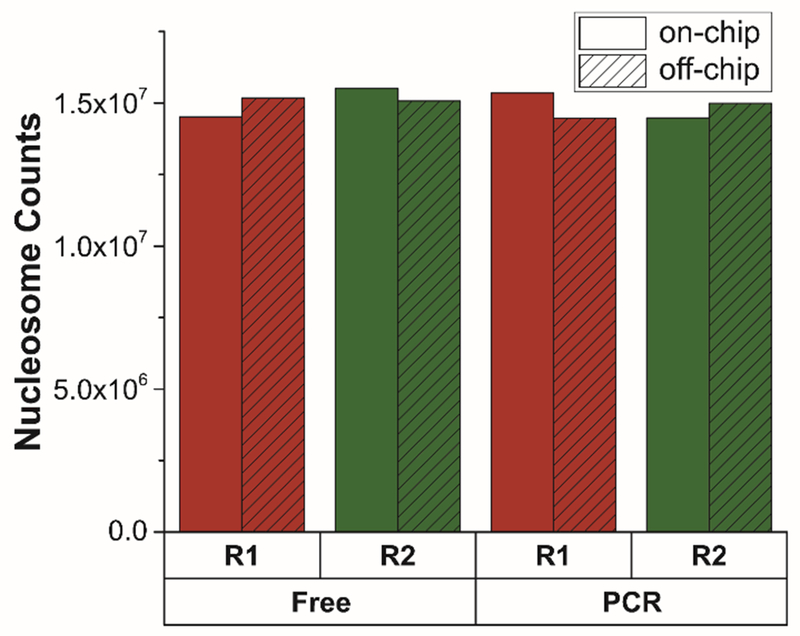
As a final comparative metric, Figure 7 shows that the number of called nucleosomes is nearly identical for on- and off-chip DNA and libraries prepared with and without PCR, with all sample preparation methods yielding approximately 15 million nucleosomes, i.e., the number expected based on the size of the human genome (approximately 3 billion bp) and the average size of nucleosomal plus linker DNA (200 bp)67. Furthermore, we found that the proportion of static plus partially overlapping nucleosomes in any two replicate samples (on- vs off-chip and PCR-free vs. PCR-amplified) averaged to be more than 96% (Table S1). Taken together, these genome-wide analyses demonstrate high reproducibility and identical performance of the droplet microfluidic device compared to manual processing in a tube. Additionally, PCR-free samples showed similar peak reads and distribution as those amplified by PCR, although PCR-amplified samples generated fewer useable reads and resulted in somewhat less well-defined nucleosome positions (Figures 5 and 6). However, the potential bias from PCR was still small, broadening the potential scope of application to smaller cell inputs. Overall, we robustly demonstrated that this droplet microfluidic nucleosome preparation strategy could provide effective samples for nucleosome positioning assays (MNase-seq) starting directly from cells, but with significant advantages in terms of automation and potential for parallel sample processing to enable higher throughput analyses.
Figure 7.
Nucleosome counts of sequenced samples that were on-chip (solid color) and off-chip (dashed) processed. Two libraries were generated from each sample (two biological replicates for on-chip and off-chip processing respectively, labeled as R1 in red and R2 in green), one directly constructed without PCR amplification (“Free”) and the other with PCR amplification (“PCR”).
Conclusion
We have developed a droplet microfluidic device to enable automated, enzymatic chromatin processing starting with intact cells as input. Using Jurkat cells as a model system, we show that cells can be simultaneously lysed and chromatin digested using MNase. We optimized both enzyme concentration and delay/incubation time to maximize yield of mononucleosomal DNA above 80% to fulfill the sample requirements of many downstream epigenomic assays including nucleosome positioning assay and ChIP. We also demonstrated that the microfluidic method is insensitive to cell input, performing robustly over a range of 2,500-125,000 cells. Importantly, we found that the microfluidic device met or exceeded the performance of off-chip, bulk sample processing, as is conventional. We then utilized the collected mononucleosomal DNA for nucleosome positioning analysis and found well-positioned nucleosomes in regions flanking TSSs of actively transcribed genes. We also found consistent nucleosome counts for on- and off-chip-processed samples and good performance for libraries prepared using both PCR-free and PCR-amplified kits. The separate success of both low input sample processing and PCR-amplified library preparation suggests amenability to future studies of nucleosome positioning from samples having limited input material. Finally, the advantages of the droplet microfluidic device in terms of automation and potential for parallelization make this a promising technology for a range of epigenetic analyses that require controllable and reproducible chromatin digestion to provide input material as the first step in downstream assays.
Supplementary Material
Acknowledgements
We gratefully acknowledge the assistance in bioinformatic analysis from Dr. Yongbing Zhao (Department of Cancer Biology, Mayo Clinic, Jacksonville, Florida, USA) and the financial support from the National Cancer Institute via R21CA191186, the Mayo-Illinois Alliance for Technology Based Healthcare, the Mayo Clinic Center for Individualized Medicine, and the NIH-sponsored Midwest Cancer Nanotechnology Training Center (R25 CA154015A).
Footnotes
Conflicts of interest
The authors declare no conflicts of interest.
References
- 1.Luger K, Mader AW, Richmond RK, Sargent DF and Richmond TJ, Nature, 1997, 389, 251–260. [DOI] [PubMed] [Google Scholar]
- 2.Jiang C and Pugh BF, Nature reviews. Genetics, 2009, 10, 161–172. [DOI] [PMC free article] [PubMed] [Google Scholar]
- 3.Struhl K and Segal E, Nature structural & molecular biology, 2013, 20, 267–273. [DOI] [PMC free article] [PubMed] [Google Scholar]
- 4.Bowman GD and Poirier MG, Chem Rev, 2015, 115, 2274–2295. [DOI] [PMC free article] [PubMed] [Google Scholar]
- 5.Woodcock CL and Ghosh RP, Cold Spring Harbor perspectives in biology, 2010, 2, a000596. [DOI] [PMC free article] [PubMed] [Google Scholar]
- 6.Small EC, Xi L, Wang JP, Widom J and Licht JD, Proceedings of the National Academy of Sciences of the United States of America, 2014, 111, E2462–2471. [DOI] [PMC free article] [PubMed] [Google Scholar]
- 7.Maehara K and Ohkawa Y, Scientific reports, 2016, 6, 19620. [DOI] [PMC free article] [PubMed] [Google Scholar]
- 8.Nocetti N and Whitehouse I, Genes & development, 2016, 30, 660–672. [DOI] [PMC free article] [PubMed] [Google Scholar]
- 9.Lai WKM and Pugh BF, Nature reviews. Molecular cell biology, 2017, 18, 548–562. [DOI] [PMC free article] [PubMed] [Google Scholar]
- 10.Workman JL, Genes & development, 2006, 20, 2009–2017. [DOI] [PubMed] [Google Scholar]
- 11.Ma S, Hsieh YP, Ma J and Lu C, Sci Adv, 2018, 4, eaar8187. [DOI] [PMC free article] [PubMed] [Google Scholar]
- 12.Ma S, de la Fuente Revenga M, Sun Z, Sun C, Murphy TW, Xie H, Gonzalez-Maeso J and Lu C, Nat Biomed Eng, 2018, 2, 183–194. [PMC free article] [PubMed] [Google Scholar]
- 13.Murphy TW, Hsieh YP, Ma S, Zhu Y and Lu C, Analytical chemistry, 2018, 90, 7666–7674. [DOI] [PMC free article] [PubMed] [Google Scholar]
- 14.Cao Z, Chen C, He B, Tan K and Lu C, Nature methods, 2015, 12, 959–962. [DOI] [PMC free article] [PubMed] [Google Scholar]
- 15.Rotem A, Ram O, Shoresh N, Sperling RA, Goren A, Weitz DA and Bernstein BE, Nature biotechnology, 2015, 33, 1165–1172. [DOI] [PMC free article] [PubMed] [Google Scholar]
- 16.Wu AR, Kawahara TL, Rapicavoli NA, van Riggelen J, Shroff EH, Xu L, Felsher DW, Chang HY and Quake SR, Lab on a chip, 2012, 12, 2190–2198. [DOI] [PMC free article] [PubMed] [Google Scholar]
- 17.Henikoff JG, Belsky JA, Krassovsky K, MacAlpine DM and Henikoff S, Proceedings of the National Academy of Sciences of the United States of America, 2011, 108, 18318–18323. [DOI] [PMC free article] [PubMed] [Google Scholar]
- 18.Weber CM, Henikoff JG and Henikoff S, Nature structural & molecular biology, 2010, 17, 1500–1507. [DOI] [PMC free article] [PubMed] [Google Scholar]
- 19.Kent NA, Adams S, Moorhouse A and Paszkiewicz K, Nucleic acids research, 2011, 39, e26. [DOI] [PMC free article] [PubMed] [Google Scholar]
- 20.Noll M, Nature, 1974, 251, 249–251. [DOI] [PubMed] [Google Scholar]
- 21.Butt TR, Jump DB and Smulson ME, Proceedings of the National Academy of Sciences of the United States of America, 1979, 76, 1628–1632. [DOI] [PMC free article] [PubMed] [Google Scholar]
- 22.Buenrostro JD, Giresi PG, Zaba LC, Chang HY and Greenleaf WJ, Nature methods, 2013, 10, 1213–1218. [DOI] [PMC free article] [PubMed] [Google Scholar]
- 23.Buenrostro JD, Wu B, Chang HY and Greenleaf WJ, Current protocols in molecular biology, 2015, 109, 21–29 21–29. [DOI] [PMC free article] [PubMed] [Google Scholar]
- 24.Xu J, Carter AC, Gendrel AV, Attia M, Loftus J, Greenleaf WJ, Tibshirani R, Heard E and Chang HY, Nature genetics, 2017, DOI: 10.1038/ng.3769. [DOI] [Google Scholar]
- 25.Giresi PG, Kim J, McDaniell RM, Iyer VR and Lieb JD, Genome research, 2007, 17, 877–885. [DOI] [PMC free article] [PubMed] [Google Scholar]
- 26.Simon JM, Giresi PG, Davis IJ and Lieb JD, Nature protocols, 2012, 7, 256–267. [DOI] [PMC free article] [PubMed] [Google Scholar]
- 27.Zhang Q, Cheng T, Jin S, Guo Y, Wu Y, Liu D, Xu X, Sun Y, Li Z, He H and Xia Q, Scientific reports, 2017, 7, 12919. [DOI] [PMC free article] [PubMed] [Google Scholar]
- 28.Johnson DS, Mortazavi A, Myers RM and Wold B, Science, 2007, 316, 1497–1502. [DOI] [PubMed] [Google Scholar]
- 29.Carey MF, Peterson CL and Smale ST, Cold Spring Harbor protocols, 2009, 4, doi: 10.1101/pdb.prot5279. [DOI] [PubMed] [Google Scholar]
- 30.Mito M, Kadota M, Tanaka K, Furuta Y, Abe K, Iwasaki S and Nakagawa S, Scientific reports, 2018, 8, 1143. [DOI] [PMC free article] [PubMed] [Google Scholar]
- 31.Teh SY, Lin R, Hung LH and Lee AP, Lab on a chip, 2008, 8, 198–220. [DOI] [PubMed] [Google Scholar]
- 32.Seemann R, Brinkmann M, Pfohl T and Herminghaus S, Rep Prog Phys, 2012, 75, 016601. [DOI] [PubMed] [Google Scholar]
- 33.Huebner A, Sharma S, Srisa-Art M, Hollfelder F, Edel JB and Demello AJ, Lab on a chip, 2008, 8, 1244–1254. [DOI] [PubMed] [Google Scholar]
- 34.Dressler OJ, Maceiczyk RM, Chang SI and deMello AJ, Journal of biomolecular screening, 2014, 19, 483–496. [DOI] [PubMed] [Google Scholar]
- 35.Baroud CN, Gallaire F and Dangla R, Lab on a chip, 2010, 10, 2032–2045. [DOI] [PubMed] [Google Scholar]
- 36.Christopher GF and Anna SL, Journal of Physics D: Applied Physics, 2007, 40, R319–R336. [Google Scholar]
- 37.Leman M, Abouakil F, Griffiths AD and Tabeling P, Lab on a chip, 2015, 15, 753–765. [DOI] [PubMed] [Google Scholar]
- 38.Chiu DT, Lorenz RM and Jeffries GD, Analytical chemistry, 2009, 81, 5111–5118. [DOI] [PMC free article] [PubMed] [Google Scholar]
- 39.Chabert M and Viovy JL, Proceedings of the National Academy of Sciences of the United States of America, 2008, 105, 3191–3196. [DOI] [PMC free article] [PubMed] [Google Scholar]
- 40.Gorris HH and Walt DR, Angew Chem Int Ed Engl, 2010, 49, 3880–3895. [DOI] [PubMed] [Google Scholar]
- 41.Kemna EW, Schoeman RM, Wolbers F, Vermes I, Weitz DA and van den Berg A, Lab on a chip, 2012, 12, 2881–2887. [DOI] [PubMed] [Google Scholar]
- 42.Eastburn DJ, Sciambi A and Abate AR, Analytical chemistry, 2013, 85, 8016–8021. [DOI] [PubMed] [Google Scholar]
- 43.Tran TM, Lan F, Thompson CS and Abate AR, Journal of Physics D: Applied Physics, 2013, 46, 114004. [Google Scholar]
- 44.Mazutis L and Griffiths AD, Lab on a chip, 2012, 12, 1800–1806. [DOI] [PubMed] [Google Scholar]
- 45.Chokkalingam V, Ma Y, Thiele J, Schalk W, Tel J and Huck WT, Lab on a chip, 2014, 14, 2398–2402. [DOI] [PubMed] [Google Scholar]
- 46.Tan Y-C, Ho YL and Lee AP, Microfluidics and Nanofluidics, 2006, 3, 495–499. [Google Scholar]
- 47.Link DR, Anna SL, Weitz DA and Stone HA, Physical review letters, 2004, 92, 054503. [DOI] [PubMed] [Google Scholar]
- 48.O’Donovan B, Tran T, Sciambi A and Abate A, Journal of visualized experiments : JoVE, 2014, DOI: 10.3791/50913. [DOI] [PMC free article] [PubMed] [Google Scholar]
- 49.Fidalgo LM, Abell C and Huck WT, Lab on a chip, 2007, 7, 984–986. [DOI] [PubMed] [Google Scholar]
- 50.Li L, Boedicker JQ and Ismagilov RF, Analytical chemistry, 2007, 79, 2756–2761. [DOI] [PMC free article] [PubMed] [Google Scholar]
- 51.Abate AR, Hung T, Mary P, Agresti JJ and Weitz DA, Proceedings of the National Academy of Sciences of the United States of America, 2010, 107, 19163–19166. [DOI] [PMC free article] [PubMed] [Google Scholar]
- 52.Doonan SR and Bailey RC, Analytical chemistry, 2017, 89, 4091–4099. [DOI] [PMC free article] [PubMed] [Google Scholar]
- 53.Tabeling P, Lab on a chip, 2009, 9, 2428–2436. [DOI] [PubMed] [Google Scholar]
- 54.Ma S, Sherwood JM, Huck WT and Balabani S, Lab on a chip, 2014, 14, 3611–3620. [DOI] [PubMed] [Google Scholar]
- 55.Tice JD, Song H, Lyon AD and Ismagilov RF, Langmuir, 2003, 19, 9127–9133. [Google Scholar]
- 56.Mazutis L, Gilbert J, Ung WL, Weitz DA, Griffiths AD and Heyman JA, Nature protocols, 2013, 8, 870–891. [DOI] [PMC free article] [PubMed] [Google Scholar]
- 57.Robinson JT, Thorvaldsdottir H, Winckler W, Guttman M, Lander ES, Getz G and Mesirov JP, Nature biotechnology, 2011, 29, 24–26. [DOI] [PMC free article] [PubMed] [Google Scholar]
- 58.Chen K, Xi Y, Pan X, Li Z, Kaestner K, Tyler J, Dent S, He X and Li W, Genome research, 2013, 23, 341–351. [DOI] [PMC free article] [PubMed] [Google Scholar]
- 59.Li Z, Gadue P, Chen K, Jiao Y, Tuteja G, Schug J, Li W and Kaestner KH, Cell, 2012, 151, 1608–1616. [DOI] [PMC free article] [PubMed] [Google Scholar]
- 60.Garstecki P, Fuerstman MJ, Stone HA and Whitesides GM, Lab on a chip, 2006, 6, 437–446. [DOI] [PubMed] [Google Scholar]
- 61.Boxshall K, Wu M-H, Cui Z, Cui Z, Watts JF and Baker MA, Surface and Interface Analysis, 2006, 38, 198–201. [Google Scholar]
- 62.Frenz L, Blank K, Brouzes E and Griffiths AD, Lab on a chip, 2009, 9, 1344–1348. [DOI] [PMC free article] [PubMed] [Google Scholar]
- 63.Rodriguez J, McKnight JN and Tsukiyama T, Current protocols in molecular biology, 2014, 108, 21–28 21–16. [DOI] [PMC free article] [PubMed] [Google Scholar]
- 64.Aird D, Ross MG, Chen WS, Danielsson M, Fennell T, Russ C, Jaffe DB, Nusbaum C and Gnirke A, Genome biology, 2011, 12, R18. [DOI] [PMC free article] [PubMed] [Google Scholar]
- 65.Kebschull JM and Zador AM, Nucleic acids research, 2015, 43, e143. [DOI] [PMC free article] [PubMed] [Google Scholar]
- 66.Shagin DA, Shagina IA, Zaretsky AR, Barsova EV, Kelmanson IV, Lukyanov S, Chudakov DM and Shugay M, Scientific reports, 2017, 7, 2718. [DOI] [PMC free article] [PubMed] [Google Scholar]
- 67.Gaffney DJ, McVicker G, Pai AA, Fondufe-Mittendorf YN, Lewellen N, Michelini K, Widom J, Gilad Y and Pritchard JK, PLoS genetics, 2012, 8, e1003036. [DOI] [PMC free article] [PubMed] [Google Scholar]
Associated Data
This section collects any data citations, data availability statements, or supplementary materials included in this article.


