

Abstract
Rapidly determining the biological effect of perturbing a site within a potential drug target could guide drug discovery efforts but it remains challenging. Here, we describe a facile target validation approach that exploits monobodies, small synthetic binding proteins that can be fully functionally expressed in cells. We developed a potent and selective monobody to WDR5, a core component of the Mixed Lineage Leukemia (MLL) methyltransferase complex. The monobody bound to the MLL-interaction site of WDR5, the same site for small molecule inhibitors whose efficacy has been demonstrated in cells but not in animals. As a genetically encoded reagent, the monobody inhibited proliferation of an MLL-AF9 cell line in vitro, suppressed its leukemogenesis and conferred survival benefit in an in vivo mouse leukemia model. The capacity of this approach to readily bridge biochemical, structural, cellular characterization and tests in animal models may accelerate discovery and validation of druggable sites.
Effective therapeutic development relies on the ability to prioritize the most promising targets at an early phase. Small molecules remain the predominant therapeutics for modulating intracellular targets. The challenges of developing compounds that are potent, selective and effective in vivo limit our ability to accurately predict therapeutic potential of a candidate as well as on-target efficacy in a relevant disease model. Effective chemical probes need to be potent and selective for the target and also have a clear mode of action1. Genetic knockout or knockdown approaches, though selective, can produce phenotypes distinct from perturbation with a drug2. Thus, there remain acute needs for better technologies for facile validation of potential therapeutic targets in cells and animals.
We present here an approach utilizing monobodies, synthetic binding proteins, for accelerating target validation. Our approach exploits several attributes of monobodies: rapid generation of potent and selective monobodies; monobodies have strong propensity to bind to functional sites within a target protein and hence often are potent inhibitors of the target function3; unlike antibodies, monobodies contain no disulfide bonds, which allows them to be expressed in the fully functional form under the reducing environment within the cell. Thus, monobodies are particularly suited as genetically encoded, intracellular inhibitors3.
In this proof-of-concept study, we chose to target WDR5, a core component of the Mixed Lineage Leukemia (MLL1) methyltransferase complex. MLL1 is a histone H3 lysine 4 methyltransferase and plays important roles in transcription activation, embryonic development and hematopoietic differentiation4. The MLL1 protein in isolation has low enzymatic activity, which is dramatically enhanced upon the assembly of the core complex with three other components, WDR5, ASH2L and RbBP55,6,7. WDR5 recognizes a conserved “Win” or WDR5-interaction motif in the MLL family proteins8. Despite its interaction with multiple MLL family enzymes, WDR5 is critical for the integrity and activity of the MLL1 complex, but not the homologous MLL2 and MLL3/4 complexes 6,9,10. Therefore, targeting WDR5 offers selective inhibition towards MLL1. Indeed, peptides and small molecules targeting the Win motif-binding site disrupt the MLL1-WDR5 interaction, and inhibit MLL1 methyltransferase activity8,11–17.
Chromosomal translocations involving the MLL1 gene are found in a subset of acute myeloid leukemia and acute lymphoblastic leukemia18–20. Previous studies show that targeting MLL1-WDR5 interaction is a plausible strategy for the treatment of MLL1-rearranged leukemia 21. Small molecule inhibitors (e.g. MM-401) targeting MLL1-WDR5 inhibit the growth of MLL leukemia cells15,17,22. However, in vivo validity of targeting WDR5 to block MLL leukemogenesis has not been established, due to low bioavailability and poor pharmacokinetic properties of these compounds. For example, cellular permeability of MM-401, is ≤ 5%15. Because of the well-defined mode of inhibition of existing compounds and the gap in our knowledge, WDR5 was an ideal case for testing our strategy.
Results
Generation of monobodies
By applying established procedures that combine phage display and yeast surface display23 we generated a total of 22 monobody clones that bound to the purified WDR5 protein. They bound to WDR5 with apparent KD values < 15 nM as measured using yeast surface display (Supplementary Fig.1a). We identified Mb(WDR5_S4), Mb(WDR5_S6) and Mb(WDR5_S7) that had high solubility, monodispersity and high affinity as purified proteins (Fig. 1a, Supplementary Fig. 1b)., All of the 22 monobody clones bound to an overlapping epitope, as evidence by the fact that their binding to WDR5 was competed by the presence of Mb(WDR5_S4) (Supplementary Fig. 1c). The monobody, Mb(WDR5_S4) abbreviated as Mb(S4) hereafter, had the highest affinity and hence was chosen for functional characterization.
Figure 1. Monobody, Mb(S4), inhibits MLL1 enzyme activity and targets the Win motif-binding site on WDR5.

(a) Binding titration of Mb(S4) to WDR5. Binding of purified Mb(S4) to purified WDR5 immobilized on beads was detected using flow cytometry. The curve shows the best fit to the 1:1 binding model. The data points shown are the mean and the error bars on each data points are s.d. from n=3 independent experiments. The error for the KD is s.d. from n=3 independent experiments. (b) Effects of Mb(S4) and Mb(S4mut) on the methyltransferase activity of a reconstituted MLL core complex. Data from n=2 independent experiments are shown. (c) Inhibition of the interaction between WDR5 and a histone peptide by Mb(S4). Binding of 250 nM histone peptide-streptavidin-Dylight 650 complex to biotinylated WDR5 immobilized on streptavidin-coated M280 beads was measured in the absence and presence of 100 nM Mb(S4). The center values and error bars are the mean and s.d. from n=3 independent experiments.
Mb(S4) potently inhibited the methyltransferase activity of the MLL1 core complex in a dose-dependent manner (Fig. 1b). An in vitro pull-down experiment showed that Mb(S4) interacted with WDR5 and RbBP5, but not the MLL1 SET domain in the reconstituted MLL1 core complex and its binding disrupted the WDR5-MLL1 interaction (Supplementary Fig. 2a). Because WDR5-MLL1 interaction pocket was also involved in histone H3 binding24, we found that Mb(S4) disrupted the interaction of WDR5 with histone H3 peptide as expected (Fig. 1c). Taken together, these results suggest that Mb(S4) disrupts the MLL1 core complex by binding to the Win/H3-binding pocket of WDR5.
Structural basis of monobody-WDR5 interaction
To further define the mechanism of action of Mb(S4), we determined the crystal structure of the WDR5-Mb(S4) complex at 2.7 Å resolution (Fig. 2a, Supplementary Table 1). Both monobody and WDR5 retained their respective overall fold (Cα rmsd of 1.0 Å for Mb(S4) excluding the diversified loops of monobody, and 0.8 Å for WDR5). As expected, Mb(S4) bound the central cavity of WDR5 where the Win motif binds (Fig. 2a). Mb(S4) occupies surfaces of WDR5 that are remarkably similar to that by the MLL1 Win peptide 11 (Fig. 2b and c). Both interfaces include a total of 26 WDR5 residues, and 20 residues are shared between them (Supplementary Table 2). The sizes of their interface are nearly identical (699 versus 687 Å2). Thus, Mb(S4) effectively sequesters the surfaces of WDR5 that are used for binding to the MLL1 Win peptide and other ligands for this pocket.
Figure 2. The crystal structure of the WDR5/Mb(S4) complex.

(a) Cartoon representation of the complex. The diversified residues in the monobody are shown in colored spheres. (b) The WDR5-Mb(S4) interface. WDR5 is shown in white surface representation with the WDR5 residues within 4.5 Å from the monobody in brown. Mb(S4) residues with buried surface areas no less than 1.0 Å2 (Supplementary Table 2) are shown as sticks. FG-loop residues are only partially labeled for clarity. The left panel shows the composite omit map (mFo-DFc) contoured at the 2σ level for the contact residues of Mb(S4). (c) The WDR5-MLL1 Win peptide complex (PDB ID 4ESG)11 presented in the same manner and in the equivalent orientation as in b. Residues 3760–3770 of the MLL1 peptide are shown (d) Detailed representation of WDR5 interaction with MLL1/WIN motif11, FG-loop residues of Mb(S4) and MM-40115. WDR5 residues are labeled in red, and MLL1/WIN motif, Mb(S4) and MM-401 residues in black. Salt bridges and hydrogen bonds are shown as dotted black lines. (e) Overlay of WDR5-interacting residues of Mb(S4) (in cyan) with MLL1/WIN motif (in magenta) (left panel) and with MM-401 (in magenta) (right panel). The overlapping residues between the WIN motif and Mb(S4) are indicated as uppercase letters in the sequence alignment.
Residues in the FG loop of Mb(S4), which was the most extensively diversified in the library (Supplementary Fig. 1a), make most contacts with WDR5 (Fig. 2a and 2b). Strikingly, the monobody inserted its Arg80 side chain in the cavity in a manner similar to Arg residues of previously identified ligands, such as the Win motif of MLL1 and a histone H3 peptide 9,24–26, and the guanidine group of MM-401 (Fig. 2d; Supplementary Fig. 2b)12,16,22,27. The binding modes of monobody, the Win peptide and MM-401 into this cavity are remarkably similar (Fig. 2e). Mb(S4) utilized additional residues in the FG loop, H31 in β-strand C and K49 in β-strand D to contact WDR5 (Fig. 2a and 2b).
To confirm the observed interaction and prepare a closely matched negative control, we replaced Arg and Trp residues of Mb(S4) that make extensive interactions with WDR5 with Asp and Ala, respectively (R80D/W81A). The binding of the mutant protein, Mb(S4mut), to WDR5 was undetectable (Supplementary Fig. 2c and d). Consistently, Mb(S4mut) did not inhibit MLL1 methyltransferase activity (Fig. 1b) or interacts with WDR5 in the MLL1 core complex in vitro (Supplementary Fig. 2a). In addition, a charge reversal mutation, K49E, strongly reduced binding of Mb(S4) to WDR5 (Supplementary Fig. 2c), suggesting that residues outside the FG loop also contribute to the monobody-WDR5 interaction. Mb(S4) has much high affinity than the MLL1 Win peptide whose KD is in the low μM range11. We speculate that the constrained conformation of the FG loop, as oppose to the inherently disordered nature of a linear peptide such as the Win peptide, may favorably contribute to the high affinity, because of a smaller loss of the conformational entropy upon binding.
WDR5 interacts with another core component of the MLL complex, RbBP5, using surfaces distant from the Win-binding site. Binding of Mb(S4) did not affect the affinity of WDR5-RbBP5 interaction (Supplementary Fig. 3a). The conformation of WDR5 in the WDR5-Mb(S4) complex was nearly identical to those of WDR5 in complexes where a ligand is bound to the RbBP5-binding pocket (Supplementary Fig. 3b). These results indicate that Mb(S4) does not allosterically affect WDR5-RbBP5 interaction.
Mb(S4) inhibits MLL1-dependent gene expression
To utilize Mb(S4) as a genetically encoded intracellular inhibitor, we first evaluated the specificity of Mb(S4) in the context of the cellular proteome. Mb(S4) captured a major band at ~36 kDa from whole-cell lysate or nuclear extracts of HEK293-T cells (Supplementary Fig. 4), which was confirmed to be WDR5 by mass spectrometry analysis (Supplementary Dataset). The negative control monobody, Mb(S4mut), did not capture WDR5 or other proteins associated with the MLL family enzymes in any sample we tested. These results demonstrate that Mb(S4) interacts with WDR5 in cells with high specificity.
We next examined the function of Mb(S4) on MLL1-dependent gene expression. First, we expressed the Mb(S4)-EGFP fusion gene in HEK293-T cells by transient transfection. We found dose-dependent repression of HOXA9 gene expression, a well-known MLL1 target, by the Mb(S4)-EGFP fusion (Supplementary Fig. 5). In contrast, the expression of Mb(S4mut) had a much weaker effect. Next, we tested the effects of Mb(S4) and Mb(S4mut) on Hoxa9 gene expression in the murine MLL-AF9 leukemia cell line15. To minimize potentially toxic effects of the monobodies, we utilized a DHFR degron-based inducible system to control their expression28. Here, the monobody is fused between a destabilized DHFR variant and EGFP, and the fusion protein is degraded in the absence of the DHFR ligand trimethoprim (TMP) and is stabilized by TMP. Fusion of Mb(S4) with DHFR and EGFP did not influence its binding to WDR5 (Supplementary Fig. 6a). Mb(S4) or Mb(S4mut) as the fusion protein also did not affect expression of WDR5 or other MLL core components in cells (Supplementary Fig. 6b). Induction of Mb(S4) by TMP addition resulted in a 50% reduction of Hoxa9 expression in MLL-AF9 cells (Fig. 3a). This level of reduction, albeit moderate, is similar to what was reported for the small molecule inhibitor MM-401 as well as MLL1 genetic deletion15, suggesting that Mb(S4)-EGFP was fully engaged with WDR5 and effectively blocked WDR5-MLL1 interaction as well as its downstream gene expression in cells.
Figure 3. Mb(S4) inhibits HoxA9 expression and proliferation of MLL-AF9 cells.
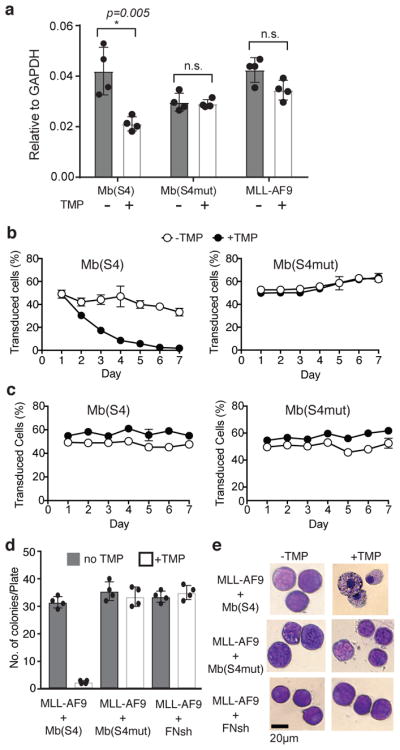
(a) HoxA9 mRNA levels in MLL-AF9 transduced with Mb(S4) or Mb(S4mut), with and without induction of the monobodies with TMP. mRNA levels were normalized against those of Gapdh. The center values and error bars are the mean and s.d. from n=4 independent experiments. Multiple t-test was used to identify the significance of the differences. (b and c) Cell proliferation assay of MLL-AF9 (b) and E2A-HLF (c) cells transduced with Mb(S4) or Mb(S4mut) with or without induction of the monobodies with TMP. The data points and error bars are the mean and s.d. from n=4 biological replicate samples. (d) The number of colonies observed per plate in clonogenic assays using bone marrow progenitor cells transduced with MLL-AF9 and the monobody vector encoding Mb(S4), Mb(S4mut) or Mb(FNsh), treated with or without TMP (Supplementary Fig. 7c). Mb(FNsh) is a negative control monobody in which residues in the BC, DE and FG loops (Supplementary Fig. 1a) are replaced with Ser. The center values and error bars are the mean and s.d. from n=3 independent experiments. This experiment was repeated twice. (e) Wright-Giemsa-stained cytospins for bone marrow progenitor cells transduced with MLL-AF9 and the indicated monobody vector, treated with or without TMP.
To test if disruption of WDR5-MLL1 interaction by Mb(S4) inhibits proliferation of leukemia cells, we performed the competitive growth assay in which cells with or without monobody expression were mixed in a 1:1 ratio and relative ratio of two population (GFP+ vs. GFP-) was determined at different time points by flow cytometry. Expression of Mb(S4), but not Mb(S4mut), had a profound inhibitory effect on the proliferation of MLL-AF9 cells (Fig. 3b). In contrast, Mb(S4) did not affect proliferation of MLL1 independent E2A-HLF leukemia cells (Fig. 3c; Supplementary Fig. 7a and 7b). Thus, targeting of the WDR5-MLL1 interaction by Mb(S4) specifically inhibited proliferation of MLL1-dependent leukemia cells, confirming previous results by the small molecule inhibitors.15,22 We further tested the effect of Mb(S4) on clonogenicity of MLL-AF9 cells on methylcellulose medium. Mb(S4), but not Mb(S4mut) or another nonbinding monobody FNsh, significantly reduced colony formation capability of the MLL-AF9 cells. It induced significant differentiation of leukemic blasts toward myeloid lineages (Fig. 3d–e; Supplementary Fig. 7c).
Mb(S4) suppresses leukemogenesis
Having established genetically encoded Mb(S4) as a potent and selective inhibitor of the WDR5-MLL1 interaction, we next used it to examine the therapeutic potential of targeting the WDR5-MLL1 interaction in the MLL-AF9 leukemia model in vivo. To this end, we engrafted lethally irradiated mice with MLL-AF9 cells (termed MAF9) or MLL-AF9 cells expressing TMP-inducible Mb(S4) (termed MAF9-S4) or TMP-inducible Mb(S4mut) (termed MAF9-S4mut). Similar engraftment efficiency was found for all experimental groups 48-hour post transplantation. At two weeks post engraftment, when hematopoietic compartment was reconstituted with engrafted cells, Trimethoprim/sulfamethoxazole (TMP/SMX) was administered for 10 consecutive days to induce monobody expression. Induction of Mb(S4) significantly increased leukemia latency and resulted in substantial benefit in survival as compared with mice recipients of MAF9-S4mut cells (Fig. 4a, p<0.001). Notably, there was a significant difference in survival curve between the MAF9 and MAF9-S4mut mice. This difference was probably due to a lower percentage of leukemia stem cells (LSK+) in the MAF9-S4mut cells relative to the parental MAF9 cell culture (Fig. 4a). Viral transduction with a corresponding empty vector that does not express a DHFR-Mb-GFP fusion also decreased the percentage of leukemia stem cells (Supplementary Fig. 8). Because engrafted MAF9-S4mut cells had higher amount of LSK+ cells than the MAF9-S4 cells and yet these died earlier, it is likely that the survival benefit of Mb(S4) over Mb(S4mut) mice was underestimated in our study.
Figure 4. Expression of Mb(S4) in MLL-AF9 cells inhibits leukemia progression in a mouse model.

(a) Kaplan-Meier survival curves of C56BL/6 mice groups (n=12 per group) transplanted with MAF9, MAF9-S4mut and MAF9-S4. The monobodies were induced with oral TMP treatment for ten consecutive days as marked (days 15–25). The p values, calculated using the long rank (Mantel-Cox) test, are < 0.0001 for each group. For the difference between the MAF9-S4 and MAF9-S4mut groups, the p value calculated using the Behan-Breslow-Wilcoxon test is 0.0005. The right panels show flow cytometry assessment of the potency of MAF9 cells used. The percentage values for leukemia stem cells (Lin−, c-Kithigh and Sca1low; right bottom quadrant) are shown. Data are representative of n=3 independent experiments. (b) Representative images (n=3 independent mice) of the spleen from MAF9-S4mut and MAF9-S4 transplanted mice. Samples were collected 40 days after transplantation. (c) Histological sections of liver from each experiment group as indicated. The liver from a non-transplanted mouse was used as the normal control. Black arrows indicated the infiltrated leukemic blasts. Images were representative of n=3 independent mice. (d) Cytological Giemsa staining of bone marrow cells isolated 40 days post transplantation, cells from non-transplanted mice were included as normal control. Images were representative of n=3 independent mice. (e) RT-qPCR for HoxA7, HoxA9, Deptor, Bcl11a, Celf4 and Egr2 in primary bone marrow cells isolated from MAF9-S4, MAF9-S4mut and MAF9 mice treated with or without TMP. Gene expression was normalized against Gapdh and was presented as fold change against that of MLL-AF9 cells, which was arbitrarily set to 1. Data were presented as mean ± s.d. from three independent experiments. (f) ChIP-qPCR analyses for H3K4me1 at MLL1 binding sites for HoxA7, HoxA9, Deptor, Bcl11a, Celf4 and Egr2 in bone marrow cells isolated from MAF9-S4, MAF9-S4mut and MAF9 mice with or without TMP treatment. The data was normalized against 5% input and presented as mean ± s.d. from n=3 independent experiments.
Consistent with leukemia development in vivo, spleens from MAF9-S4mut mice at 30-day post implantation, when first MAF9 mouse became morbid, were larger than those of MAF9-S4 mice (Fig. 4b). There were also significant increase of myeloblast counts in the bone marrow as well as myeloblast infiltration in liver and spleen of MAF9-S4mut mice as compared with MAF9-S4 mice (Fig. 4c; Supplementary Fig. 9a–b). Histology of blood cells isolated from MAF9-S4 mice at 40 day after transplantation showed that while significant numbers of undifferentiated myeloblasts were observed in the peripheral blood of MAF9 and MAF9-S4mut mice (Fig. 4d), only differentiated myeloid cells were found in the peripheral blood of MAF9-S4 mice (Fig. 4d). Flow cytometry analysis further confirmed the marked reduction of the CD11b+/Gr-1+ leukemia blasts in bone marrow of the MAF9-S4 mice as compared with MAF9-S4mut and MAF9 mice (Supplementary Fig. 9c). Taken together, these results indicate that inhibition of the WDR5-MLL1 interaction delays onset of MLL-AF9 leukemia and increases survival benefit in vivo.
Molecular analyses of MAF9 cells isolated 40 days post engraftment support the mechanism of action of Mb(S4) in inhibiting leukemogenesis. Mb(S4) expression down-regulated several well-established MLL1 direct targets, e.g. Hoxa7, Hoxa9, Deptor, Bcl11a and Egr2 (Fig. 4e). There was 35–55% reduction of H3K4me1 at known MLL1 binding sites near these genes in MLL-AF9 cells expressing Mb(S4) (Fig. 4f). In contrast, no significant reduction of H3K4me1 were found in MLL-AF9 or MLL-AF9 cells expressing Mb(S4mut).
Discussion
Our study here provides a critical proof of concept that validates the survival benefit of targeting WDR5 in vivo. The use of inducible and genetically encoded inhibitors circumvents the major challenge in making chemical probes sufficiently potent, selective and bioavailable for target engagement in animal models. The strong tendency of monobodies to bind to a functional site within a protein and their ability to bind to diverse surface topography including virtually flat surfaces3 suggest that one can identify monobody inhibitors against many targets without extensive effort. Their effectiveness as crystallization chaperones also helps establish their mechanism of action29. Although the specific goal of this study is to validate the efficacy of targeting a known druggable site, our strategy can be readily expanded for discovering and validating new druggable targets. Indeed, our recent success in identifying a monobody that binds to an allosteric site of RAS and inhibits RAS-mediated signaling30 suggests that one could identify a new druggable site even in an extensively studied protein. Whereas this study was designed to addressing on-target, on-tissue efficacy, systemic expression in transgenic animals could address off-tissue toxicity. Thus, we propose that our approach is generally applicable to establishing the best-case-scenario outcome for specific perturbation of the target of interest in vivo and is a valuable tool for making the go or no-go decision in drug discovery at an early stage.
Online Methods
Protein expression and purification
Expression vectors for human WDR5 (residues 1–334) with an N-terminal His6 tag and a C-terminal biotin-acceptor tag and for human RbBP5 (full length) with an N-terminal biotin-acceptor tag and a C-terminal His6 tag were kindly provided by Susanne Gräslund and Cheryl Arrowsmith (Structural Genomics Consortium). Monobodies were produced using the pHBT vector with N-terminal His6 and biotin-acceptor tags31. The proteins were produced in BL21(DE3) cells containing the pBirAcm plasmid in the presence of 50 μM biotin to produce biotinylated proteins.
Proteins were purified using Ni-Sepharose gravity flow columns (GE Healthcare) and monodispersity of these proteins was assessed using size exclusion chromatography columns (GE Healthcare). Supplementary Figure 10 shows the purity of proteins used in biochemical assays. For crystallization, the fusion tags were removed using tobacco etch virus (TEV) protease cleavage and Ni-Sepharose columns.
Phage display and yeast display-based selection
The method of generating monobodies has been previously described23. Two monobody libraries (‘loop’ and ‘side’; Supplementary Fig. 1a) were used to generate monobodies with diverse binding modes23. Each of these libraries contains approximately 10 billion unique monobody clones in which 16–26 residues are diversified using highly tailored amino acid combinations23. Selection details were followed as described32.
Bead-based binding assays
The general methods for bead-based assays have been described33. The assay design was followed as previously described32.
In vitro methyltransferase assay
Monobodies were tested in histone methyltransferase (HMT) reaction buffer consisting 50mM Tris-HCl, pH8.0, 150mM NaCl, and 10% glycerol. Human MLL1 SET domain, WDR5, RbBP5, and ASH2L were mixed in equal stoichiometry to form the active MLL1 complex, at a final concentration of 125 nM. Different amounts of monobodies were mixed with MLL1 complex and incubated on ice for 10 minutes prior to initiation of HMT reaction with 1 μM of 3H-SAM (S-adenosylmethionine) and 4 μM of histone H3 (1–21) peptide. HMT reactions were allowed to proceed for one hour at room temperature and terminated by spotting 10 μL of reaction mixture onto Whatman P81 ion exchange filter paper. The filter paper was air dried, and washed in three 10-minute washes in 50mM sodium bicarbonate, pH 9.0 to remove excess SAM. Filter paper was heat-dried for 20 minutes and placed in 10 mL Ultima Gold scintillation fluid for 3H signal acquisition in the unit of Counts Per Minute (CPM). Note that the KD value of WDR5-Mb(S4) interaction (5 nM) is much lower than the concentration of MLL1 complex necessary for the assay and therefore a relevant IC50 value cannot be derived from the data shown in Figure 1. The purpose of this experiment is instead to show dose-dependent inhibition.
HEK293-T cell transfection
HEK293-T cells were cultured in Dulbecco’s Modified Eagle’s Medium supplemented with 10% fetal bovine serum and antibiotic-antimycotic mix (Gibco). Cells were transfected with expression vectors encoding the monobody-EGFP fusion proteins using polyethylenimine (PEI) or Hilymax (Dojindo). Cells were harvested 48 hours after transfection, checked for monobody-EGFP expression using flow cytometry and then used to prepare RNA using Trizol.
Immunoprecipitation
Biotinylated Mb(S4) or Mb(S4mut) (150 pmol) and 50 μl of pre-washed DynaBeads M-280 (ThermoFisher) were used for immunoprecipitation experiments. Whole cell lysate or nuclear extract was prepared from wild-type HEK293-T cells. Whole cell lysates or nuclear extracts were precleared with M-280 Dynabeads to eliminate proteins that bind nonspecifically to the beads before incubating with monobody-immobilized Dynabeads for 2 hours at 4°C with rotation. The Dynabeads were washed four times with 20 mM Tris HCl buffer pH 8.0 containing 480 mM NaCl, 5 mM MgCl2, 0.1% Sodium deoxycholate and 0.5% NP-40 with 10 minute incubation for each wash step. The immunoprecipitated proteins were eluted from the M280 beads by boiling the beads in 10 mM Tris HCl buffer pH 8.0 containing 150 mM NaCl, and 0.1% SDS for 5 minutes. The eluted proteins were characterized by SDS-PAGE detected with silver staining and by mass spectrometry at the NYU School of Medicine Proteomics Laboratory.
Crystallization of WDR5/Mb(WDR5_S4) complex
Purified WDR5 (31–334) and Mb(S4) proteins were mixed in the molar ratio of 1.0:1.5 and the complex was purified using a Superdex75 16/600 size exclusion chromatography column (GE Healthcare) in 25 mM Tris pH 8.0, 150 mM NaCl, 0.2 mM TCEP. The protein complex was concentrated to a final concentration of 12.5 mg/ml. Initial crystallization screening of ~500 conditions was carried out in 96-well plates using the hanging drop vapor diffusion method with a crystallization robot (Mosquito, TTP Labtech). Crystals used for data collection were obtained in 0.1 M BisTris HCl buffer pH 5.5 containing 28% PEG3350, cryoprotected with 21% Glycerol and flash cooled in liquid nitrogen prior to data collection.
Data collection, structure determination and refinement
X-ray diffraction data were collected at Beamline 19ID at the Advanced Photon Source (Argonne National Laboratory, Chicago, IL, USA) at a wavelength of 0.9792 Å and at 100 K. Data collection information is reported in Supplementary Table 1. The data were indexed and integrated using HKL300034. Molecular replacement using MOLREP35 with WDR5 (PDB ID 2H9N) resulted in a solution with Contrast of 24.3. This solution was fixed to search for Mb(S4) using a monobody structure with excluded loop regions from the PDB ID 3UYO. The resulting solution had a contrast of 10.9 indicating a definite solution. Iterative model building and refinement were done using the programs COOT36 and PHENIX37. The final structures were analyzed using the programs PROCHECK38 and Molprobity39. The final structural model was of good geometry, with 96% of residues in favored regions and 4% in allowed regions of the Ramachandran analysis. Figures were prepared using PyMOL (Schrödinger).
Retroviral transduction of leukemia cells
Plat-E cells were transfected with pMSCV based vectors encoding DHFR-Mb(S4)-EGFP, DHFR-Mb(S4mut)-EGFP or a no cloned open reading frame (empty vector) using lipofectamine (Invitrogen). The retroviral supernatant was harvested after 48 hours and 72 hours, filtered and added to leukemia cells derived from mouse bone marrow along with 1:1000 polybrene (Millipore). The virus-cell mixture was centrifuged at 3200 rpm for 90 min using a swing-bucket rotor. The cells were then incubated at 37 degrees in a CO2 incubator. To improve the efficiency of transduction, the infection was repeated once. The transduced leukemia cells were selected in the presence of 10 μg/ml Blasticidin. Leukemia cells were cultured in Iscove’s modified Dulbecco’s medium (IMDM) supplemented with 15% fetal bovine serum (FBS) and 0.01 ng/ml interleukin-3 (IL-3) at each passage. To induce monobody expression, 10 μM of trimethoprim was added. The transduced cells were sorted using a FACSAriaTM II (BD Biosciences) to isolate monobody expressing cells.
Binding measurement of the DHFR-Mb-EGFP fusion proteins
HEK293-T cells transfected with the pMSCV-vectors encoding DHFR-Mb(S4)-EGFP or DHFR-Mb(S4mut)-EGFP were grown in the presence of 10 μM TMP, harvested and lysed in 10 mM Tris HCl buffer pH 8.0 containing 420 mM NaCl and 0.1% NP40. The fusion proteins were captured onto DynaBeads M-280 conjugated with biotinylated EGFP-binding monobody23. Binding of WDR5 was measured using the bead-based binding assays33.
Cell growth assay
Transduced leukemia cells were mixed with non-transduced leukemia cells in 1:1 ratio. The mixed cells were grown in IMDM supplemented with 15% FBS and 1x Antibiotic-Antimycotic (Gibco) containing 0.01% DMSO or 10 μM TMP. The cells were passaged every 24 hours. Cells were washed and resuspended in PBS prior to flow cytometry analysis. Similarly, transduced 3T3 cells were mixed with non-transduced cells and grown in High Glucose DMEM supplemented with 10% FBS in multiple wells. For each time point, cells were detached by trypsin, washed and resuspended in PBS. The fraction of monobody-expressing cells was determined by monitoring for GFP and/or mCherry on LSR Fortessa analyzer (BD Biosciences) or Guava easyCyte BGR (Millipore). Data were analyzed with the FlowJo software (Treestar).
RT-qPCR expression analysis
Total RNA was extracted from cells using Trizol and purified using the RNA Clean and Concentrator kit (Zymo Research). For cDNA preparation, we used DNase digested RNA, random hexamer primers and the SuperScript III Reverse Transcriptase (Invitrogen). After the RT reaction, the cDNA was purified using the QIAquick PCR purification kit (Qiagen). The primers used for qPCR were as follows:
HoxA9f – ACACACCTCCACCTGGTCAC
HoxA9r – CCAAAGCCCAGAATTCCTAC
GAPDHf – AAGCCTGCCGGTGACTAAC
GAPDHr – CATCACCCGGAGGAGAAAT
mHoxA9f – CCCCGACTTCAGTCCTTGC
mHoxA9r – GATGCACGTAGGGGTGGTG
mGAPDHf – GGTCGGTGTGAACGGATTTG
mGAPDHr – GTAGACCATGTAGTTGAGGTC
We performed qPCR using the SsoAdvanced Universal SYBR Green Supermix (Bio-Rad), on a CFX384 Touch Real-Time PCR detection system (Bio-Rad).
Western blotting
Western blotting was done according to standard laboratory procedures. Antibodies used were: anti-WDR5 (A302–430A, 1:2000), MLL137, ASH2L (A300–489A, 1:5000), RbBP5 (A300-109A, 1:5000) and anti-Calnexin (H-70, 1:1000). The bands were analyzed using chemiluminiscence on a ChemiDock imager (Bio-Rad). We quantified the band intensities using ImageLab (Bio-Rad), with data normalized based on the Calnexin signal.
Mouse experiments
Forty of 4–6 week old female C57BL/6 mice were randomly grouped into three groups each containing 12 mice, lethally irradiated (900 rads) and transplanted through tail vein intravenous injection with 5x10⁶ MLL-AF9 cells, MLL-AF9+Mb(S4) and MLL-AF9+Mb(S4-mut) cells. Four mice were assigned as radiation control. Two weeks post-transplantation, each group of mice was treated with or without TMS for ten consecutive days. TMS (200mg/ml T: 40mg/ml S per 5ml) was applied twice daily via oral gavages. The mice were monitored for 5 months for signs of acute leukemia. Body weight was monitored daily during the treatment and at least 3 times a week after treatment. Moribund mice were dissected. Spleen and bone marrow cells were harvested and frozen. Leukemia was confirmed based on flow cytometry analysis of leukemia blast cells in spleen, bone marrow and liver as well as by histopathology.
For histopathology detection, tissues were fixed in 10% formalin and submitted for sectioning to the Pathology Cores for Animal Research. Photographs of sections were taken using 2x, 40x and 50x objectives with Olympus BX-51 microscope. Bone marrow cells were isolated by flushing both femurs and tibias with IMDM with 2% FBS. Single cell cytospins were stained with the Giemsa stain.
For the analysis of myeloid cell population in mice, bone marrow cells isolated from transplanted mice or normal mice were prepared as single cell suspensions in flow cytometry buffer (PBS with 1% BSA, 10mM HEPES, 0.01% NaN3), stained on ice with CD11b and Gr-1 antibodies and subjected to flow cytometry analysis. For analysis of leukemia stem cells, Lin− MAF9, MAF9-S4 and MAF9-S4mut (2x10⁶ cells each) were washed with PBS twice and re-suspended in 500μl of PBS. Ninety μl of cell suspension were mixed with 1μg each of FITC conjugated Sca1 antibody (E13–161.7, BioLegend) and APC conjugated c-kit antibody (2B8, BioLegend) separately or in combination, and cells without antibody were used as negative control. After incubating on ice for 30 minutes, 75μl of PBS was added to each well and centrifuged at 400 g for 7 minutes. Samples were washed once with PBS and then fixed in 200μl of 2% Paraformaldehyde and analyzed on a flow cytometer within 24hr.
Colony formation assays and cytospins
Retroviral production and transduction of bone marrow progenitor cells were carried out as described15. Briefly, Plat-E cells were transfected using Fugene 6 with the pMSCV vectors encoding MLL-AF9, DHFR-Mb(S4)-EGFP, DHFR-Mb(S4mut)-EGFP and DHFR-Mb(FNsh)-EGFP as the non-target control. FNsh is a negative control monobody in which all the residues in the BC, DE and FG loops (Supplementary Fig. 1a) are replaced with Ser. After 48 to 72 hr post transfection, the supernatants were collected and used for transduction of bone marrow progenitor cells prepared as follows: 10-week-old C57BL/6 mice were injected intravenously with 5-fluorouracil (150 mg/kg), and bone marrow (BM) progenitor cells were harvested from both femurs at 3 days postinjection. After hematopoietic progenitor enrichment, retroviral supernatant for MLL-AF9 in combination with the retroviral supernatant for DHFR-Mb(S4)-EGFP, DHFR-Mb(S4mut)-EGFP and DHFR-Mb(FNsh)-EGFP were used to co-transduce BM cells by spinoculation. Two days after infection, the infected cells were selected using Blastocidin (10μg/ml) and G418 (1 mg/ml). Two days after selection, infected cells were plated into methylcellulose cultures with or without TMP (10μM). After the third round of plating, cells were collected and subjected to Wright-Giemsa-stained cytospins.
Real-Time PCR and ChIP Assays of mouse bone marrow cells
Primary mouse bone marrow cells were isolated 40 days after transplantation from MAF9-S4, MAF9-S4mut and MAF9 mice treated with or without TMP for 10 days. Cells were harvested by centrifugation at 300g and washed with 1xPBS. RNAs for duplicated biological samples were extracted by a standard protocol. ChIP assays were performed as previously described40. Primers used were:
| RT-PCR | |
| mBcl11a-RT-F | TGGTATCCCTTCAGGACTAGGT |
| mBcl11a-RT-R | TCCAAGTGATGTCTCGGTGGT |
| mEltd1-RT-F | ATGAGACTCCTCCCGCTTCTA |
| mEltd1-RT-R | TTGTGTGTAGGAACAATTCAGCA |
| mProx1-RT-F | AGAAGGGTTGACATTGGAGTGA |
| mProx1-RT-R | TGCGTGTTGCACCACAGAATA |
| mCelf4-RT-F | GCCCCCTTCACATAGAAAACTC |
| mCelf4-RT-R | TGCGCTCCTTGTCAGTGTC |
| mEgr2-F | GCCAAGGCCGTAGACAAAATC |
| mEgr2-R | CCACTCCGTTCATCTGGTCA |
| mHoxa7 RT F | ACTTCTTGCTCCTTTGCACCCAAC |
| mHoxa7 RT R | ATTGTATAAGCCCGGCACAGTGGA |
| mHoxA9-RT-F | AAACAATGCCGAGAATGAGAGCGG |
| mHoxA9-RT-R | AAACTCCTTCTCCAGTTCCAGCGT |
| mDeptorRTF | CCCAAATCTGTGCTGAAGAGACCT |
| mDeptorRTR | GCCTGGATGTGGCATGGTTTACTT |
| mGapdh-f | CCTTCCGTGTTCCTACCC |
| mGapdh-R | CTGCTTCACCACCTTCTTG |
| ChIP PCR | |
| mEgr2-chip-1.5kb-F | ACAGCCCAGACCTGTTCCGTT |
| mEgr2-chip-1.5kb-R | CACTCACGGAAGCTGACTGCC |
| mHoxA7proChIP_kh5-F | AACCCTTCCCCTAAACGCCTC |
| mHoxA7proChIP_kh5-R | AAAAGGTCGCCAGTCTTCCAG |
| mHoxA9proChIP_kh5,3-F | ATCTGTATGCCTAGTCCCGCTCC |
| mHoxA9proChIP_kh5,3-R | TTGATGTTGACTGGCGATTTTC |
| mDeptor-TSS F | GCGGTCAGGAACATGGAAGA |
| mDeptor-TSS R | ATGCGTTCCAGCTCTCTCTG |
| mBcl11a-CHIP-F | ACCTCTCTCCAGGCGGCGTC |
| mBcl11a-CHIP-R | CTCGGGAAACTTTGCCCAGTGA |
| mEltd1-CHIP-F | GTCTGTGTGATTGGCATCCGC |
| mEltd1-CHIP-R | CTTCCCACCCAAAAACTGCGG |
| mProx1-CHIP-F | CTGACACAGATGATGGAGTTC |
| mProx1-CHIP-R | GGTGACTGGTCCTATTGATAC |
| mCelf4-CHIP-F | TCCTACACCTTGCTCTGCTCTG |
| mcelf4-CHIP-R | ACTTGAACCGGTCCAGCCTGT |
Ethical Compliance
This study was performed in compliance with all relevant ethical regulations. All animal experiments in this study were approved by the University of Michigan Committee on Use and Care of Animal and Unit for Laboratory Animal Medicine (ULAM).
Data availability
Atomic coordinates for the WDR5-Mb(S4) structure have been deposited under accession code 6BYN at the Protein Data Bank. The datasets generated during and/or analyzed during the current study are available from the corresponding author on reasonable request.
Supplementary Material
Acknowledgments
We thank J. Andrade and B. Ueberheide (NYU Langone Medical Center) for proteomics analysis; S. Gräslund and C. Arrowsmith (Structural Genomics Consortium) for expression vectors; J. Schmollerl and F. Grebien (Ludwig Boltzmann Institute of Cancer Research) for a retroviral vector and guidance. Research reported in this publication was supported by the National Institutes of Health under award numbers R01 DA036887 and R01 CA194864 (to SK) and R01 GM082856 (to YD). Results shown in this report are derived from work performed at Argonne National Laboratory, Structural Biology Center (Beamline 19ID) at the Advanced Photon Source. Argonne is operated by UChicago Argonne, LLC, for the U.S. Department of Energy, Office of Biological and Environmental Research under contract DE-AC02-06CH11357. The mass spectrometric experiments were supported in part by the Laura and Isaac Perlmutter Cancer Center support grant P30CA016087 from the National Cancer Institute.
Footnotes
Author Contributions
AG, YD and SK designed the study; AG, AK and SK generated monobodies; AG, STT and AK performed binding measurements; AG and SL tested monobody effects on the MLL1 complex; AG and SK determined and analyzed the X-ray crystal structure; AG and KK constructed degron-controlled vectors; AG performed immunoprecipitation experiments; AG and STT performed cell proliferation assays; AG, JX, BZ, MSW, AJR and YD performed transcription and ChIP analyses; AG, JX and BZ performed mouse experiments and histological analyses; AG, YD and SK wrote the manuscript, and all authors commented and approved the manuscript.
Competing Financial Interests
S.K. and A.K. are inventors on patent applications filed by the University of Chicago and Novartis Ag that cover monobody library designs (WO2012016245A3 and equivalent nationalized applications).
References
- 1.Arrowsmith CH, et al. The promise and peril of chemical probes. Nat Chem Biol. 2015;11:536–41. doi: 10.1038/nchembio.1867. [DOI] [PMC free article] [PubMed] [Google Scholar]
- 2.Weiss WA, Taylor SS, Shokat KM. Recognizing and exploiting differences between RNAi and small-molecule inhibitors. Nat Chem Biol. 2007;3:739–44. doi: 10.1038/nchembio1207-739. [DOI] [PMC free article] [PubMed] [Google Scholar]
- 3.Sha F, Salzman G, Gupta A, Koide S. Monobodies and other synthetic binding proteins for expanding protein science. Protein Sci. 2017;26:910–924. doi: 10.1002/pro.3148. [DOI] [PMC free article] [PubMed] [Google Scholar]
- 4.Lawrence HJ, et al. Mice bearing a targeted interruption of the homeobox gene HOXA9 have defects in myeloid, erythroid, and lymphoid hematopoiesis. Blood. 1997;89:1922–30. [PubMed] [Google Scholar]
- 5.Patel A, Dharmarajan V, Vought VE, Cosgrove MS. On the mechanism of multiple lysine methylation by the human mixed lineage leukemia protein-1 (MLL1) core complex. J Biol Chem. 2009;284:24242–56. doi: 10.1074/jbc.M109.014498. [DOI] [PMC free article] [PubMed] [Google Scholar]
- 6.Dou Y, et al. Regulation of MLL1 H3K4 methyltransferase activity by its core components. Nat Struct Mol Biol. 2006;13:713–9. doi: 10.1038/nsmb1128. [DOI] [PubMed] [Google Scholar]
- 7.Cao F, et al. An Ash2L/RbBP5 heterodimer stimulates the MLL1 methyltransferase activity through coordinated substrate interactions with the MLL1 SET domain. PLoS One. 2010;5:e14102. doi: 10.1371/journal.pone.0014102. [DOI] [PMC free article] [PubMed] [Google Scholar]
- 8.Patel A, Vought VE, Dharmarajan V, Cosgrove MS. A conserved arginine-containing motif crucial for the assembly and enzymatic activity of the mixed lineage leukemia protein-1 core complex. J Biol Chem. 2008;283:32162–75. doi: 10.1074/jbc.M806317200. [DOI] [PubMed] [Google Scholar]
- 9.Patel A, Dharmarajan V, Cosgrove MS. Structure of WDR5 bound to mixed lineage leukemia protein-1 peptide. J Biol Chem. 2008;283:32158–61. doi: 10.1074/jbc.C800164200. [DOI] [PubMed] [Google Scholar]
- 10.Song JJ, Kingston RE. WDR5 interacts with mixed lineage leukemia (MLL) protein via the histone H3-binding pocket. J Biol Chem. 2008;283:35258–64. doi: 10.1074/jbc.M806900200. [DOI] [PMC free article] [PubMed] [Google Scholar]
- 11.Dharmarajan V, Lee JH, Patel A, Skalnik DG, Cosgrove MS. Structural basis for WDR5 interaction (Win) motif recognition in human SET1 family histone methyltransferases. J Biol Chem. 2012;287:27275–89. doi: 10.1074/jbc.M112.364125. [DOI] [PMC free article] [PubMed] [Google Scholar]
- 12.Alicea-Velazquez NL, et al. Targeted Disruption of the Interaction between WD-40 Repeat Protein 5 (WDR5) and Mixed Lineage Leukemia (MLL)/SET1 Family Proteins Specifically Inhibits MLL1 and SETd1A Methyltransferase Complexes. J Biol Chem. 2016;291:22357–22372. doi: 10.1074/jbc.M116.752626. [DOI] [PMC free article] [PubMed] [Google Scholar]
- 13.Karatas H, et al. High-affinity, small-molecule peptidomimetic inhibitors of MLL1/WDR5 protein-protein interaction. J Am Chem Soc. 2013;135:669–82. doi: 10.1021/ja306028q. [DOI] [PMC free article] [PubMed] [Google Scholar]
- 14.Senisterra G, et al. Small-molecule inhibition of MLL activity by disruption of its interaction with WDR5. Biochem J. 2013;449:151–9. doi: 10.1042/BJ20121280. [DOI] [PMC free article] [PubMed] [Google Scholar]
- 15.Cao F, et al. Targeting MLL1 H3K4 methyltransferase activity in mixed-lineage leukemia. Mol Cell. 2014;53:247–61. doi: 10.1016/j.molcel.2013.12.001. [DOI] [PMC free article] [PubMed] [Google Scholar]
- 16.Getlik M, et al. Structure-Based Optimization of a Small Molecule Antagonist of the Interaction Between WD Repeat-Containing Protein 5 (WDR5) and Mixed-Lineage Leukemia 1 (MLL1) J Med Chem. 2016;59:2478–96. doi: 10.1021/acs.jmedchem.5b01630. [DOI] [PubMed] [Google Scholar]
- 17.Li DD, et al. High-affinity small molecular blockers of mixed lineage leukemia 1 (MLL1)-WDR5 interaction inhibit MLL1 complex H3K4 methyltransferase activity. Eur J Med Chem. 2016;124:480–489. doi: 10.1016/j.ejmech.2016.08.036. [DOI] [PubMed] [Google Scholar]
- 18.Liu H, Cheng EH, Hsieh JJ. MLL fusions: pathways to leukemia. Cancer Biol Ther. 2009;8:1204–11. doi: 10.4161/cbt.8.13.8924. [DOI] [PMC free article] [PubMed] [Google Scholar]
- 19.Cox MC, et al. Chromosomal aberration of the 11q23 locus in acute leukemia and frequency of MLL gene translocation: results in 378 adult patients. Am J Clin Pathol. 2004;122:298–306. doi: 10.1309/RX27-R8GJ-QM33-0C22. [DOI] [PubMed] [Google Scholar]
- 20.Sorensen PH, et al. Molecular rearrangements of the MLL gene are present in most cases of infant acute myeloid leukemia and are strongly correlated with monocytic or myelomonocytic phenotypes. J Clin Invest. 1994;93:429–37. doi: 10.1172/JCI116978. [DOI] [PMC free article] [PubMed] [Google Scholar]
- 21.Thiel AT, et al. MLL-AF9-induced leukemogenesis requires coexpression of the wild-type Mll allele. Cancer Cell. 2010;17:148–59. doi: 10.1016/j.ccr.2009.12.034. [DOI] [PMC free article] [PubMed] [Google Scholar]
- 22.Grebien F, et al. Pharmacological targeting of the Wdr5-MLL interaction in C/EBPalpha N-terminal leukemia. Nat Chem Biol. 2015;11:571–8. doi: 10.1038/nchembio.1859. [DOI] [PMC free article] [PubMed] [Google Scholar]
- 23.Koide A, Wojcik J, Gilbreth RN, Hoey RJ, Koide S. Teaching an old scaffold new tricks: monobodies constructed using alternative surfaces of the FN3 scaffold. J Mol Biol. 2012;415:393–405. doi: 10.1016/j.jmb.2011.12.019. [DOI] [PMC free article] [PubMed] [Google Scholar]
- 24.Ruthenburg AJ, et al. Histone H3 recognition and presentation by the WDR5 module of the MLL1 complex. Nat Struct Mol Biol. 2006;13:704–12. doi: 10.1038/nsmb1119. [DOI] [PMC free article] [PubMed] [Google Scholar]
- 25.Avdic V, et al. Structural and biochemical insights into MLL1 core complex assembly. Structure. 2011;19:101–8. doi: 10.1016/j.str.2010.09.022. [DOI] [PubMed] [Google Scholar]
- 26.Schuetz A, et al. Structural basis for molecular recognition and presentation of histone H3 by WDR5. EMBO J. 2006;25:4245–52. doi: 10.1038/sj.emboj.7601316. [DOI] [PMC free article] [PubMed] [Google Scholar]
- 27.Li DD, et al. Structure-based design and synthesis of small molecular inhibitors disturbing the interaction of MLL1-WDR5. Eur J Med Chem. 2016;118:1–8. doi: 10.1016/j.ejmech.2016.04.032. [DOI] [PubMed] [Google Scholar]
- 28.Iwamoto M, Bjorklund T, Lundberg C, Kirik D, Wandless TJ. A general chemical method to regulate protein stability in the mammalian central nervous system. Chem Biol. 2010;17:981–8. doi: 10.1016/j.chembiol.2010.07.009. [DOI] [PMC free article] [PubMed] [Google Scholar]
- 29.Koide S. Engineering of recombinant crystallization chaperones. Curr Opin Struct Biol. 2009;19:449–57. doi: 10.1016/j.sbi.2009.04.008. [DOI] [PMC free article] [PubMed] [Google Scholar]
- 30.Spencer-Smith R, et al. Inhibition of RAS function through targeting an allosteric regulatory site. Nat Chem Biol. 2017;13:62–68. doi: 10.1038/nchembio.2231. [DOI] [PMC free article] [PubMed] [Google Scholar]
- 31.Sha F, et al. Dissection of the BCR-ABL signaling network using highly specific monobody inhibitors to the SHP2 SH2 domains. Proc Natl Acad Sci U S A. 2013;110:14924–9. doi: 10.1073/pnas.1303640110. [DOI] [PMC free article] [PubMed] [Google Scholar]
- 32.Nady N, et al. ETO family protein Mtgr1 mediates Prdm14 functions in stem cell maintenance and primordial germ cell formation. Elife. 2015;4:e10150. doi: 10.7554/eLife.10150. [DOI] [PMC free article] [PubMed] [Google Scholar]
- 33.Nishikori S, et al. Broad ranges of affinity and specificity of anti-histone antibodies revealed by a quantitative peptide immunoprecipitation assay. J Mol Biol. 2012;424:391–9. doi: 10.1016/j.jmb.2012.09.022. [DOI] [PMC free article] [PubMed] [Google Scholar]
- 34.Minor W, Cymborowski M, Otwinowski Z, Chruszcz M. HKL-3000: the integration of data reduction and structure solution--from diffraction images to an initial model in minutes. Acta Crystallogr D Biol Crystallogr. 2006;62:859–66. doi: 10.1107/S0907444906019949. [DOI] [PubMed] [Google Scholar]
- 35.Vagin A, Teplyakov A. Molecular replacement with MOLREP. Acta Crystallogr D Biol Crystallogr. 2010;66:22–5. doi: 10.1107/S0907444909042589. [DOI] [PubMed] [Google Scholar]
- 36.Emsley P, Cowtan K. Coot: model-building tools for molecular graphics. Acta Crystallogr D Biol Crystallogr. 2004;60:2126–32. doi: 10.1107/S0907444904019158. [DOI] [PubMed] [Google Scholar]
- 37.Adams PD, et al. PHENIX: a comprehensive Python-based system for macromolecular structure solution. Acta Crystallogr D Biol Crystallogr. 2010;66:213–21. doi: 10.1107/S0907444909052925. [DOI] [PMC free article] [PubMed] [Google Scholar]
- 38.Laskowski RA, Macarthur MW, Moss DS, Thornton JM. PROCHECK: A program to check the stereochemical quality of protein structures. J Appl Cryst. 1993;26:283–291. [Google Scholar]
- 39.Davis IW, Murray LW, Richardson JS, Richardson DC. MOLPROBITY: structure validation and all-atom contact analysis for nucleic acids and their complexes. Nucleic Acids Res. 2004;32:W615–9. doi: 10.1093/nar/gkh398. [DOI] [PMC free article] [PubMed] [Google Scholar]
- 40.Dou Y, et al. Physical association and coordinate function of the H3 K4 methyltransferase MLL1 and the H4 K16 acetyltransferase MOF. Cell. 2005;121:873–85. doi: 10.1016/j.cell.2005.04.031. [DOI] [PubMed] [Google Scholar]
Associated Data
This section collects any data citations, data availability statements, or supplementary materials included in this article.
Supplementary Materials
Data Availability Statement
Atomic coordinates for the WDR5-Mb(S4) structure have been deposited under accession code 6BYN at the Protein Data Bank. The datasets generated during and/or analyzed during the current study are available from the corresponding author on reasonable request.