Abstract
Behavioral phenotyping is a crucial step in validating animal models of human disease. Most traditional behavioral analyses rely on investigator observation of animal subjects, which can be confounded by inter-observer variability, scoring consistency, and the ability to observe extremely rapid, small, or repetitive movements. Force-Plate Actimeter (FPA)-based assessments can quantify locomotor activity and detailed motor activity with an incredibly rich data stream that can reveal details of movement unobservable by the naked eye. This report describes four specific examples of FPA analysis of behavior that have been useful in specific rat or mouse models of human neurological disease, which show how FPA analysis can be used to capture and quantify specific features of the complex behavioral phenotypes of these animal models. The first example quantifies nociceptive behavior of the rat following injection of formalin into the footpad as a common model of persistent inflammatory pain. The second uses actimetry to quantify intense, rapid circling behaviors in a transgenic mouse that overexpresses human laminin α5, a basement membrane protein. The third example assesses place preference behaviors in a rat model of migraine headache modeling phonophobia and photophobia. In the fourth example, FPA analysis revealed a unique movement signature emerged with age in a digenic mutant mouse model of Tourette Syndrome. Taken together, these approaches demonstrate the power and usefulness of the FPA in the examination and quantification of minute details of motor behaviors, greatly expanding the scope and detail of behavioral phenotyping of preclinical models of human disease.
Keywords: Force-plate Actimeter, locomotion, tremor, open field, migraine, laminin
1.1 Introduction
Behavioral phenotyping comprises the basis of perhaps the most fundamental features of the validation of animal models of human disease. Many of the inroads in the effective use of rodent models of disease and the development of therapeutic interventions have relied upon straightforward observation of changes in the behavioral repertoire of a subject exposed to various stimuli, physiological modifications, or drugs. In rodent models of human disease, if a genetic variant or environmental perturbation (typically neurological) is responsible for behavioral dysfunction, then a rodent model incorporating the variant or perturbation should display corresponding behavioral changes. The use of standardized, robust behavioral analyses of the mutant mouse can assess whether specific alterations lead to disease-relevant phenotypes. Many disorders in humans, particularly those of the nervous system, are associated with deficits in cognitive, sensory, motor, or social aspects of behavior. Behavioral screening using a battery of well-defined tests can help determine whether the rodent model displays behavioral features similar to the human disease. In such tests, the face validity of rodent models has been largely dependent on the similarity of the subject’s movement and actions as reflecting the human condition. While many of the simplest and most hardy behavioral phenotyping approaches have relied on straightforward investigator observation of the animal subjects’ behavior, this approach can be significantly compromised by inter-observer variability, scoring consistency, and the ability to observe extremely rapid, small, or repetitive movements. Accordingly, many useful refinements in behavioral phenotyping have emerged through development of apparatus to objectively and quantitatively measure specific aspects of rodent behavior.
Many common tests of general locomotor activity are based on observation of the subject’s movements when placed in a novel open arena. Rodents have a natural drive to explore new surroundings, and this can be leveraged to assess patterns of movement such as total distance traveled, rearing, circling, bouts of low motility, and stereotypic behaviors (e.g., grooming). Open-field arenas for rodents can be circular or square, and are typically divided into sub-areas to facilitate observation of the patterns of movement around the arena.
Automated recording and measurement of locomotor activity can be accomplished using apparatus that record rodent movement through breakage of photocell beams, electromagnetic detection, or video tracking software (Grusser and Grusser-Cornehls 1998, Drai, Kafkafi et al. 2001, Thifault, Lalonde et al. 2001). Some of these technologies can be adapted to home cages instead of novel test arenas; this avoids anxiety-evoked thigmotaxis, but this loses the advantage of evoking locomotion by exposure to a novel environment. A distinct advantage of automated systems includes labor-reducing standardization of objective, unbiased quantification and recording of locomotion, and multiple options regarding data analysis. Apparatus such as the force-plate actimeter can also be enclosed in a sound-attenuating, opaque chamber, which removes the impact of observer presence altogether (Chesler, Wilson et al. 2002).
1.1.1 Force-plate Actimetry
Detailed analysis of locomotor activity, exploratory behaviors, stereotypy, tremor and ataxia are facilitated by apparatus such as the BASi Force-Plate Actimeter (FPA) (Bioanalytical Systems, Inc., Mount Vernon, IN), which provides a very rich data stream that records and quantifies minute details of movement. The actimeter arena consists of a square, stiff horizontal plate (42 cm × 42 cm) attached at the corners to force transducers that record the center of mass (X,Y position) of the animal subject. A Plexiglas enclosure rests a few millimeters above the plate to create a transparent enclosure (Figure 1). Animals are placed into the testing arena and allowed to move freely for the testing period (as little as 10 minutes for initial screening purposes, but potentially for hours-long assessment). When the test subject moves on the plate, its movements are sensed by the transducers, whose signals are processed by a computer to detect and score a wide range of behaviors or behavioral attributes, including behavioral events occurring at user-defined frequencies or amplitudes. These include, but are not limited to, stereotypies, tremor, startle, or ataxia. The actimeter simultaneously records larger movements such as locomotion (with mm scale resolution) and fine movements (with frequency resolution up to 100 Hz). Analysis of the data gathered during this time reveals several parameters such as total distance traveled (a sum of X,Y deflections of the center of mass over time; includes both large and small movements), area travelled (a two-dimensional integration of X,Y deflections over time), bouts of low mobility (periods when the X,Y position remains within a defined small area over a period of time, typically 10 sec), focused stereotypies (an area-partitioned variance of total force deflections over time), left and right turns, and other aspects of both general locomotion and small body movements, including very small movements like whisking (active sweeping movements of the vibrissae that provide sensory input), respiration, and even heart beat (Fowler, Birkestrand et al. 2003, Crosland, Zarcone et al. 2005, McKerchar, Zarcone et al. 2006, Smittkamp, Brown et al. 2008, Fowler, Zarcone et al. 2010). This apparatus has been particularly useful in analyzing rotational behaviors, inherent or drug-evoked tremor, and seizure-like activity in rodents (Fowler, Miller et al. 2009). This is accomplished via decomposition of the force-time data gathered by the FPA using a mathematical Fourier transformation into a quantification of the power of movements as a function of frequency (Fowler, Miller et al. 2009), which conceptually would be similar to evaluating the volume of individual notes in a musical chord. Typical frequencies of normal rat behavior include licking (4–7 Hz), respiration (1–2 Hz), heartbeat (6–8 Hz), and whisking (8–25 Hz; (Deschenes, Moore et al. 2012)). Locomotion is typically large amplitude and very low frequency (< 2 Hz).
Figure 1.
The BASi Force-Plate Actimeter modified for simultaneous video capture. In this modification, three sides of the Actimeter have been modified with mirrors to facilitate an unimpeded view of the behavioral area by a CCD camera that captures video of the subject. Force transducers capture high resolution information about the center of force and its magnitude and movement (noted in Figure 2).
1.1.2 Preclinical rodent models of human disease
The first example uses a common model of persistent inflammatory pain: injection of formalin into the rat footpad. In this experiment, the behavioral responses of rats were quantified using the FPA, resulting in much greater detail than possible counting hind limb flinches. The formalin test is an established, widely used model of persistent inflammatory pain (Tjolsen, Berge et al. 1992, Porro and Cavazzuti 1993). This model is usually used in mice and rats, and may provide a better approximation of clinical chronic pain than traditional phasic nociceptive tests, such as acute radiant thermal, hot-plate, or mechanical paw withdrawal tests. Formalin induces a biphasic pain-related behavioral response, separated by a quiescent interphase. The first (early) phase is due to C-fiber activation, while the second (late) phase is due to peripheral inflammation and central sensitization. The behavioral responses that can be evaluated include lifting (flexing), licking, biting, and flinching of the injected paw. The flinching response seems to be a consistent component of the response, and is easy to observe and quantify. The other behavioral responses have been more problematic, and it has been suggested that flinching is less influenced by conditions that affect non-nociceptive behavior, and, thus, is a better end-point (Tjolsen, Berge et al. 1992). In the experiments used in this report as an example of actimetry, intensity of nociceptive behaviors evoked by formalin were measured to provide a quantitative means for subsequently assessing their modification by acute, activational effects of estrogen (Ralya and McCarson 2014).
The second example uses actimetry to quantify intense circling behaviors in a transgenic mouse that overexpresses human laminin α5, which is a basement membrane protein. In this model, a bacterial artificial chromosome containing a portion of human chromosome 20 including the entire laminin α5 gene was phenotyped. Laminin α5 is required for kidney glomerular basement membrane assembly, but is also found in vascular basement membranes located throughout much of the body, including the CNS. The hemizygous transgenic mice display normal kidney function with little or no urinary albumin as assessed by ELISAs, normal blood urea nitrogen levels, and normal ultrastructure of the kidney GBM (Steenhard, Zelenchuk et al. 2011). However, the homozygous mice also displayed a robust, hyperlocomotive circling behavior far too rapid to quantify (or even observe clearly) with traditional scoring approaches. The behavioral phenotype of the transgenic mice was assessed through a battery of common tests as well as analyses of locomotor activity using a FPA.
The third example shows the utility of modification of the force-plate actimeter to assess place preference behaviors in a rat model of migraine headache. In this case, the Lucite cover over the FPA was redesigned to allow the rat to choose between dark/bright or loud/quieter zones of the plate, allowing quantification of time spent in each zone while allowing the simultaneous assessment of other movement phenotypes (Vermeer, Gregory et al. 2014). Studies of migraine pathogenesis have fallen behind other areas of pain research because of the lack of an adequate rodent behavioral model. Animal models of migraine have been hampered by limitations that reduce their face validity, such as electrophysiological end points that do not encompass nociceptive behaviors(Burstein and Jakubowski 2004, Oshinsky and Luo 2006), or behavioral models that rely on orofacial testing of restrained subjects(Oshinsky and Gomonchareonsiri 2007, Wieseler, Ellis et al. 2010, Stucky, Gregory et al. 2011). Most animal studies of migraine have used electrophysiological techniques to assess sensitization of neurons, but none have specifically tested behaviors associated with the clinical criteria for diagnosing migraine in humans(2004). In clinical assessment, migraine headache must be accompanied by phonophobia or photophobia(2004). The rodent model in these studies uses application of “inflammatory soup” to the dura of untethered, conscious, behaving rats as a model of sterile inflammation caused by neurogenic activation of mast cell degranulation(Burstein, Yamamura et al. 1998, Burstein and Jakubowski 2004, Stucky, Gregory et al. 2011, Vermeer, Gregory et al. 2014, Vermeer, Gregory et al. 2015). The previously unparalleled face validity of this preclinical rodent migraine model may provide a means for more detailed and predictive testing of novel therapeutic interventions for migraine.
In the fourth example, FPA analysis was used to identify a band of repetitive movements that emerge with age in a digenic mutant mouse model of Tourette Syndrome. This experiment leveraged human genetic information from Dr. Sarah Soden ‘s efforts at Children’s Mercy Hospital (Kansas City)(Soden, Saunders et al. 2014), that described a family with a father and three affected sons. Through whole exome sequencing a mutation was found in the coding region of the nerve growth factor-related receptor tyrosine kinase-like WNT receptor 1 (ROR1) gene. An additional variation in these patients was identified in the nerve growth factor (NGF) gene. NGF is a neurotrophic factor essential for the survival and maintenance of numerous types of neurons in the peripheral and central nervous systems (Levi-Montalcini 1987, Pezet, Krzyzanowska et al. 2006, Reichardt 2006). We hypothesized that impaired NGF expression or loss of signaling by NGF in conjunction with altered ROR1 function could provide a basis for the behavioral phenotypes observed in the affected patients.
These four experimental examples of the assessment of movement have been useful in helping define the specific rat or mouse models of human disease. The focus of this report does not concern the underlying pathophysiological details of the rodent models used, but rather the many ways that FPA analysis can be used to capture and quantify specific features of the complex behavioral phenotypes of these animal models.
2.1 Materials and Methods
The behavioral phenotyping aspects of the experiments described in this report were conducted or supervised as activities of the University of Kansas Rodent Behavior Facility and the Kansas Intellectual and Developmental Disorders Center at the University of Kansas. All the experimental assays and manipulations were approved by the University of Kansas Medical Center Institutional Animal Care and Use Committee and conducted according to the Institute of Laboratory Animal Research guidelines. Animal husbandry, care and use activities were conducted in facilities and using procedures consistent with the AAALAC Guide for Care and Use of Laboratory Animals.
2.1.2 Formalin-evoked nociceptive behaviors
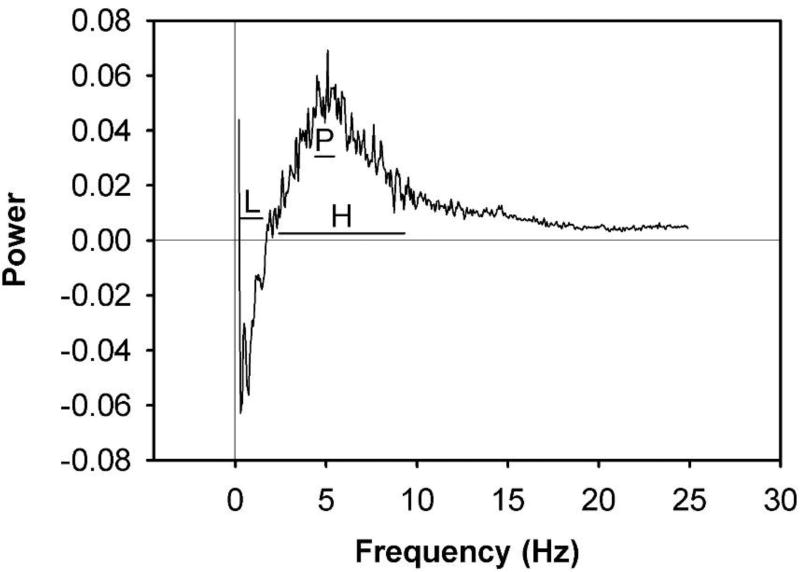
Adult female Sprague-Dawley rats (~11 weeks old, 200–230 g, Harlan, Indianapolis, IN) were used in these experiments. The rats were ovariectomized as previously described (Allen and McCarson 2005) for a period of one week before nociceptive behavioral testing, but received no further manipulation. Seven days after ovariectomy, rats received a unilateral injection of 100 µL of 5% formalin into the plantar hind paw as a model of persistent inflammatory pain (Dubuisson and Dennis 1977, McCarson and Goldstein 1989, Winter and McCarson 2005). Spontaneous hind paw flinches were quantified post-injection. Behavioral responses were recorded for one hour before, and for one hour immediately after formalin injection. Detailed recordings of the rats’ movements were collected during these periods using an FPA. Force-plate actimetry data were collected, and distance metrics and frequency spectra power analyses performed, using FPA analysis software provided by the manufacturer (Bioanalytical Systems, Inc.). Three categories of frequency band (range) were empirically designated for the power spectra, based on transitions and peaks within the difference power spectrum of 5% formalin. The frequency band designations were: Low: 0.3–1.5 Hz; Peak: 4.4–5.4 Hz; High: 2.4–9.3 Hz. Frequency/power data were exported to Microsoft Excel to compile group values, for analysis of power spectra within selected frequency bands, and for general statistical analyses and plotting. All data represent the mean ± SEM. Data were analyzed by Student’s t-test or ANOVA statistical analyses with the significance level set to p ≤ 0.05.
2.1.3 Hyperlocomotion and circling behaviors
To study the regulation of the laminin α5 gene expressed in adult basement membranes, a transgenic mouse was created with an insertion bacterial artificial chromosome (BAC) containing the complete laminin a5 gene. Transgenic mice expressed human laminin α5 in locations where mouse laminin α5 is normally expressed, including kidney glomerular basement membrane (Steenhard, Zelenchuk et al. 2011). Behavioral analyses were performed on male and female homozygous, heterozygous , and wild-type littermate mice from multiple litters at five, seven and twelve weeks of age. All behavioral tests were conducted between 0800 and 1400 on a single day for each age time point. The FPA was used to measure locomotor function along with a wide range of locomotor behaviors. Mice were placed into the testing arena and allowed to move freely for 10 minutes. During this time, the actimeter recorded several parameters such as total distance traveled, area travelled, bouts of low mobility, focused stereotypies, and left and right turns.
2.1.4 Photophobia and Phonophobia
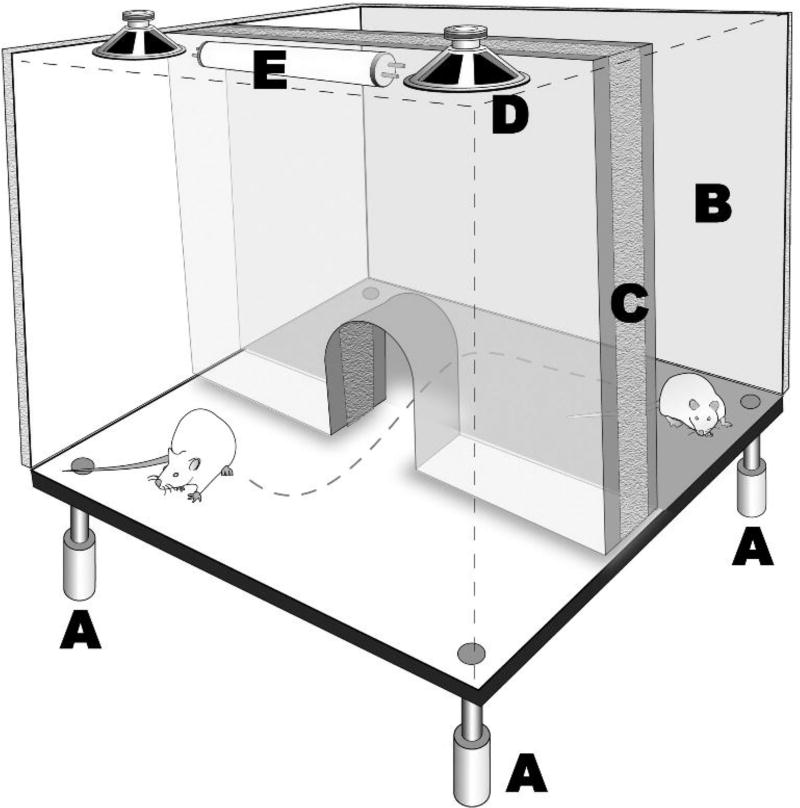
Female Sprague-Dawley rats were fitted with an indwelling dural cannula placed over the occipital cortex. Briefly, a plastic cannula was secured to the skull using a stereotactic apparatus and under isoflurane anesthesia. The cannula was placed on the right side 5 mm lateral to midline and halfway between the bregma and lambda over the occipital lobe to model unilateral migraine. Baseline behavioral testing was conducted prior to surgery and 7 days post-surgery. In all subsequent behavioral assays, the observer was blind to treatment group. Groups of rats were then treated with a widely-used dural stimulation model of migraine headache; application of 20 µl of an inflammatory soup (IS) containing 1mM histamine, serotonin, bradykinin and 0.1 mM PGE2 (Stucky, Gregory et al. 2011). Chronic migraine was modeled by repeated application of inflammatory soup 3 times per week over a total of 8 applications. Behavioral testing was conducted during and after dural stimulation in a modified FPA apparatus, providing detailed, quantitative measurements of locomotor activity. The actimeter was fitted with a light/dark place preference enclosure with sound attenuation, allowing measurement of movement patterns of the rat to avoid light or sound (Figure 2). Previous results have shown that female rats exhibit attenuated locomotor activity following dural stimulation, indicating avoidance of normal exploratory activity (Stucky, Gregory et al. 2011, Vermeer, Gregory et al. 2014, Vermeer, Gregory et al. 2015). Following infusion of the dural stimulus while in the behavioral chamber, conditions in the behavioral arena, rats were given a 5-minute exploratory time in the divided arena with no external light or noise stimuli. After 5 min, the light side of the chamber was illuminated to 250 lux. The rat could freely choose to explore light and dark areas for 5 minutes. Subsequently, the light was turned off and the animal allowed to rest in the absence of light for 5 minutes. Phonophobia tests were conducted using an enclosure with loud (75 dB) and sound-attenuated chambers in a similar place-preference design.
Figure 2.
Behavioral testing arena for assessment of photophobia and phonophobia. Apparatus is a modified Force-Plate Actimeter (BASi) fitted with a light/dark place preference enclosure. The “dark” side features opaque walls and sound attenuation; the “light” side has lamps and speakers that provide computer-controlled delivery of stimuli. The actimeter floor allows precise measurement of locomotor activity and movement patterns of the rat to avoid intense light or sound. In the migraine model, after infusion of the dural stimulus (while the subject is in the behavioral chamber) conditions in the behavioral arena were modified in five-minute periods with 1) no external light or sound, 2) illumination of one side of the chamber to 250 lux, 3) no external light or sound, and 4) 75 dB white noise delivered to one side of the chamber. A: Force transducers. B. Sound-attenuated, dark side of divided chamber. C. Opaque insulating material used to cover all sides of B. D. Speakers for delivery of audio stimuli. E. Lamp for illumination of one side of the arena.
2.1.5 Repetitive movement signatures
Mouse models of Ngf and Ror1 missense variants were produced via gene targeting in mouse embryonic stem cells (Ngf) or via CRISPR/Cas9 genome editing in vivo (Ror1). The mutated strains were intercrossed to produce double heterozygous animals that are fertile with no health or gross morphologic features. This approach has created mouse lines with mutations of the Ror1 and Ngf genes harboring the relevant variants identified in the human cases. Preliminary assessment of the Ror1/Ngf mutant strains was conducted in a small cohort of 15 mice. Group numbers ranged from n=1 to 4 (only 2 Ror1/Ngf double-het males). Animals were followed for 44 weeks and tested on a variety of tasks, including thermal analgesiometry, Rota-Rod, Y-maze and force-plate actimetry. Like the other examples, the FPA was used to measure locomotor behaviors. Mice were placed into the testing arena and allowed to move freely for 10 minutes. During this time, the actimeter recorded several parameters such as total distance traveled, area travelled, bouts of low mobility, focused stereotypies, and left and right turns. In the analysis of these data, the mice were compared in terms of rhythms in force variation produced by ambulation or other fine movements (e.g., stereotypy or tremor). The total vertical force/time were weighted by a Hanning data window and processed using the FPA Analysis software (BASi, West Lafayette, IN) using fast Fourier transformation to yield power spectra of movement intensity across frequency (Hz).
3.1 Results
3.1.1 Formalin-evoked nociceptive behaviors
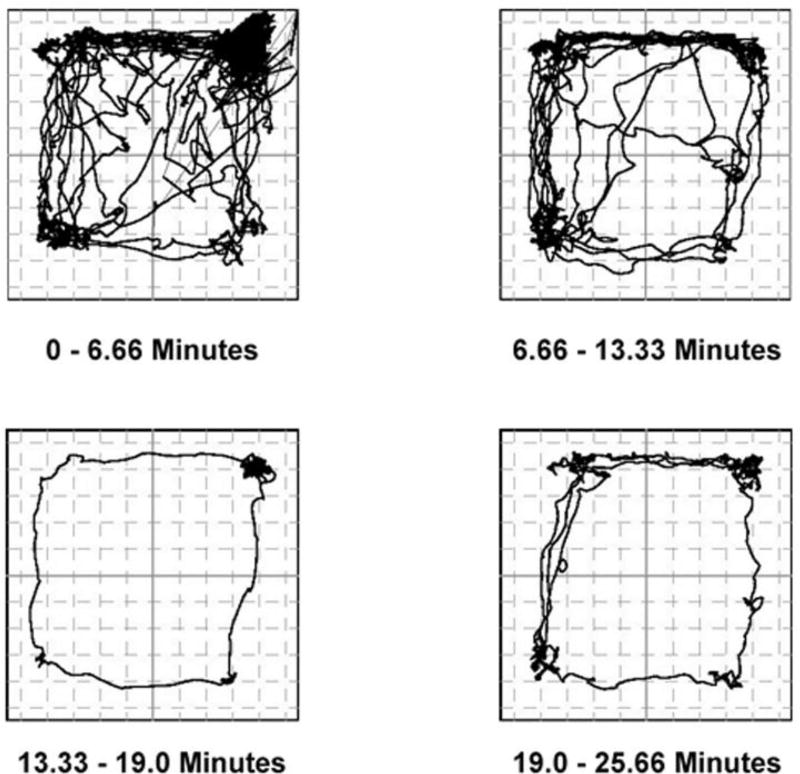
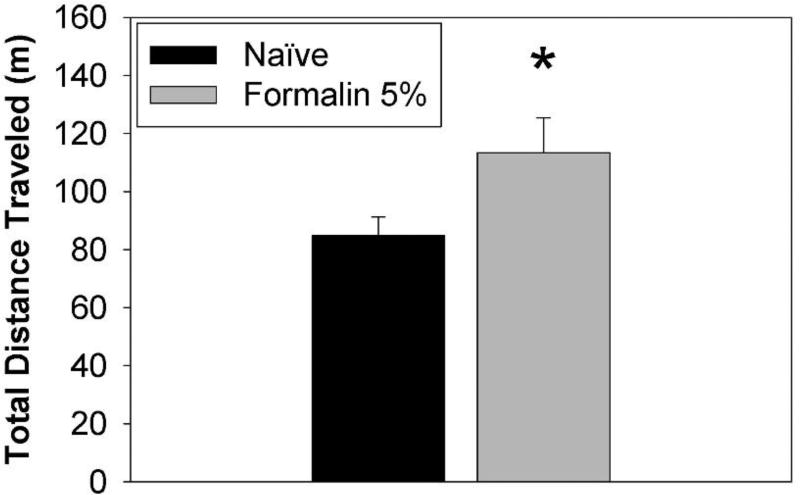
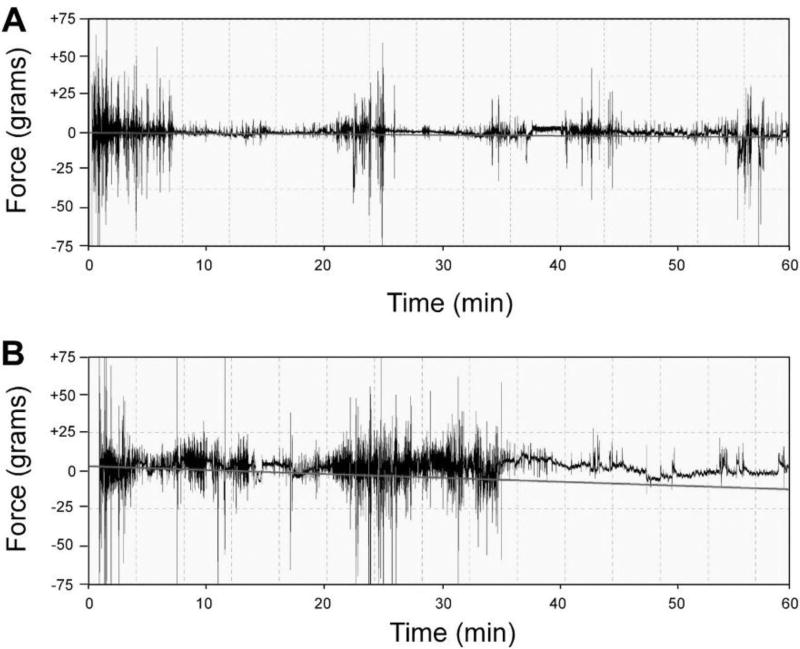
In a time-course experiment addressing the behavioral effects of injection of 5% formalin into the hind paw of female rats, nociception-evoked paw flinches were quantified 0–60 minutes post-injection. The number of flinches recorded by an observer were in accordance with previously published time courses of flinching behavior following formalin injection (Tjolsen, Berge et al. 1992) and demonstrated a typical biphasic response (data not shown). Locomotor analysis using the FPA revealed more detailed results. Figure 3 shows representative spatial plots from FPA force/time recordings of female rats over a one-hour testing period. These data demonstrate movement of the rats across the force plate arena and that movement changed over time. Integration of movement across the (X, Y) coordinates of the force plate grid provides the basis for the analysis of total distance traveled. Analysis of total distance traveled from FPA recordings was performed, revealing that 5% formalin-treated (n = 6) rats had higher total distance traveled over Naïve (n = 6) rats (Figure 4, Student’s t-test). Figure 5 shows representative force/time recordings from rats that were either naïve or injected with 100 µL 5% formalin into the left hind paw, then placed in the FPA for one hour. These force/time traces demonstrate activity of the rats and that the force on the plate changed over time as the subject manifested either restricted body movements (such as grooming) or moved about the behavioral arena (such as locomotion). These temporal patterns of force on the FPA floor are related to the specific patterns of movement that comprise behavior, and are the basis for Fourier-transformation of the data into frequency/power spectra.
Figure 3.
Representative example of recordings of position/time data of a naïve female rat‥ Data were collected using a BASi force-plate actimeter. Analyses of total distance traveled was calculated based on the change in position of the center of force recordings over time. Note that the position traces reflect the initial exploratory behavior in the force-plate arena, which generally diminishes over time, with alternating periods of locomotion and rest.
Figure 4.
Analysis of total distance traveled from FPA force/time recordings of female rats following hind paw injection of 5% formalin. Rats were either naïve or injected with 100 µL 5% formalin into the right hind paw, and were placed in the FPA for one hour. Results revealed 5% formalin-treated (n = 6) rats had higher total distance traveled compared to Naïve (n = 6) rats. Data represent the mean ± SEM (*Student’s t-test [t(10)=3.42, p = 0.038]). Subjects in the Naïve and Formalin groups were the same rats, which were monitored in the FPA first without formalin (Naïve) then after formalin injection (Formalin). Rats had not been previously acclimated to the FPA environment.
Figure 5.
Representative FPA force/time recordings for rats without or with formalin injection. These are representative force/time recordings from rats that received either A) sham restraint or B) injection of 100 µL of 5% formalin into the left hind paw and then placed in the FPA for one hour. Movement of the formalin-injected subjects in panel B reflect the typical biphasic behavioral response of rats in the formalin test, with periods of brisk nociceptive behaviors in the 0 – 10 min and 20 – 40 min time windows.
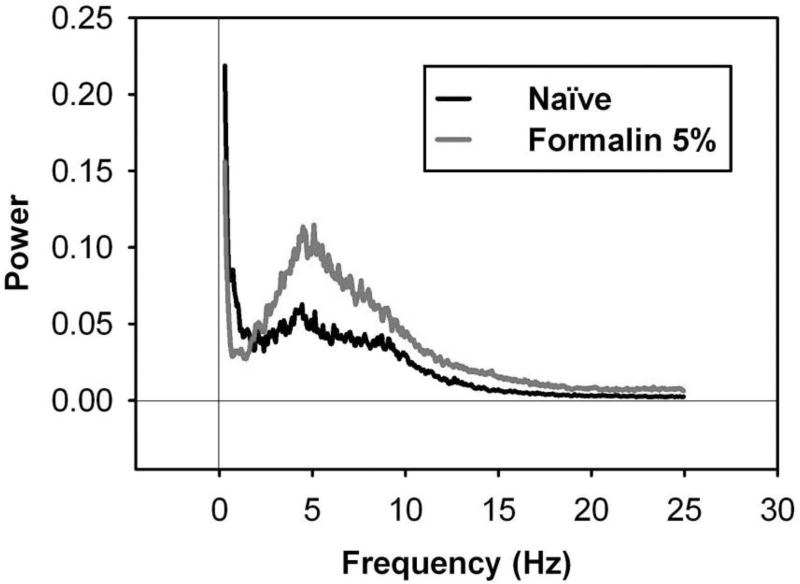
Figure 6 shows Fourier-transformed power spectra of FPA force/time recordings of female rats that were either naïve or injected with 100 µL of 5% formalin into the left hind paw, then placed in the FPA open field for one hour. Results revealed different power spectra for Naïve (n = 6) and 5% formalin-treated (n = 6) rats.
Figure 6.
Fourier-transformed power spectra of FPA force/time recordings of female rats following hind paw injection of 5% formalin. Fourier analysis assesses force/time data such as those displayed in Figure 5 and coverts them into a representation of the rhythmicity (Hz) of the movements captured by the FPA. Rats were either naïve or injected with 100 µL 5% formalin into the left hind paw, then were placed in the FPA for one hour. Results revealed `different power spectra for Naïve (n = 6) and formalin-treated (n = 6) rats. Data represent mean power spectra across the entire 60 min testing period.
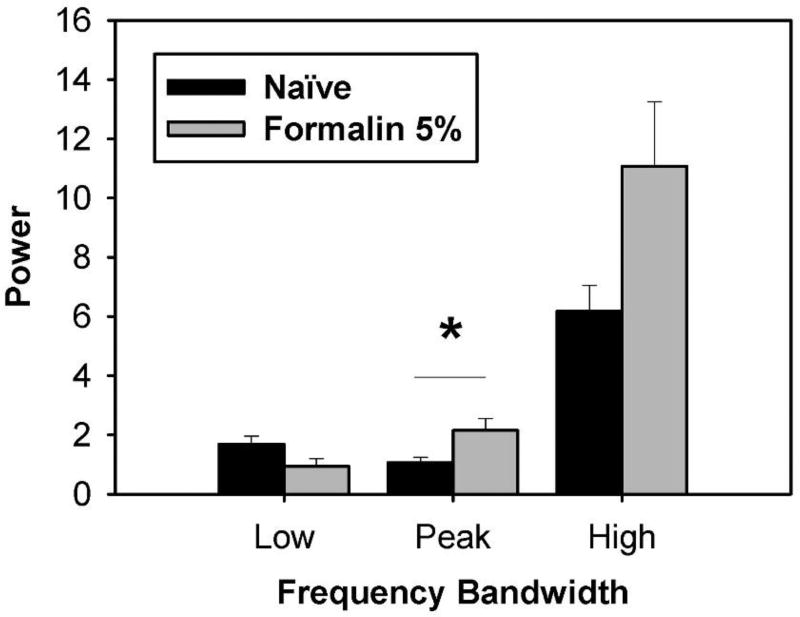
To visualize and quantify the components of nociceptive behavior that emerge beyond typical locomotor and stereotypic behaviors, the mean power spectrum for naïve (n = 6) rats was subtracted from that of 5% formalin-treated (n = 6) rats. Results revealed a difference power spectrum with relative larger magnitudes at some frequencies than those at 5% formalin (Figure 7). Results for 5% formalin revealed a difference in power for Sham (n = 6) vs. formalin-treated (n = 6) rats at the Peak frequency band (Figure 8), but not in the Low or High frequency bands (Student’s t-test). These data demonstrate that 5% formalin induced an increase in nociception-evoked movements that is represented by power in a 4.4–5.4 Hz frequency band.
Figure 7.
Fourier-transformed difference power spectrum of FPA force/time recordings of female rats following hind paw injection of 5% formalin. Rats were either naïve or injected with 100 µL 5% formalin into the left hind paw, then were placed in the FPA for one hour. The mean power spectrum for Naïve (n = 6) rats was subtracted from that of formalin-treated (n = 6) rats. Results revealed a differential power spectrum with potentially significant magnitudes. Data represent the mean power spectrum. For more detailed analysis of this difference in movement power, frequency bands of the power spectra were designated and are superimposed on the difference power spectrum of 5% formalin. Horizontal lines represent frequency band (range) designations of the power spectrum. The frequency band designations are: Low (L): 0.3–1.5 Hz; Peak (P): 4.4–5.4 Hz; High (H): 2.4–9.3 Hz.
Figure 8.
Analysis of movement power across frequency bands in rats following 5% formalin. Power spectra were summed over the frequency bands designated in Figure 7. Results revealed a difference in power for Sham (n = 6) vs. formalin-treated (n = 6) rats at the Peak (4.4–5.4 Hz) frequency band, but not at the Low (0.3–1.5 Hz) or High frequency (2.4–9.3 Hz) band. These data suggest 5% formalin induced an increase in movements that are represented by power in the Peak frequency band. Data represent the mean ± SEM (*p ≤ 0.05, unpaired Student’s t-test).
3.1.2 Hyperlocomotion and circling behaviors
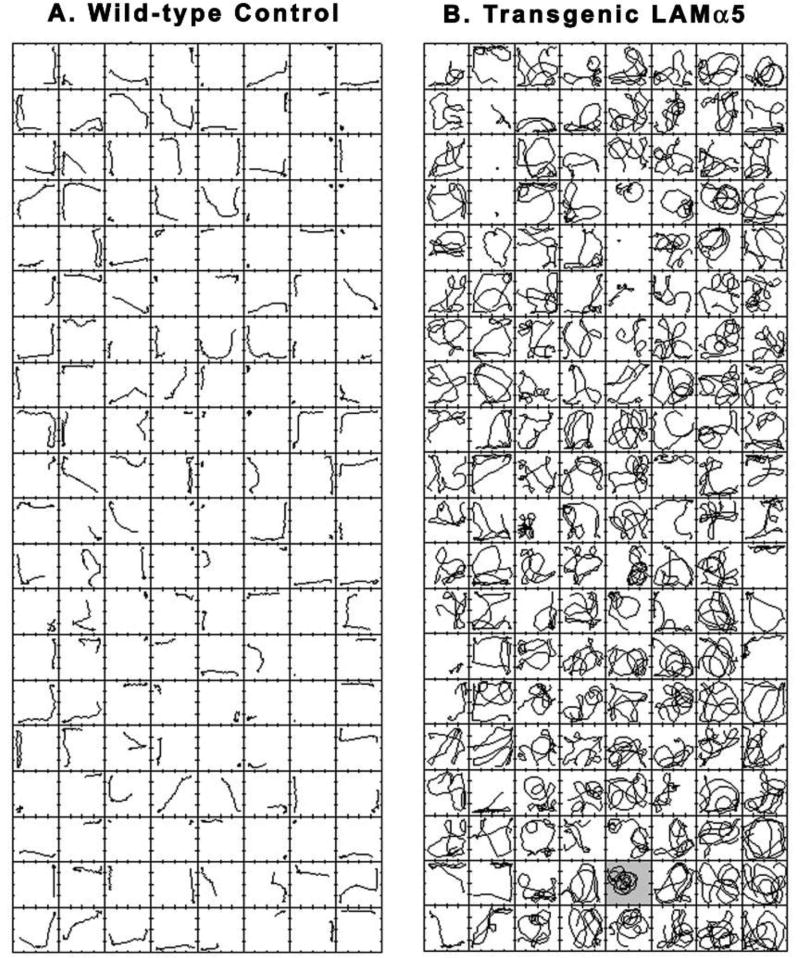
When hemizygous human α5 laminin transgenic mice were mated, the homozygous progeny were significantly smaller, displayed altered tail suspension reflex and an abnormal circling behavior. The homozygous transgenic mice overexpress the human laminin a5 gene, downregulating corresponding murine laminin a5 gene expression and murine protein content in kidney(Steenhard, Zelenchuk et al. 2011); similar expression patterns may exist at other anatomic sites not yet determined. The homozygous α5 laminin transgenic mice were small in body weight, approximately 70% of WT littermates, but had normal grip strength/body weight ratios. The behavioral phenotype was most extreme in HZ mice, and generally became more severe as the mice matured. The homozygous mice displayed a profound behavioral phenotype with overt hyperlocomotion and circling behaviors. Wall-rearing and bouts of low mobility were diminished. The hyperactivity of the transgenic mouse was expressed as almost continuous high-speed, circular locomotion (Figure 9) characterized by both broader and tighter circular loops (Figure 10) that could occur anywhere on the actimeter floor. The circling movements were extremely rapid, with oscillating diameters comprising a continuous spiral with variable centers (Figure 10). The wild type mouse was normoactive, and its movement trajectories reflected runs and pauses with more movements along walls than across the center of the chamber and relatively few rapid reversals of direction (Figure 9).
Figure 9.
Comparison of a WT mouse (A) and a homozygous transgenic laminin α5 mouse (B). The mice were 12 weeks old at the time of this assay. The hyperactivity of the transgenic mouse was expressed as almost continuous high-speed locomotion characterized by both broader and tighter circular loops that could occur anywhere on the actimeter floor. The wild type mouse was normoactive, and its movement trajectories reflected runs and pauses with more movements along walls than across the center of the chamber and relatively few rapid reversals of direction. Each square represents the floor of a 42 × 42 cm actimeter and contains the center of force movement trajectory for 7.5 seconds. Time advances from top to bottom and from left to right (i.e., the top of column 2 picks up where the bottom of column 1 left off). Total recording session time was 20 minutes. Figure 10 is an enlarged image of frame 99 for the homozygous transgenic mouse (B, shaded frame).
Figure 10.
This 7.5-second-long movement trajectory shows continuous locomotion by a homozygous transgenic laminin α5 mouse from frame 99 in Figure 9. The recording is divided into 5 color-coded segments, each lasting 1.5 seconds (see right side of graphic). The whole sequence of movements from t = 0 to t = 7.5 seconds can be described as “high speed nearly circular loops of oscillating diameters comprising a continuous spiral with variable centers.” It should be noted that all turns were to the left. The CNS mechanism responsible for this pattern of behavior remains to be elucidated, but may reflect behavior occurring at a rate of expression that is too high to be under feedback control of sensory stimuli.
3.1.3 Photophobia and Phonophobia
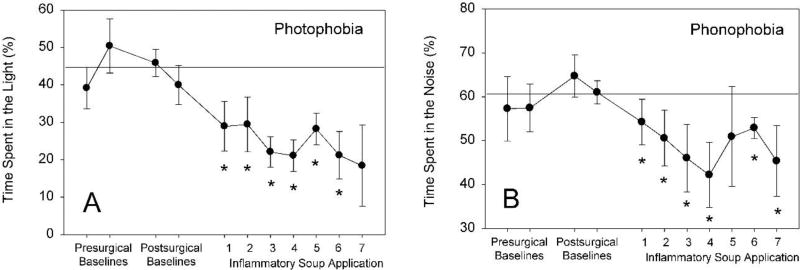
Female rats with indwelling dural catheters received stimulation of the dura with Inflammatory soup eight times over a sixteen-day period. After inflammatory soup infusion onto the dura, rats were placed in the modified FPA that measured locomotion and place preference. Following illumination of one chamber with a 250-lux lamp, rats spent progressively, and significantly less time in the light stimulus side after dural stimulation when compared to pre-treatment baselines during a ten-minute testing period (Figure 11, panel A). Similarly, when a 75 dB white noise was emitted from the internal speakers, rats showed significant sound aversion compared to pre-treatment baselines, spending progressively less time in the sound-stimulus side of the place preference chamber (Figure 11, panel B).
Figure 11.
Dural stimulation results in place-preference photo- and phonophobia. Baseline behaviors were assessed one and two days prior to surgery and 7 and 8 days post-surgery; the horizontal line represents the grand mean of pre- and post-surgical baseline behaviors with no dural stimulation. Dural stimulation with inflammatory soup occurred eight times over a sixteen-day period (every two or three days). Rats were introduced to the divided arena 15 minutes after inflammatory soup application, and were able to freely move in the arena for a total of 170 minutes. The first 5 min of exposure in the arena was in the absence of stimuli, the second 5 min period was in the presence of either light (250 lux), and then 5 min of noise (75 dB) present on only one side of the divided chamber, with a 2 min dark rest period between stimuli. Percentage of time in each side of the arena during the presentation of stimuli was calculated using fully automated BASi FPA Analysis software. Note subsequent applications of inflammatory soup to the dura decrease the amount of time spent in the light (A) or noisy (B) side of the chamber (* p<0.05 compared to baseline, ANOVA, Dunnett’s post-hoc; n=3–8).
3.1.4 Repetitive movement signatures
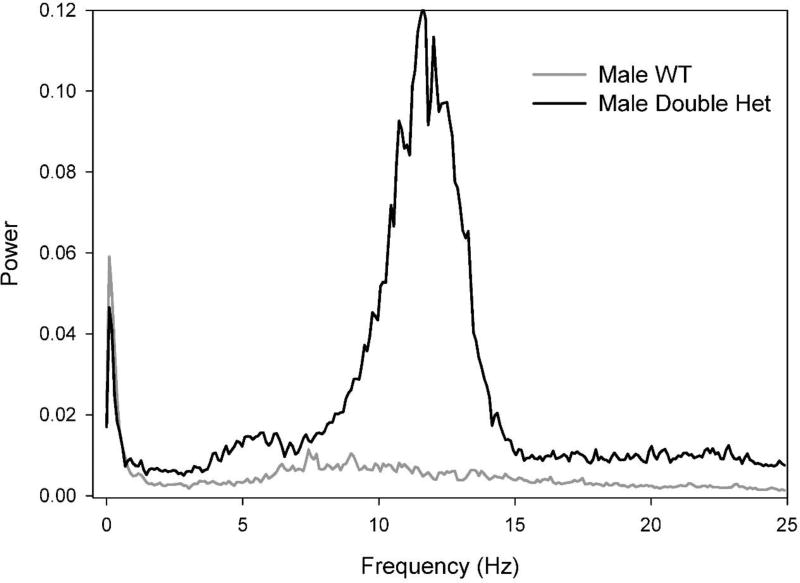
Mouse lines were generated with mutations of the Ror1 and Ngf genes harboring gene variants analogous to a family with a father and three affected sons diagnosed with TS. Analysis of fine motor movements using FPA analysis of power spectra such as those generated in section 3.1.1 revealed that male Ror1/Ngf double-het mutant mice have a repetitive movement signature that emerges over the 40-week period of testing. Figure 12 shows that at 40 weeks of age, specifically the male double-het subject showed a robust movement signature captured in an 8.5 – 14 Hz band of the power spectrum. The increased movement power in this frequency range in the double-het mouse is representative of group results.
Figure 12.
Male double-het mutant mice have a repetitive movement signature. These preliminary data show frequency analysis of fine motor activity in two representative male mice at 40 weeks of age. The Ror1/Ngf double mutant mouse generated a consistent peak of additional movement power in the 8.5–14 Hz frequency range. Associated groups of mice showed similar results. This enticing finding generates numerous questions about the specific nature of the movements and their contribution to the clinical relevance of this model, but demonstrates the usefulness of FPA analysis in screening movement patterns.
4.1 Discussion
The first experiment used the FPA to characterize nociception-related behaviors following formalin injection as a model of persistent inflammatory nociception (D&D 1977). This approach typically uses timed observer counting to quantify flinching of the inflamed hind paw, a labor-intensive and observer-dependent process. Automated analysis using FPA collected data on two end points: total distance traveled and Fourier-transformed power spectra during the hour after formalin injection.
The behavioral response to formalin injection into a hind paw is comprised of two periods of intense shaking, flinching, licking and grooming of the hind paw, and the traditional assessment of the dynamic pattern of these behaviors over time were in accordance with previously published time courses of flinching behavior following formalin injection (Tjolsen, Berge et al. 1992).
Many previous studies have investigated locomotor activity or exploration after formalin injection. Definitive studies have characterized multiple behaviors over time and at several concentrations of formalin in adult rats (Abbott, Ocvirk et al. 1999). The observer-dependent nature of traditional data gathering has led to the development of several automated data collection methods, including approaches based on breakage of light beam grids (Holland and Goldstein 1990), magnetic field arenas (Yaksh, Ozaki et al. 2001), movement displacement of a small chamber (Jett and Michelson 1996, Xie, Wang et al. 2005), and various video-tracking strategies (Jourdan, Ardid et al. 1997, Jourdan, Alloui et al. 1999, Sakiyama, Sujaku et al. 2008). In this context, FPA analysis allows automated quantitation of the complete range of behaviors elicited by persistent inflammatory nociception in this widely-used model.
Analysis of these behaviors using the FPA in this study revealed the typical biphasic pattern. Spatial plots from FPA position/time recordings of female rats over one hour demonstrate movement of the rats across the force plate area and that movement changed over time (Figure 3), and integration of the position over the assay period showed an increase in total distance traveled by the subjects during the testing period (Figure 4). Analysis of total distance traveled from FPA recordings revealed that 5% formalin-treated rats had higher total distance traveled compared to naïve rats (Figure 4), indicating the nociceptive stimulus evoked more locomotion and movement than rats that were not enduring a noxious stimulus. In interpreting FPA data, it is important that movement across the arena floor is not the sole contributor to total distance measurements; the total distance sum also includes the small deflections in the center of gravity of the subject that result from smaller movements (including whisking, breathing, etc.). These small movements and complex behaviors not visible to the naked eye can be captured by the exquisite sensitivity of the FPA, however.
The force/time traces in Figure 5 demonstrate intense locomotor activity of the rats during the typical early- and late-phase responses to the injection, as evidenced by the force on the plate changing over time. Fourier-transformation-based power spectral analysis was performed on the FPA force/time traces over the entire 60-minute period following formalin injection (Figure 6). Based on the difference in power spectra between control rats and those injected with formalin, three specific frequency bands (ranges) were designated for further comparison of behavioral power (Figure 7). Results revealed an increase in power for formalin-treated rats in the Peak frequency band (Figure 8), but not at the Low or High frequency band. These data demonstrate that 5% formalin evoked an increase in a behavior(s) that is represented by power in the 4.4–5.4 Hz frequency band. This increase was accompanied by an apparent loss of power in a 1.0 – 2.5 Hz frequency band. Specific behaviors are associated with power in restricted frequency bands. The few well-defined examples include licking (4–7 Hz), respiration (1–2 Hz), heartbeat (6–8 Hz), and whisking (8–25 Hz). Locomotion is typically large amplitude and very low frequency (< 2 Hz). Accordingly, the increased power in the 4.4–5.4 Hz frequency band may represent increased licking and whisking behaviors, and perhaps an increased respiratory rate in 5% formalin-injected rats. The concomitant loss of power in the 1.0 – 2.5 Hz frequency band may reflect relatively fewer respiratory or locomotive movements at these frequencies, perhaps due to alteration of normal locomotion by flinching behaviors.
The transgenic human laminin α5 mouse studies provided an opportunity to use FPA analysis to record and quantify extremely rapid movements. In this study, human laminin α5-transgenic mice displayed a robust, hyperlocomotive circling behavior evident when the mice are handled or otherwise disturbed or stimulated. These behaviors do not prevent the hemizygous mice from maturing and mating.
The homozygous mice showed remarkable hyperlocomotion, far too rapid to quantify (or even observe clearly) with traditional scoring approaches. The behavioral hyperactivity of the homozygous mice consisted of nearly constant, rapid circling behaviors (Figures 9). Figure 10 shows the remarkable detail in which these locomotor behaviors can be analyzed, revealing that the circling movements included changes in diameter of circling movement, and that the behaviors were so rapid as to suggest that their expression is likely not being controlled through recurrent inputs from sensory systems. These findings certainly suggest a role for laminin α5 in CNS mechanisms that regulate locomotion and information processing, and reveal the need for investigation of the anatomical or physiological anomalies in the homozygous mouse brain.
The behavioral assays piloted in the migraine modeling study were undertaken as part of the development of a multi-behavioral model in the rat (Vermeer, Gregory et al. 2014, Vermeer, Gregory et al. 2015). Most previous studies of rodent models of migraine have focused on the dynamics of neuronal signaling or gene expression in trigeminal systems. Surprisingly few studies have specifically tested behaviors reflecting the clinical criteria for diagnosing migraine in humans, where headache must be accompanied by phonophobia or photophobia. The current model attempted to recapitulate manifestation in the rodents of human symptomology described by the clinical diagnostic criteria from the International Classification of Headache Disorders (2004)(ICHD-II and ICHD-III) (Society, 2004; Society, 2013). Clinically, migraine diagnosis has no assay for a specific biomarker; analysis of symptoms is the sole basis for diagnosis of this disorder. In this rodent model, rats received a dural application of “inflammatory soup”, a well-established model for migraine study in rats (Burstein, Yamamura et al. 1998). This stimulus evokes migraine-like behaviors, such as diminished total locomotor activity (Stucky, Gregory et al. 2011), and delayed stimulus-evoked grooming(Vermeer, Gregory et al. 2015).
Modification of the FPA arena provides a simple means of measuring avoidance of light and/or sound in rodent models. By superimposing a divided place-preference chamber over the FPA, positional data can be used to track the rats’ movement from side to side (loud/quiet or light/dark) during the testing period (Figure 2). In the experiment shown rats showed a significant shift in place preference toward dark or quiet environments following dural stimulation. This effect mimicked photophobia and phonophobia, each of which is a diagnostic symptom of migraine headache. The magnitude of the photo- and phonophobia observed increased with repeated dural stimulation, revealing increased sensitization toward light and sound like that which occurs in chronic migraine (Figure 11). Compared to other popular testing approaches in rat models of migraine (e.g., mechanical stimulation of the face in a restrained or freely-moving rat (Burstein, Yamamura et al. 1998, Liverman, Brown et al. 2009, Stucky, Gregory et al. 2011), this approach provides a behavioral rodent migraine model with higher face validity by measuring spontaneous reactions of the animal to ambient conditions. This preclinical model of migraine may better predict the efficacy of putative migraine pharmacotherapies using assessment of behaviors that reflect well-defined diagnostic symptoms.
Finally, the FPA allows a means of obtaining high-yield behavioral data in the phenotyping of mutant mouse models of human disease. Advances in genomics technologies have provided data associating gene variations with clinical phenotypes, many of which are rare or previously undiagnosed. Identifying gene variants in patient populations can suggest mechanisms that might contribute to the disease process, but this approach has limitations. In particular, the relationship between gene changes and complex neurological disorders are largely associative (Pauls, Fernandez et al. 2014). A prerequisite for validation of relevant genetic variants or mutations is development of preclinical models that replicate the human phenotype at both a cellular and behavioral level. The pattern of movement disorders observed in these preliminary studies using the Ror1/Ngf double mutant mice (Figure 12) shows that the mutant mice are manifesting a peak of movement power in the 8.5 – 14 Hz frequency band. These frequencies of movement are consistent with whisking, sniffing, respiration, or tremor; however, the exact nature of the movements contributing to this signature have yet to be elucidated. Seizure activity, tremor and tic-related movements or aberrant repeated motions (stereotypy) have previously been assessed by FPA, which is particularly capable of detecting muscular activity related to fine movement and tremor (Fowler, Birkestrand et al. 2003, Crosland, Zarcone et al. 2005, McKerchar, Zarcone et al. 2006, Smittkamp, Brown et al. 2008). Similar approaches were used to phenotype behavioral deficits in a mouse model of Huntington’s disease, revealing gait disturbances quantified using Fourier analysis of rhythmicity (Fowler, Miller et al. 2009).
Of course, the larger challenge in this example, and essentially whenever FPA identifies a novel movement signature at a specific frequency or magnitude, is to identify the specific body movements that produce the changes in force on the actimeter plate. The difficulty of this process can vary between examples; drug-evoked tremor or stereotypic tongue movements may be predicted and observable (Fowler, Birkestrand et al. 2003, Smittkamp, Brown et al. 2008), or may be too small or rapid to simply observe. Accordingly, high resolution, time-synced video recording may be necessary to generate images that can be slowed down and viewed simultaneously with FPA data in attempts to link specific movements with FPA data events.
4.1.5 Conclusion
Taken together, each example of the assays in this report demonstrate the power and usefulness of the FPA in behavioral phenotyping of rodent models of human disease. The unique sensitivity of the FPA provides the ability to examine and quantify minute details of motor behaviors. Furthermore, the FPA can measure open-field position and fine motor movements simultaneously, even in complex position tasks like place preference testing. The FPA is particularly suited to analysis of the frequency and magnitude of rhythmic movements (e.g., tremor, stereotypy, or seizure activity). Force-plate actimetry provides a rich data stream that can be analyzed to quantify specific aspects of behavior such as bouts of low mobility, spatial statistics of time spent in different areas of the arena, stereotypy, tremor, rearing, or startle. The FPA system is automated, which avoids the labor-intensive aspects of live-time or video observation and scoring, and removes confounding issues with multiple observers like inter-observer bias, variability, or blinding issues. Use of the FPA in specific experimental constructs can be flexible in duration of testing, and the FPA arena can accommodate modifications allowing more complex assays of rodent behavior (e.g., place preference, olfactory dishabituation, acoustic startle, etc.). The use of FPA analysis of movement can be particularly relevant in models of neurological disorders, where specific brain lesions, aberrant development, or pharmacological processes produce varied disruptions in gait, stereotypic behaviors, tremor, etc. These approaches can greatly expand the scope and detail of movement analysis in facilities involved in the behavioral phenotyping of preclinical models of human disease.
Highlights.
This report describes four specific examples of Force-Plate Actimeter analysis of behavior.
Force-Plate Actimeter analysis can be used to capture and quantify specific features of the complex behavioral phenotypes of animal models of human disease.
Examples include Force-Plate Actimeter analysis of nociceptive behaviors, rapid circling behaviors, place preference behaviors, and a complex movement signature in a Tourette Syndrome model mouse.
Force-Plate Actimeter analysis is powerful and useful in the examination and quantification of minute details of motor behaviors.
Force-Plate Actimeter analysis greatly expands the scope and detail of behavioral phenotyping in preclinical models of human disease.
Acknowledgments
These studies received core support, and in some cases subsidy, by the Kansas Intellectual and Developmental Disabilities Center (NICHD HD02528, HD090216). Behavioral analyses shown were performed in the R.L Smith Rodent Behavior Facility, a feature of the Kansas IDDRC PreClinical Models Core (former the KIDDRC Biobehavioral Measurement Core). Studies in these facilities has been greatly facilitated by the expertise of staff members including Michelle Winter, Linda Eggimann, and Sarah Tague. The formalin-evoked nociception studies were performed by Andrew Ralya, Ph.D. and supported by the Kansas IDeA Network of Biomedical Research Excellence and an award from the University of Kansas Medical Center Biomedical Research Training Program (NCRR P20 RR016475). The laminin α5 transgenic mouse study was funded in part by NIH grant P01DK065123 and a Lied Basic Science Pilot Grant from the KUMC Research Institute, Inc. Technical assistance was provided by Brooke Steenhard, Patricia St. John, Larysa Stroganova, Adrian Zelenchuk, Dianne Durham, and editorial assistance by Stephen Fowler. The migraine modeling studies were funded by grants from Merck & Co., the American Headache Society, Migraine Research Foundation, and the KUMC Biomedical Research Training Program. The migraine modeling work relied on the assistance provided by Nick Stucky, Lydia Vermeer and Eugene Gregory. The Ngf/Ror1 mutant mouse model was developed in collaboration with Sarah Soden and Steven F. Kingsmore at the Children’s Mercy Hospital Center for Pediatric Genomic Medicine and generated within the KUMC Transgenic and Gene Targeting Facility by Jay Vivian and Jennifer Pace. The authors are grateful for funding provided by The Patton Foundation, The NIH Undiagnosed Diseases Program, and the Tourette Association of America.
Footnotes
Publisher's Disclaimer: This is a PDF file of an unedited manuscript that has been accepted for publication. As a service to our customers we are providing this early version of the manuscript. The manuscript will undergo copyediting, typesetting, and review of the resulting proof before it is published in its final citable form. Please note that during the production process errors may be discovered which could affect the content, and all legal disclaimers that apply to the journal pertain.
Author Disclosure Statement
No competing financial interests exist for any of the authors of this manuscript.
References
- The International Classification of Headache Disorders: 2nd edition. Cephalalgia. 2004;(24 Suppl 1):9–160. doi: 10.1111/j.1468-2982.2003.00824.x. [DOI] [PubMed] [Google Scholar]
- Abbott FV, Ocvirk R, Najafee R, Franklin KB. Improving the efficiency of the formalin test. Pain. 1999;83(3):561–569. doi: 10.1016/S0304-3959(99)00168-2. [DOI] [PubMed] [Google Scholar]
- Allen AL, McCarson KE. Estrogen increases nociception-evoked brain-derived neurotrophic factor gene expression in the female rat. Neuroendocrinology. 2005;81(3):193–199. doi: 10.1159/000087002. [DOI] [PubMed] [Google Scholar]
- Burstein R, Jakubowski M. Analgesic triptan action in an animal model of intracranial pain: a race against the development of central sensitization. Ann Neurol. 2004;55(1):27–36. doi: 10.1002/ana.10785. [DOI] [PubMed] [Google Scholar]
- Burstein R, Yamamura H, Malick A, Strassman AM. Chemical stimulation of the intracranial dura induces enhanced responses to facial stimulation in brain stem trigeminal neurons. J Neurophysiol. 1998;79(2):964–982. doi: 10.1152/jn.1998.79.2.964. [DOI] [PubMed] [Google Scholar]
- Chesler EJ, Wilson SG, Lariviere WR, Rodriguez-Zas SL, Mogil JS. Identification and ranking of genetic and laboratory environment factors influencing a behavioral trait, thermal nociception, via computational analysis of a large data archive. Neurosci Biobehav Rev. 2002;26(8):907–923. doi: 10.1016/s0149-7634(02)00103-3. [DOI] [PubMed] [Google Scholar]
- Crosland KA, Zarcone JR, Schroeder S, Zarcone T, Fowler S. Use of an antecedent analysis and a force sensitive platform to compare stereotyped movements and motor tics. Am J Ment Retard. 2005;110(3):181–192. doi: 10.1352/0895-8017(2005)110<181:UOAAAA>2.0.CO;2. [DOI] [PubMed] [Google Scholar]
- Deschenes M, Moore J, Kleinfeld D. Sniffing and whisking in rodents. Curr Opin Neurobiol. 2012;22(2):243–250. doi: 10.1016/j.conb.2011.11.013. [DOI] [PMC free article] [PubMed] [Google Scholar]
- Drai D, Kafkafi N, Benjamini Y, Elmer G, Golani I. Rats and mice share common ethologically relevant parameters of exploratory behavior. Behav Brain Res. 2001;125(1–2):133–140. doi: 10.1016/s0166-4328(01)00290-x. [DOI] [PubMed] [Google Scholar]
- Dubuisson D, Dennis SG. The formalin test: a quantitative study of the analgesic effects of morphine, meperidine, and brain stem stimulation in rats and cats. Pain. 1977;4(2):161–174. doi: 10.1016/0304-3959(77)90130-0. [DOI] [PubMed] [Google Scholar]
- Fowler SC, Birkestrand B, Chen R, Vorontsova E, Zarcone T. Behavioral sensitization to amphetamine in rats: changes in the rhythm of head movements during focused stereotypies. Psychopharmacology (Berl) 2003;170(2):167–177. doi: 10.1007/s00213-003-1528-5. [DOI] [PubMed] [Google Scholar]
- Fowler SC, Miller BR, Gaither TW, Johnson MA, Rebec GV. Force-plate quantification of progressive behavioral deficits in the R6/2 mouse model of Huntington’s disease. Behav Brain Res. 2009;202(1):130–137. doi: 10.1016/j.bbr.2009.03.022. [DOI] [PMC free article] [PubMed] [Google Scholar]
- Fowler SC, Zarcone TJ, Levant B. Methylphenidate attenuates rats’ preference for a novel spatial stimulus introduced into a familiar environment: assessment using a force-plate actometer. J Neurosci Methods. 2010;189(1):36–43. doi: 10.1016/j.jneumeth.2010.03.014. [DOI] [PMC free article] [PubMed] [Google Scholar]
- Grusser C, Grusser-Cornehls U. Improvement in motor performance of Weaver mutant mice following lesions of the cerebellum. Behav Brain Res. 1998;97(1–2):189–194. doi: 10.1016/s0166-4328(98)00042-4. [DOI] [PubMed] [Google Scholar]
- Holland LN, Goldstein BD. Changes of substance P-like immunoreactivity in the dorsal horn are associated with the ‘phasic’ behavioral response to a formalin stimulus. Brain Res. 1990;537(1–2):287–292. doi: 10.1016/0006-8993(90)90370-q. [DOI] [PubMed] [Google Scholar]
- Jett MF, Michelson S. The formalin test in rat: validation of an automated system. Pain. 1996;64(1):19–25. doi: 10.1016/0304-3959(95)00098-4. [DOI] [PubMed] [Google Scholar]
- Jourdan D, Alloui A, Eschalier A. Pharmacological validation of an automated method of pain scoring in the formalin test in rats. J Pharmacol Toxicol Methods. 1999;42(3):163–170. doi: 10.1016/s1056-8719(00)00067-8. [DOI] [PubMed] [Google Scholar]
- Jourdan D, Ardid D, Bardin L, Bardin M, Neuzeret D, Lanphouthacoul L, Eschalier A. A new automated method of pain scoring in the formalin test in rats. Pain. 1997;71(3):265–270. doi: 10.1016/s0304-3959(97)03366-6. [DOI] [PubMed] [Google Scholar]
- Levi-Montalcini R. The nerve growth factor: thirty-five years later. Biosci Rep. 1987;7(9):681–699. doi: 10.1007/BF01116861. [DOI] [PubMed] [Google Scholar]
- Liverman CS, Brown JW, Sandhir R, Klein RM, McCarson K, Berman NE. Oestrogen increases nociception through ERK activation in the trigeminal ganglion: evidence for a peripheral mechanism of allodynia. Cephalalgia. 2009;29(5):520–531. doi: 10.1111/j.1468-2982.2008.01755.x. [DOI] [PMC free article] [PubMed] [Google Scholar]
- McCarson KE, Goldstein BD. Naloxone blocks the formalin-induced increase of substance P in the dorsal horn. Pain. 1989;38(3):339–345. doi: 10.1016/0304-3959(89)90221-2. [DOI] [PubMed] [Google Scholar]
- McKerchar TL, Zarcone TJ, Fowler SC. Use of a force-plate actometer for detecting and quantifying vertical leaping induced by amphetamine in BALB/cJ mice, but not in C57BL/6J, DBA/2J, 129×1/SvJ, C3H/HeJ, and CD-1 mice. J Neurosci Methods. 2006;153(1):48–54. doi: 10.1016/j.jneumeth.2005.10.002. [DOI] [PubMed] [Google Scholar]
- Oshinsky ML, Gomonchareonsiri S. Episodic dural stimulation in awake rats: a model for recurrent headache. Headache. 2007;47(7):1026–1036. doi: 10.1111/j.1526-4610.2007.00871.x. [DOI] [PMC free article] [PubMed] [Google Scholar]
- Oshinsky ML, Luo J. Neurochemistry of trigeminal activation in an animal model of migraine. Headache. 2006;(46 Suppl 1):S39–44. doi: 10.1111/j.1526-4610.2006.00489.x. [DOI] [PubMed] [Google Scholar]
- Pauls DL, Fernandez TV, Mathews CA, State MW, Scharf JM. The Inheritance of Tourette Disorder: A review. J Obsessive Compuls Relat Disord. 2014;3(4):380–385. doi: 10.1016/j.jocrd.2014.06.003. [DOI] [PMC free article] [PubMed] [Google Scholar]
- Pezet S, Krzyzanowska A, Wong LF, Grist J, Mazarakis ND, Georgievska B, McMahon SB. Reversal of neurochemical changes and pain-related behavior in a model of neuropathic pain using modified lentiviral vectors expressing GDNF. Mol Ther. 2006;13(6):1101–1109. doi: 10.1016/j.ymthe.2005.11.026. [DOI] [PubMed] [Google Scholar]
- Porro CA, Cavazzuti M. Spatial and temporal aspects of spinal cord and brainstem activation in the formalin pain model. Prog Neurobiol. 1993;41(5):565–607. doi: 10.1016/0301-0082(93)90044-s. [DOI] [PubMed] [Google Scholar]
- Ralya A, McCarson KE. Acute estrogen surge enhances inflammatory nociception without altering spinal Fos expression. Neurosci Lett. 2014;575:91–95. doi: 10.1016/j.neulet.2014.05.035. [DOI] [PMC free article] [PubMed] [Google Scholar]
- Reichardt LF. Neurotrophin-regulated signalling pathways. Philos Trans R Soc Lond B Biol Sci. 2006;361(1473):1545–1564. doi: 10.1098/rstb.2006.1894. [DOI] [PMC free article] [PubMed] [Google Scholar]
- Sakiyama Y, Sujaku T, Furuta A. A novel automated method for measuring the effect of analgesics on formalin-evoked licking behavior in rats. J Neurosci Methods. 2008;167(2):167–175. doi: 10.1016/j.jneumeth.2007.08.003. [DOI] [PubMed] [Google Scholar]
- Smittkamp SE, Brown JW, Stanford JA. Time-course and characterization of orolingual motor deficits in B6SJL-Tg(SOD1-G93A)1Gur/J mice. Neuroscience. 2008;151(2):613–621. doi: 10.1016/j.neuroscience.2007.10.017. [DOI] [PMC free article] [PubMed] [Google Scholar]
- Soden SE, Saunders CJ, Willig LK, Farrow EG, Smith LD, Petrikin JE, LePichon JB, Miller NA, Thiffault I, Dinwiddie DL, Twist G, Noll A, Heese BA, Zellmer L, Atherton AM, Abdelmoity AT, Safina N, Nyp SS, Zuccarelli B, Larson IA, Modrcin A, Herd S, Creed M, Ye Z, Yuan X, Brodsky RA, Kingsmore SF. Effectiveness of exome and genome sequencing guided by acuity of illness for diagnosis of neurodevelopmental disorders. Sci Transl Med. 2014;6(265):265ra168. doi: 10.1126/scitranslmed.3010076. [DOI] [PMC free article] [PubMed] [Google Scholar]
- Steenhard BM, Zelenchuk A, Stroganova L, Isom K, St John PL, Andrews GK, Peterson KR, Abrahamson DR. Transgenic expression of human LAMA5 suppresses murine Lama5 mRNA and laminin alpha5 protein deposition. PLoS One. 2011;6(9):e23926. doi: 10.1371/journal.pone.0023926. [DOI] [PMC free article] [PubMed] [Google Scholar]
- Stucky NL, Gregory E, Winter MK, He YY, Hamilton ES, McCarson KE, Berman NE. Sex differences in behavior and expression of CGRP-related genes in a rodent model of chronic migraine. Headache. 2011;51(5):674–692. doi: 10.1111/j.1526-4610.2011.01882.x. [DOI] [PMC free article] [PubMed] [Google Scholar]
- Thifault S, Lalonde R, Sanon N, Hamet P. Longitudinal analysis of motor activity and coordination, anxiety, and spatial learning in mice with altered blood pressure. Brain Res. 2001;910(1–2):99–105. doi: 10.1016/s0006-8993(01)02658-0. [DOI] [PubMed] [Google Scholar]
- Tjolsen A, Berge OG, Hunskaar S, Rosland JH, Hole K. The formalin test: an evaluation of the method. Pain. 1992;51(1):5–17. doi: 10.1016/0304-3959(92)90003-T. [DOI] [PubMed] [Google Scholar]
- Vermeer LM, Gregory E, Winter MK, McCarson KE, Berman NE. Exposure to bisphenol A exacerbates migraine-like behaviors in a multibehavior model of rat migraine. Toxicol Sci. 2014;137(2):416–427. doi: 10.1093/toxsci/kft245. [DOI] [PMC free article] [PubMed] [Google Scholar]
- Vermeer LM, Gregory E, Winter MK, McCarson KE, Berman NE. Behavioral effects and mechanisms of migraine pathogenesis following estradiol exposure in a multibehavioral model of migraine in rat. Exp Neurol. 2015;263:8–16. doi: 10.1016/j.expneurol.2014.09.011. [DOI] [PMC free article] [PubMed] [Google Scholar]
- Wieseler J, Ellis A, Sprunger D, Brown K, McFadden A, Mahoney J, Rezvani N, Maier SF, Watkins LR. A novel method for modeling facial allodynia associated with migraine in awake and freely moving rats. J Neurosci Methods. 2010;185(2):236–245. doi: 10.1016/j.jneumeth.2009.10.006. [DOI] [PMC free article] [PubMed] [Google Scholar]
- Winter MK, McCarson KE. G-protein activation by neurokinin-1 receptors is dynamically regulated during persistent nociception. J Pharmacol Exp Ther. 2005;315(1):214–221. doi: 10.1124/jpet.105.089565. [DOI] [PubMed] [Google Scholar]
- Xie YF, Wang J, Huo FQ, Jia H, Tang JS. Validation of a simple automated movement detection system for formalin test in rats. Acta Pharmacol Sin. 2005;26(1):39–45. doi: 10.1111/j.1745-7254.2005.00001.x. [DOI] [PubMed] [Google Scholar]
- Yaksh TL, Ozaki G, McCumber D, Rathbun M, Svensson C, Malkmus S, Yaksh MC. An automated flinch detecting system for use in the formalin nociceptive bioassay. J Appl Physiol (1985) 2001;90(6):2386–2402. doi: 10.1152/jappl.2001.90.6.2386. [DOI] [PubMed] [Google Scholar]


