

Abstract
Finger millet [Eleusine coracana (L.) Gaertn] is an excellent food and forage crop of arid and semiarid areas in Africa and Asia. It is well adapted to drought, heat, high salinity, poor soil fertility and low pH with an efficient C4 carbon fixation mechanism for high yield potential. To normalize the target gene expression data, the identification of suitable reference genes is essential. Ten candidate reference genes were selected and their expression stability was analyzed in various samples treated with different abiotic stress conditions. Five different statistical algorithms: geNorm, NormFinder, BestKeeper, ΔCt, and RefFinder were used to determine the stability of these genes. Our results revealed GAPDH, EEF1a, ACT and CYC as highly stable reference genes and PP2A and eIF4A as least stable reference genes across all the samples and suggesting that these genes could be used for accurate transcript normalization under abiotic stress. To the best of our knowledge, this is the first report on identification of suitable reference genes for accurate transcript normalization using qRT-PCR in finger millet under abiotic stress.
Keywords: Finger millet, Abiotic stress, RT-qPCR, Reference gene validation
Introduction
Quantitative real-time PCR (qRT-PCR) is one of the most powerful and reliable techniques to quantify gene expression. This technique is widely used due to its sensitivity, accuracy and reproducibility in gene expression analysis (Artico et al. 2010; Jatav et al. 2016). Quantification assays are performed to detect differential expression of a gene(s) involved in plant growth, development, signal transduction and metabolism. Development of qRT-PCR has revolutionized the field of gene expression analysis (Barber et al. 2005; Bustin et al. 2009). Quantitative real-time PCR (qRT-PCR) has also been used for other purposes such as clinical diagnosis, gene expression analysis in a specific tissue, or studies involving complex experiments with large numbers of genes (Gachon et al. 2004; Nicot et al. 2005; Paolacci et al. 2009). Although qRT-PCR is a widely used and reliable technique, it is strongly affected by factors such as differences in initial sample amount, quality of RNA (integrity), efficiency of cDNA synthesis, primer performance, and normalization and differences in the overall transcriptional activity of the sample (Bustin 2002, 2010; Bustin et al. 2009; Edmunds et al. 2014). To avoid any such variations and biased results, an appropriate normalization method becomes imperative for obtaining reliable quantitative gene expression data. Normalization of target gene expression requires the selection of a stable internal control gene (ICG) (Bollmann et al. 2012; Guénin et al. 2009). Housekeeping genes are commonly used as ICG as most of them typically have stable expression patterns under specific conditions (Bohle et al. 2007; Chen et al. 2011a; Yan and Liou 2006) but there are reports which indicate irregular expression of ICG under non-specific conditions (Li et al. 2012; Llanos et al. 2015; Petriccione et al. 2015; Raffaello and Asiegbu 2013; Yin et al. 2013). Large differences between the absolute expression of an ICG and target gene will mislead the actual differences in target gene expression levels between samples (Rieu and Powers 2009). Therefore, it is very necessary to systematically evaluate the stability of potential ICGs for particular experimental system prior to adopting them for use in qRT-PCR normalization strategies. A number of efforts have been made to identify the stably expressed reference genes in different plants includingArabidopsis (Czechowski et al. 2005; Remans et al. 2008), rice (Jain et al. 2006; Kim et al. 2003), tobacco (Schmidt and Delaney 2010), wheat (Paolacci et al. 2009), Pearl millet (Saha and Blumwald 2014), soybean (Jian et al. 2008; Libault et al. 2008), coffee (Barsalobres-Cavallari et al. 2009; Cruz et al. 2009), cotton (Artico et al. 2010; Tu et al. 2007), Brassica napus (Wang et al. 2014), chicory (Maroufi et al. 2010), cucumber (Wan et al. 2010), pepper (Wan et al. 2011), banana (Chen et al. 2011b), apple (Perini et al. 2014), petunia (Mallona et al. 2010), rose (Klie and Debener 2011; Meng et al. 2013) and tree species (Lin and Lai 2010; Brunner et al. 2004). The frequently used reference genes include elongation factor 1a (EF1a), actin (ACT), ubiquitin-conjugating enzyme (UBC), glyceraldehyde-3-phosphate dehydrogenase (GAPDH), tubulin (TUB) and 18S ribosomal RNA (18S rRNA) which are involved in basic cellular functions (Thellin et al. 1999). No single reference gene with stable constant expression across tissues and experimental conditions is available therefore,we performed an investigation to find suitable reference genes in finger millet.
Numerous statistical algorithms such as Stability Index (Brunner et al. 2004), BestKeeper (Pfaffl et al. 2004), geNorm (Vandesompele et al. 2002), ∆Ct (Silver et al. 2006), RefFinder (Chen et al. 2011a) and NormFinder (Andersen et al. 2004) have been developed for validation and stability ranking of suitable reference genes for qRT-PCR data normalization.
Finger millet [Eleusine coracana (L.) Gaertn] is an excellent food and forage crop of arid and semiarid areas in Africa and Asia. After sorghum, pearl millet, and foxtail millet, it ranks fourth globally as important millets (Gupta et al. 2012; Kothari et al. 2005). Finger millet has a high amount of calcium (0.38%), fiber (18%), phenolic compounds (0.3–3%), and sulphur containing amino acids (Devi et al. 2014; Rurinda et al. 2014; Shobana et al. 2013; Singh and Raghuvanshi 2012). Finger millet is a rich source of tryptophan, cysteine, methionine, and total aromatic amino acids compared to the other cereals (NRC 1996). It is well adapted to drought, heat, high salinity, soil containing Nickel, poor soil fertility and low pH with an efficient C4 carbon fixation and high yield potential (Dass et al. 2013; Gupta et al. 2017; Hegde and Gowda 1989; Zakeri et al. 2013). So finger millet is an ideal crop for functional genomics studies related to C4 photosynthesis and abiotic stress tolerance (Zakeri et al. 2013).
To the best of our knowledge, no such study regarding systematic analysis for the identification of suitable reference genes in finger millet have been reported, although functional genomics studies have been reported (Singh 2014). In present study, a panel of candidate reference genes was evaluated under abiotic stress for accurate transcript normalization which is much needed in finger millet.
Materials and methods
Plant materials
Five genotypes of finger millet (Eleusine coracana [L.] Gaertn), PR 202, PES 110, GPU 28, GPU 20 and GPU 66 were used in this study and on the basis of germination rate, PR 202 and GPU 28 were selected for stress study. All the genotypes were procured from University Agriculture Sciences, GKVK, Bengaluru. Seeds were thoroughly washed with 20% (v/v) Extran® (Merck, India) for 3 min, followed by rinsing with distilled water three times. Surface sterilization was done with a 0.1% HgCl2 (Merck, India) solution (w/v) for 3 min and then rinsed thrice with sterile distilled water for further use.
Seed germination and stress treatment
Seeds were sown in composite soil (peat:vermiculite:sand mixture, 2:2:1) in controlled environmental condition at 26 ± 1 °C under a 16 h photoperiod with 25 μmol m−2 s−1 photon flux and relative humidity oscillating between 40 and 70% at Department of Botany, University of Rajasthan, Jaipur, India. Plants were irrigated with water and 30% strength Hoagland solution (HiMedia, India) on alternate days. After 15 days of germination, finger millet seedlings of each genotype were used for stress treatment. Before stress treatment, they were precultured for 24 h in 30% Hoagland’s solution (Lata et al. 2011; Zhang et al. 2007). According to different stress conditions, the seedlings were divided into 13 groups, each containing 10 seedlings, out of which 12 groups were subjected to abiotic stresses treatment (1 group for drought, 3 for salinity, 4 for heat stress and 4 for cold stress). For drought treatment, seedlings were transferred on solution containing 20% PEG 6000. For salinity stress, a range of saline solutions 100, 200, 300 mM NaCl were prepared. Likewise for heat and cold stress, seedlings were transferred to the solution containing 30% Hoagland medium in plant growth chamber (Thermo, USA) at 38°, 40°, 42° and 45° for heat stress and 4°, 6°, 8°, 10° for cold stress.
Isolation of total RNA, cDNA synthesis and primers
Total RNA was extracted from the different plant samples using Trizol method (Invitrogen). RNA was purified using RNAse free DNase treatment through silica columns (Ribopure™ RNA Purification Kit, Ambion, Thermo, USA). The integrity of the total RNA was checked on 1% agarose gel. Quantity and quality of RNA were evaluated by measuring the optical density at 260 nm and the A260/280 absorption ratio using a NanoDrop 2000 spectrophotometer (Thermo Fisher Scientific, USA) and samples were stored at − 80° for further use. cDNA was synthesized using 100 ng RNA with RevertAid RT Reverse transcription Kit (Thermo Fisher Scientific, USA). The mixture of RNA, dNTP mix, random primers and nuclease free water was incubated at 65 °C for 5 min and kept on ice for 3 min. Master mix containing, 5× enzyme buffer, 1 μL Moloney Murine Leukemia Virus reverse transcriptase (M-MuLV RT) (Fermentas) was added, 6 μL to each sample. The reaction cycle in cycler used the following program: 25 °C for 5 min, 50 °C for 60 min and 70 °C for 15 min. cDNA was then diluted 1:4 (v:v) with nuclease free water. To perform the qRT-PCR analysis, primers were either selected from the literature or designed using Primer Express 3.0 software (Applied Biosystem, Foster City, CA, USA). Primer details for all candidate internal control genes are given in Table 1.
Table 1.
Details of primer sequences, accession no., amplicon size and PCR efficiency of candidate reference genes used for qRT-PCR
| Gene name | Description | Primer pair 5′–3′ | Amplicon size (bp) | Accession no. | PCR efficiency % |
|---|---|---|---|---|---|
| ACT | Actin | F-TGCTCAGTGGAGGATCTACTAT | 108 | HM243500 | 101.02 |
| R-CTGGTGGTGCAATCACTTTAAC | |||||
| CYC | Cyclophilin, peptidyl-prolyl cis–trans isomerase | F-TTTCGCTCTGACAGACCTTTAG | 138 | Si014078m.g | 102.39 |
| R-TGGCAGTAGTAGTAGGGAGAAG | |||||
| eEF1α | Eukaryotic elongation factor 1 alpha | F-GTTACAACCCAGACAAGATTGC | 72 | EF694165 | 109.11 |
| R-TGGACCTCTCAATCGTGTTG | |||||
| GAPDH | Glyceraldehyde-3-phosphate dehydrogenase | F-CTGGTATGTCCTTCCGTGTTC | 109 | GQ398107 | 122.37 |
| R-GCAGCCTTGATAGCCTTCTTA | |||||
| TIP41 | Tonoplast intrinsic protein | F-GGTTCTGAACTCAGGCACTAC | 96 | Si036884m.g | 92.08 |
| R-GAAAGGGCAACAAGGTCAATC | |||||
| UBC2 | Ubiquitin-conjugating enzyme 2 | F-CATGGACCCTTCAGTCTGTTT | 115 | Si018564m.g | 98.54 |
| R-CCTCGGATATCACCCGATCTTA | |||||
| UBQ5 | Ubiquitin 5 | F-GTACACCAAGCCCAAGAAGA | 79 | Si003209m.g | 102.91 |
| R-GTCGTCGACCTTGTAGAACTG | |||||
| eIF4A | Eukaryotic initiation factor 4A | F-GCGTGCATGTTGTTGTTGGT | 60 | EU856535 | 103.65 |
| R-GTGACTGCCTACGCAACATGTC | |||||
| PP2A | Protein phosphatase 2A | F-TGGTAACATGGCTGCAATTC | 95 | Si017892m | 120.48 |
| R-AAATTGAGCCGGACACGA | |||||
| RPL20 | Ribosomal protein L20 | F-CCCGTGTTGCTGCGTTTAT | 62 | KJ490012 | 132.54 |
| R-GGGTAGGCAAAAGAGGGATTTT |
PCR and qRT-PCR
Prior to qPCR, specific amplification of all 10 primer pairs was further confirmed in a 20 μL PCR reaction. PCR reaction mixture (20 μL) contained 10× PCR buffer, 10 mM dNTPs mix, 10 μM each of forward and reverse primers, 1 μL of cDNA and 0.2 μL of Taq polymerase. PCR amplification protocol followed was: an initial denaturation step of 5 min at 95 °C, and 30 cycles of 30 s at 94 °C, 30 s at annealing temperature of primer and 30 s at 72 °C followed by final extension step of 7 min at 72 °C. Five microliters of the PCR product was evaluated in 2% agarose gel stained with ethidium bromide. qRT-PCR was performed using Step One Plus instrument (Applied Biosystem) in a 96-well optical plate (Applied Biosystem) utilizing SYBR Green detection chemistry. Each reaction mixture contained 4 μL five fold diluted cDNA (equal to 50 ng of initial amount of RNA), with 6 μL of a mixture composed of 5 μL 2× SYBR Green with ROX master mix (Fermentas), 0.4 μL each of 10 pmol gene-specific forward and reverse primers and 0.2 μL DNase/RNase free water. Two biological replicates for each sample were used and two technical replicates were analyzed for each biological sample along with 6-point relative standard curve and negative control for each gene. The real time PCR amplification conditions were as follows: an initial denaturation step of 1 min at 50 °C, 10 min at 95 °C, 40 cycles of 15 s at 95 °C, 1 min at 60 °C (Annealing + extension) followed by a dissociation protocol with incremental temperatures of 95 °C for 15 s plus 65 °C for 15 s was used to investigate the specificity of qPCR reaction and presence of primer dimers.
Data analysis for expression stability of internal control genes
Five different types of statistical algorithms namely geNorm, NormFinder, BestKeeper, ΔCt and reffinder (Chen et al. 2015) (http://leonxie.esy.es/RefFinder/?type=reference#) were employed to determine the expression stability of the 10 potential internal control genes across all experiment sets. The Ct values of all internal control genes used in NormFinder (http://www.mdl.dk/) and geNorm (http://medgen.ugent.be/∼jvdesomp/geNorm/) were converted into relative quantities using the formula 2−ΔCt where ΔCt is the value obtained after subtracting minimum Ct value from each corresponding Ct value (ΔCt = each corresponding Ct value—minimum Ct value) (Vandesompele et al. 2002). The expression stability is measured as “M” value by geNorm which is based on the overall pairwise variations comparison among the reference genes. “M” value is inversely correlated to gene expression stability and the genes were ranked according to the “M” value. To determine the minimum number of reference genes for optimal normalization, geNorm also calculates Pair-wise variation (V) between the normalization factor (NF) obtained using “n” genes (best references) (NFn) and the NF obtained using n + 1 genes (addition of an extra less stable reference gene) (NFn + 1). For the pair-wise variation (V value) a cut off value 0.15 was considered acceptable.
As an alternative approach we used NormFinder (Andersen et al. 2004) to evaluate the stability among ICGs, in this algorithm CT values were transformed to linear scale expression quantities. Normfinder ranked the candidate ICG by calculating expression stabilities of the candidate reference genes by combining the intra- and inter-group variations in a sample set containing any number of samples organized in any number of groups.
Another statistical algorithm used was Bestkeeper to find out the pair-wise correlations among the candidate ICG (Pfaffl et al. 2004). For Bestkeeper, raw Ct values instead of relative quantities were used as inputs. The program has its assumption that the genes which are stably expressed should be highly correlated to each other. The overall recommended inclusive geomean ranking values of the most suitable reference gene(s) were prevailed using the ranking results of geNorm and NormFinder algorithms in the RefFinder online tool.
Results
Sample size, RNA quality and qRT-PCR conditions
A total of 58 samples from two accessions of finger millet were treated with different kinds of abiotic stresses. RNA extracted from each sample exhibited high quality as determined by then A260/280 ratio. Quality of RNA was checked on agarose gel and NanoDrop 2000 spectrophotometer. To identify suitable ICGs in finger millet, analysis of stressed samples was performed using potential reference genes reported in literature. In the beginning, all the selected reference genes were amplified with a normal thermal cycler and the amplified product was checked on 2% agarose gel for single band and its specific size. Ten reference genes were selected on the basis of primer which did not allow any dimers, non specific bands and poor amplifications across the samples (Table 1). Amplification efficiency observed for each candidate reference gene ranged from 92.08 to 132.54%. Average Ct value for all 10 candidate reference genes ranged from 16.93 (EEF1a) to 26.86 (TIP41) (Table 2). The stability in expression level of each of the candidate reference gene based on their Ct value is shown in box whisker plot (Fig. 1). Box-whisker plot clearly indicate the EEF1a, RPL20 and ACT as most abundant genes, while UBC 2, PP2A and TIP41 were least abundant genes in finger millet stressed samples.
Table 2.
Expression levels of different housekeeping genes under study in all stress conditions
| Genes | Overall Ct ± SD | Heat Ct ± SD | Cold Ct ± SD | Salinity Ct ± SD | Drought Ct ± SD |
|---|---|---|---|---|---|
| UBQ5 | 21.32 ± 0.94 | 20.62 ± 1.07 | 21.55 ± 0.72 | 21.70 ± 0.66 | 21.49 ± 1.31 |
| UBC2 | 23.12 ± 1.00 | 23.06 ± 0.62 | 22.54 ± 0.80 | 24.25 ± 1.10 | 23.06 ± 0.46 |
| ACT | 22.52 ± 1.17 | 23.31 ± 1.09 | 22.44 ± 0.72 | 22.17 ± 1.20 | 20.57 ± 0.34 |
| TIP41 | 25.49 ± 0.90 | 25.25 ± 0.57 | 25.45 ± 0.82 | 25.75 ± 1.14 | 26.86 ± 0.21 |
| PP2A | 24.43 ± 1.48 | 23.27 ± 0.65 | 24.87 ± 1.26 | 25.51 ± 0.88 | 26.25 ± 0.32 |
| GAPDH | 21.73 ± 1.01 | 22.14 ± 1.12 | 21.69 ± 0.69 | 21.57 ± 1.07 | 20.16 ± 0.12 |
| EEF1a | 18.62 ± 1.10 | 19.27 ± 1.35 | 18.72 ± 0.62 | 18.00 ± 0.55 | 16.93 ± 0.34 |
| CYC | 24.83 ± 1.04 | 25.06 ± 1.140 | 24.89 ± 0.60 | 24.87 ± 1.09 | 23.44 ± 0.56 |
| RPL20 | 22.55 ± 0.69 | 22.82 ± 0.36 | 22.59 ± 0.63 | 21.72 ± 0.45 | 22.83 ± 0.69 |
| eIF4A | 24.31 ± 1.44 | 25.50 ± 1.21 | 24.36 ± 1.05 | 23.48 ± 1.07 | 21.99 ± 0.54 |
Fig. 1.

Gene expression of ten candidate reference genes in all samples. Line across the box depict the median value and inside box show the Ct values. The top and bottom whiskers were determined by the 5th and 95th percentiles, respectively
Gene expression stability and ranking of internal control genes by the geNorm analysis
geNorm analysis used in the present study to rank 10 internal control genes on the basis of average expression stabilities (M) using pairwise comparison is shown in Fig. 2. “M” value of all the genes was observed to be within the acceptable range (< 1.5).
Fig. 2.
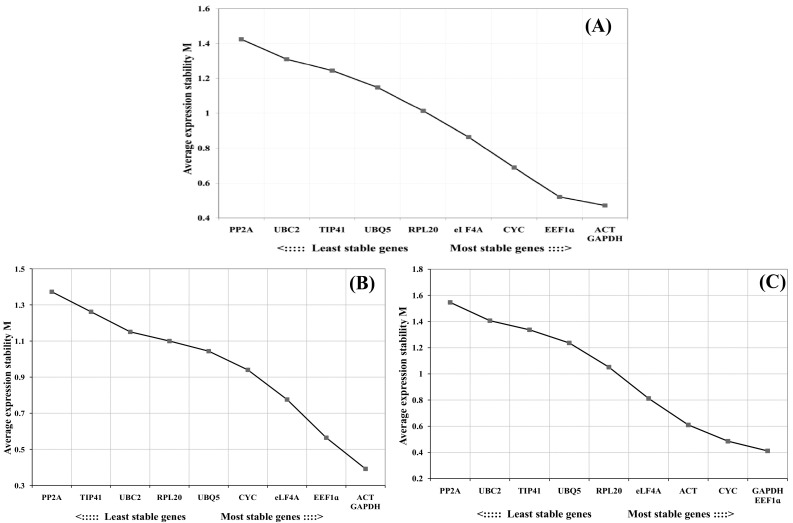
Expression stability and ranking of 10 candidate reference genes as calculated by geNorm across all stress conditions a all samples of finger millet b all samples of genotype PR202 c all samples of genotype GPU 28
“M” value is inversely correlated to gene expression stability and ACT and GAPDH exhibiting the lowest “M” value (0.471) were the most stably expressed amongst all 10 candidate reference genes across all finger millet samples followed by EEF1a and CYC (Table 3). While PP2A and UBC2 had the highest “M” value indicating that they had least stable expression across all the samples followed by TIP41 and UBQ5. As shown in Fig. 3, GAPDH and EEF1a were the most stable reference genes in heat stress and cold stress conditions while GAPDH and eIF4A were best stable in salinity stress and ACT and EEF1a genes were found to be most stable in drought stress treatment. Stability of different reference genes was also evaluated separately in genotype PR202 and GPU 28. In PR202, ACT and GAPDH gene were most stable across all treatments while PP2A and TIP41 was found least stable (Fig. 2). Likewise in genotype GPU 28, EEF1a and GAPDH were found to be most stable internal control genes whereas UBC2 and PP2A were least stable reference genes (Fig. 2). The pairwise variation (Vn/Vn + 1) analysis was performed using geNorm between two sequential normalization factors NFn and NFn + 1 to determine the optimal number of reference genes for accurate normalization of qRT-PCR data. In pairwise variation, a cutoff value of 0.15 is recommended indicating that an additional candidate reference gene will make no significant contribution to the normalization. The V4/5 was < 0.15 which suggests that the top 4 reference genes were sufficient for normalization of qRT-PCR data (Fig. 4).
Fig. 3.

Expression stability and ranking of 10 candidate reference genes as calculated by geNorm in individual stress condition a heat stress treatment b cold stress treatment c salinity stress treatment d drought stress treatment
Table 3.
Stability of candidate reference genes across all samples using different algorithms in finger millet
| Rank | geNorm | NormFinder | BestKeeper | ΔCt | RefFinder | |||||
|---|---|---|---|---|---|---|---|---|---|---|
| Gene | Normalization value | Gene | Stablity value | Gene | SD (± CP) | Gene | Average of STDEV | Gene | Geomean of ranking value | |
| 1 | ACT | GAPDH | 0.471 | GAPDH | 0.119 | RPL20 | 0.54 | GAPDH | 1.16 | GAPDH | 1.57 |
| 2 | EEF1a | 0.153 | TIP41 | 0.75 | EEF1a | 1.23 | ACT | 2.91 | ||
| 3 | EEF1a | 0.52 | ACT | 0.156 | UBQ5 | 0.76 | ACT | 1.24 | EEF1a | 3.03 |
| 4 | CYC | 0.689 | CYC | 0.162 | CYC | 0.76 | CYC | 1.31 | RPL20 | 3.5 |
| 5 | eIF4A | 0.864 | RPL20 | 0.174 | UBC2 | 0.77 | RPL20 | 1.37 | CYC | 4 |
| 6 | RPL20 | 1.013 | UBQ5 | 0.196 | GAPDH | 0.84 | UBQ5 | 1.45 | UBQ5 | 5.24 |
| 7 | UBQ5 | 1.148 | UBC2 | 0.204 | EEF1a | 0.85 | TIP41 | 1.5 | TIP41 | 5.29 |
| 8 | TIP41 | 1.244 | TIP41 | 0.215 | ACT | 0.97 | UBC2 | 1.55 | UBC2 | 7.33 |
| 9 | UBC2 | 1.31 | eIF4A | 0.247 | eIF4A | 1.15 | eIF4A | 1.56 | eIF4A | 7.77 |
| 10 | PP2A | 1.424 | PP2A | 0.32 | PP2A | 1.25 | PP2A | 1.88 | PP2A | 10 |
Fig. 4.

Determination of the optimal number of reference genes for normalization by pairwise variation (V) across all samples of finger millet using geNorm. The average pairwise variations (Vn/Vn + 1) were analyzed to measure the effect of adding reference gene on the qRT-PCR
Gene expression stability and ranking of internal control genes by the NormFinder analysis
To identify the most stable reference gene by NormFinder, the Ct values were converted to relative quantities (Table 3). GAPDH with stability value 0.119 was found to be most stable gene across all samples followed by EEF1a (0.153) and ACT (0.156) as second and third most stable genes respectively. PP2A was found to be least stable gene with stability value 0.320 when used as universal reference gene among all samples. The combination of two genes GAPDH and EEF1a was observed to be most stable with stability value 0.097. The ACT gene which was most stable in geNorm was replaced by EEF1a gene in Norm Finder. The ranking of most stable expressed gene (GAPDH) and least stable expressed gene (PP2A) was identical between geNorm and Norm Finder. On the basis of individual stress study, no similar gene was found to be most stable in all four stress conditions, thereby in control, UBQ5; in heat stress, RPL20; in cold stress, ACT; in salinity stress, EEF1a and in drought stress, GAPDH was calculated as most stable reference gene by geNorm (Table 4). Norm Finder analysis was also performed for each accession separately in PR 202 and GPU 28. In PR 202 gene CYC with stability value 0.457 was found to be most stable across all treatments and PP2A was identified as least stable gene with stability value M > 1 (1.111). Likewise in GPU 28,GAPDH was identified as most stable gene with stability value 0.479 and the least stable gene was PP2A with stability value 1.251. Inter and intra group variations were also evaluated by NormFinder. Intra group variations in PR 202; UBC2, ACT and RPL 20 genes were more stable in control; CYC, RPL 20 and PP2A genes were more stable in heat stress; EEF1a, ACT and TIP41 genes were more stable in cold; UBQ 5, EEF1a and TIP41 genes were more stable in salinity and similarly GAPDH, CYC and UBQ 5 genes were more stable in drought stress. The inter group variation in all treatments showed CYC, RPL 20 and GAPDH genes to be more stable (Fig. 5). Similarly intra group variations in GPU 28, genes EIF4A, RPL 20 and PP2A were more stable in control; ACT, RPL 20 and GAPDH genes were more stable in heat stress; GAPDH, EEF1a and ACT genes were more stable in cold; UBC2, EIF4A and GAPDH genes were more stable in salinity and similarly UBQ 5, RPL 20, PP2A and EEF1a genes were more stable in drought stress. The inter group variation in all treatments showed GAPDH, ACT and UBQ 5 genes to be more stable (Fig. 5).
Table 4.
Expression stability of candidate reference genes as calculated by Normfinder
| Rank | Control | Heat | Cold | Salinity | Drought | |||||
|---|---|---|---|---|---|---|---|---|---|---|
| Gene | Stablity | Gene | Stablity | Gene | Stablity | Gene | Stablity | Gene | Stablity | |
| 1 | UBQ5 | 0.054 | RPL20 | 0.514 | ACT | 0.3 | EEF1a | 0.329 | GAPDH | 0.043 |
| 2 | GAPDH | 0.054 | ACT | 0.594 | EEF1a | 0.337 | eIF4A | 0.654 | TIP41 | 0.097 |
| 3 | RPL20 | 0.37 | GAPDH | 0.643 | GAPDH | 0.436 | GAPDH | 0.682 | PP2A | 0.288 |
| 4 | TIP41 | 0.468 | PP2A | 0.748 | UBQ5 | 0.661 | CYC | 0.77 | ACT | 0.313 |
| 5 | EEF1a | 0.501 | EEF1a | 0.855 | TIP41 | 0.666 | UBQ5 | 0.777 | EEF1a | 0.318 |
| 6 | PP2A | 0.636 | UBC2 | 0.858 | eIF4A | 0.87 | ACT | 0.839 | UBC2 | 0.467 |
| 7 | ACT | 0.638 | TIP41 | 0.917 | RPL20 | 0.894 | RPL20 | 0.844 | eIF4A | 0.576 |
| 8 | eIF4A | 0.693 | CYC | 1 | CYC | 0.933 | PP2A | 1.043 | CYC | 0.59 |
| 9 | UBC2 | 0.903 | eIF4A | 1.112 | UBC2 | 0.962 | UBC2 | 1.23 | RPL20 | 0.741 |
| 10 | CYC | 0.919 | UBQ5 | 1.137 | PP2A | 1.022 | TIP41 | 1.403 | UBQ5 | 1.452 |
Fig. 5.
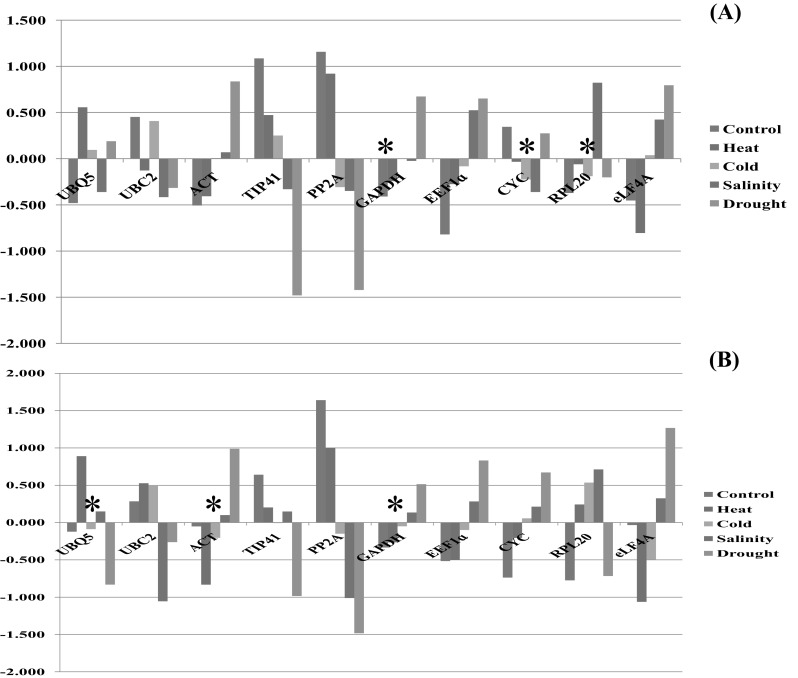
Normfinder based inter-group variation analysis of candidate reference genes across all stress conditions in both genotypes individually a PR202 b GPU 28. *Most stable reference genes across all the samples
Gene expression stability and ranking of internal control genes by the BestKeeper analysis
To find the optimal candidate reference genes on the basis of pair-wise correlation between the genes, Beestkeeper analysis was performed. A comparative analysis across potential reference genes was performed by estimating correlations of the expression levels between all reference genes. The Bestkeeper analysis suggested that RPL20 (0.54) was the most stables reference gene followed by TIP41 (0.75), CYC (0.76) and UBQ5 (0.76) while PP2A (1.25), eIF4A (1.15) and ACT (0.97) were least stable genes across all the samples (Table 3). Expression stability of reference genes in individual stress condition as calculated using BestKeeper algorithm and it was found that TIP41 in control, RPL20 in heat and EEF1a in cold were most stable reference genes while in salinity and drought stress RPL20 and GAPDH were most stable reference genes (Table 5). Expression stability of all the genes was also analyzed separately in both the accessions PR202 and GPU28. UBC2 was found most stable followed by RPL20 and CYC whereas PP2A was found least stable in PR202 among all sample sets. Similarly, EEF1a was found most stable followed by CYC and GAPDH while PP2A was least stable in all sample sets of GPU 28.
Table 5.
Expression stability of candidate reference genes as calculated by BestKeeper
| Rank | Control | Heat | Cold | Salinity | Drought | ||||||||||
|---|---|---|---|---|---|---|---|---|---|---|---|---|---|---|---|
| Genes | SD | CV | Gene | SD | CV | Genes | SD | CV | Gene | SD | CV | Genes | SD | CV | |
| 1 | TIP41 | 0.05 | 0.22 | RPL20 | 0.31 | 1.34 | EEF1a | 0.34 | 1.81 | RPL20 | 0.37 | 1.69 | GAPDH | 0.09 | 0.44 |
| 2 | RPL20 | 0.11 | 0.47 | TIP41 | 0.44 | 1.73 | CYC | 0.49 | 1.97 | UBQ5 | 0.48 | 2.2 | TIP41 | 0.15 | 0.56 |
| 3 | CYC | 0.22 | 0.87 | UBC2 | 0.52 | 2.24 | RPL20 | 0.46 | 2.03 | EEF1a | 0.4 | 2.21 | PP2A | 0.23 | 0.87 |
| 4 | UBC2 | 0.21 | 0.92 | PP2A | 0.56 | 2.41 | GAPDH | 0.46 | 2.11 | PP2A | 0.68 | 2.67 | ACT | 0.24 | 1.17 |
| 5 | GAPDH | 0.4 | 1.81 | ACT | 0.89 | 3.81 | UBQ5 | 0.54 | 2.5 | CYC | 0.73 | 2.92 | UBC2 | 0.33 | 1.42 |
| 6 | UBQ5 | 0.48 | 2.2 | eIF4A | 0.99 | 3.87 | ACT | 0.56 | 2.5 | eIF4A | 0.82 | 3.49 | EEF1a | 0.24 | 1.44 |
| 7 | eIF4A | 0.84 | 3.46 | UBQ5 | 0.89 | 4.31 | TIP41 | 0.64 | 2.52 | TIP41 | 0.96 | 3.74 | CYC | 0.4 | 1.69 |
| 8 | ACT | 0.8 | 3.55 | GAPDH | 0.96 | 4.35 | UBC2 | 0.58 | 2.56 | UBC2 | 0.93 | 3.81 | eIF4A | 0.39 | 1.77 |
| 9 | PP2A | 0.8 | 3.61 | CYC | 1.11 | 4.43 | eIF4A | 0.77 | 3.16 | GAPDH | 0.83 | 3.84 | RPL20 | 0.49 | 2.15 |
| 10 | EEF1a | 0.72 | 3.76 | EEF1a | 1.16 | 6.02 | PP2A | 0.95 | 3.82 | ACT | 0.94 | 4.24 | UBQ5 | 0.93 | 4.33 |
Gene expression stability and ranking of internal control genes by the ΔCt analysis
ΔCt method was used to compare the relative expression of an internal control gene within every sample, it gives rank on the basis of average of standard deviation (STDEV). Analysis using this method is shown in Table 3. It was observed that GAPDH (1.16), EEF1a (1.23), ACT (1.24) and CYC (1.31) were more stable reference genes across all the samples (Table 3). Ten candidate reference genes showing highest expression to least expression in individual stress conditions is shown in Table 6. In control, heat, cold, salinity and drought stress: GAPDH, RPL20, ACT, EEF1a and PP2A were most stable reference gene.
Table 6.
Expression stability of candidate reference genes as calculated by ∆Ct
| Rank | Control | Heat | Cold | Salinity | Drought | |||||
|---|---|---|---|---|---|---|---|---|---|---|
| Gene | Stablity | Gene | Stablity | Gene | Stablity | Gene | Stablity | Gene | Stablity | |
| 1 | GAPDH | 0.55 | RPL20 | 1.01 | ACT | 0.8 | EEF1a | 0.97 | PP2A | 0.47 |
| 2 | UBQ5 | 0.55 | ACT | 1.02 | EEF1a | 0.81 | eIF4A | 0.99 | TIP41 | 0.47 |
| 3 | EEF1a | 0.63 | GAPDH | 1.03 | GAPDH | 0.85 | GAPDH | 1 | ACT | 0.48 |
| 4 | RPL20 | 0.64 | PP2A | 1.13 | UBQ5 | 1 | ACT | 1.09 | EEF1a | 0.48 |
| 5 | PP2A | 0.68 | EEF1a | 1.14 | TIP41 | 1 | CYC | 1.09 | GAPDH | 0.49 |
| 6 | TIP41 | 0.68 | UBC2 | 1.18 | eIF4A | 1.12 | UBQ5 | 1.17 | eIF4A | 0.62 |
| 7 | ACT | 0.68 | TIP41 | 1.21 | RPL20 | 1.15 | RPL20 | 1.21 | CYC | 0.63 |
| 8 | eIF4A | 0.72 | CYC | 1.27 | CYC | 1.16 | PP2A | 1.33 | UBC2 | 0.75 |
| 9 | UBC2 | 0.92 | eIF4A | 1.38 | UBC2 | 1.18 | UBC2 | 1.47 | RPL20 | 0.91 |
| 10 | CYC | 0.94 | UBQ5 | 1.39 | PP2A | 1.21 | TIP41 | 1.58 | UBQ5 | 1.46 |
Gene expression stability and ranking of internal control genes by the RefFinder analysis
Stability ranking of 10 candidate reference genes was further confirmed using comprehensive ranking method by RefFinder across all samples. RefFinder is an online web tool which compares the data obtained from geNorm, NormFinder, ΔCt and BestKeeper and gives comprehensive ranking to authenticate the stability ranking via different softwares. According to the RefFinder tool on the basis of geomean ranking values, GAPDH was found to be most stable gene followed by ACT and EEF1α. The Geomean values were between 1.57 to 10.0 for all samples and PP2A was least stable gene (Table 3). For reliable identification of most stable internal control genes, 10 candidate reference genes analyzed using four different algorithms were incorporated by RefFinder and the complete results are shown in Table 7. The ranking of all 10 reference genes in all samples and individual stress conditions are shown in Fig. 6. GAPDH was found to be most stable in overall and control samples while EEF1α was most stable reference gene in cold and salinity stress. RPL20 was most stable in heat stress and PP2A was most stable in drought stress according to RefFinder.
Table 7.
Expression stability and ranking of the 10 candidate reference genes as calculated by RefFinder
| Method | 1 | 2 | 3 | 4 | 5 | 6 | 7 | 8 | 9 | 10 |
|---|---|---|---|---|---|---|---|---|---|---|
| Ranking order without stress treatment (better–good–average) | ||||||||||
| Delta CT | GAPDH | UBQ5 | EEF1a | RPL20 | PP2A | TIP41 | ACT | eIF4A | UBC2 | CYC |
| BestKeeper | TIP41 | RPL20 | UBC2 | CYC | GAPDH | UBQ5 | EEF1a | PP2A | ACT | eIF4A |
| Normfinde r | UBQ5 | GAPDH | RPL20 | TIP41 | EEF1a | PP2A | ACT | eIF4A | UBC2 | CYC |
| Genorm | ACT | PP2A | eIF4A | EEF1a | UBQ5 | GAPDH | RPL20 | TIP41 | UBC2 | CYC | |
| Comprehensive ranking | GAPDH | UBQ5 | RPL20 | TIP41 | PP2A | EEF1a | ACT | eIF4A | UBC2 | CYC |
| Ranking order under heat stress (better–good–average) | ||||||||||
| Delta CT | RPL20 | ACT | GAPDH | PP2A | EEF1a | UBC2 | TIP41 | CYC | eIF4A | UBQ5 |
| BestKeeper | RPL20 | TIP41 | UBC2 | PP2A | ACT | UBQ5 | GAPDH | eIF4A | CYC | EEF1a |
| Normfinder | RPL20 | ACT | GAPDH | PP2A | EEF1a | UBC2 | TIP41 | CYC | eIF4A | UBQ5 |
| Genorm | GAPDH | EEF1a | ACT | PP2A | RPL20 | UBC2 | TIP41 | CYC | eIF4A | UBQ5 | |
| Comprehensive ranking | RPL20 | ACT | GAPDH | EEF1a | PP2A | UBC2 | TIP41 | CYC | eIF4A | UBQ5 |
| Ranking order under cold stress (better–good–average) | ||||||||||
| Delta CT | ACT | EEF1a | GAPDH | UBQ5 | TIP41 | eIF4A | RPL20 | CYC | UBC2 | PP2A |
| BestKeeper | EEF1a | GAPDH | RPL20 | CYC | UBQ5 | ACT | UBC2 | TIP41 | eIF4A | PP2A |
| Normfinder | ACT | EEF1a | GAPDH | UBQ5 | TIP41 | eIF4A | RPL20 | CYC | UBC2 | PP2A |
| Genorm | GAPDH | EEF1a | ACT | TIP41 | UBQ5 | eIF4A | RPL20 | CYC | UBC2 | PP2A | |
| Comprehensive ranking | EEF1a | ACT | GAPDH | UBQ5 | TIP41 | RPL20 | eIF4A | CYC | UBC2 | PP2A |
| Ranking order under salinity stress (better–good–average) | ||||||||||
| Delta CT | EEF1a | eIF4A | GAPDH | ACT | CYC | UBQ5 | RPL20 | PP2A | UBC2 | TIP41 |
| BestKeeper | RPL20 | EEF1a | UBQ5 | PP2A | CYC | eIF4A | GAPDH | UBC2 | ACT | TIP41 |
| Normfinder | EEF1a | eIF4A | GAPDH | CYC | UBQ5 | ACT | RPL20 | PP2A | UBC2 | TIP41 |
| Genorm | GAPDH | eIF4A | ACT | CYC | EEF1a | UBQ5 | RPL20 | PP2A | UBC2 | TIP41 | |
| Comprehensive ranking | EEF1a | eIF4A | GAPDH | RPL20 | CYC | UBQ5 | ACT | PP2A | UBC2 | TIP41 |
| Ranking order under drought stress (better–good–average) | ||||||||||
| Delta CT | PP2A | TIP41 | ACT | EEF1a | GAPDH | eIF4A | CYC | UBC2 | RPL20 | UBQ5 |
| BestKeeper | GAPDH | TIP41 | PP2A | ACT | EEF1a | UBC2 | eIF4A | CYC | RPL20 | UBQ5 |
| Normfinder | GAPDH | TIP41 | PP2A | ACT | EEF1a | UBC2 | eIF4A | CYC | RPL20 | UBQ5 |
| Genorm | ACT | EEF1a | PP2A | eIF4A | CYC | TIP41 | GAPDH | UBC2 | RPL20 | UBQ5 | |
| Comprehensive ranking | PP2A | GAPDH | ACT | TIP41 | EEF1a | eIF4A | CYC | UBC2 | RPL20 | UBQ5 |
Fig. 6.
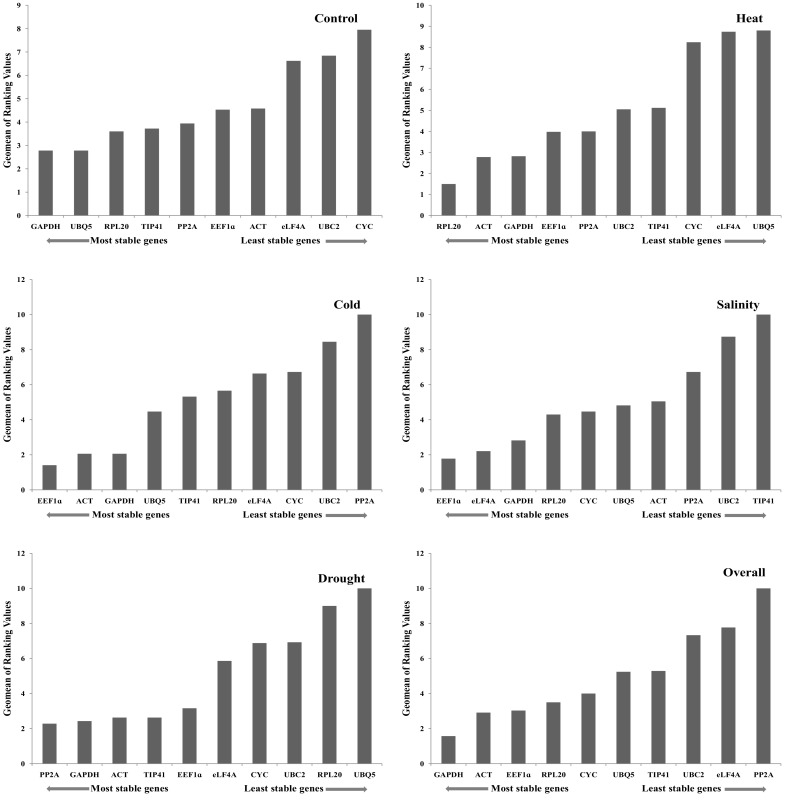
Expression stability of 10 candidate reference genes as calculated by RefFinder. A lower Geomean value indicates more stable expression
Discussion
Major abiotic stresses like heat, cold, drought and salinity, cause massive losses to agricultural production globally, which is further increased under field conditions due to simultaneous exposure of plants to more than one abiotic stress factor (Mittler 2006; Shivhare and Lata 2016). It has been reported that concurrent exposure of more than one stress may lead to complexity in plant responses due to antagonistic signaling pathways that may interact and impede each other (Mittler and Blumwald 2010; Suzuki et al. 2005). To guarantee sustainable crop productivity and decline the risk of environment, it is necessary to understand the regulation and function of the genes playing important roles under different abiotic stresses. To study variations in gene expression and to evaluate gene regulation patterns, selection of suitable internal control genes is a prerequisite for reliable gene expression analysis of target genes (Guénin et al. 2009; Radonić et al. 2004). Irregular expression of commonly used ICGs was reported and it was found that the genes having high expression level (very low Ct values) are unsuitable for RT-qPCR normalization (Tao et al. 2016). So the accurate normalization of gene expression remains a most important prerequisite for precise qRT-PCR analysis as normalization helps to minimize variations acquainted at different steps of qRT-PCR arising from sample to sample variations, pipetting variations, variations in RNA integrity and PCR efficiency (Guénin et al. 2009; Huggett et al. 2005). Gene which has constant expression under any experimental condition, cell or tissue types and developmental stages is called an ideal reference gene (Fan et al. 2013; Gutierrez et al. 2008). ACT, GAPDH, EF1a and TUB are most commonly used internal control genes as these genes are present in all nucleated cell types and involved in primary cellular metabolism which are necessary for cell survival (Migocka and Papierniak 2011). Several reports have documented on variable expression of these reference gens in different plant species in different environmental conditions and in specific cellular functions (Czechowski et al. 2005; Huggett et al. 2005; Lata 2015; Vandesompele et al. 2002; Yang et al. 2015; Zhu et al. 2013). Selection of non suitable internal control genes leads to inappropriate results and inaccurate gene expression data (Ma et al. 2013). So the identification of suitable internal control genes having stable expression in different crops, biological samples and experimental conditions is very essential for reliable transcript measurements through qPCR (Brunner et al. 2004; Kumar et al. 2013). Several reports are available in which more than one study has been carried out for evaluation of suitable internal control genes for accurate normalization during different experimental conditions e.g. pearl millet (Reddy et al. 2015; Saha and Blumwald 2014), rice (Jain et al. 2006; Kim et al. 2003; Li et al. 2010), soybean (Hu et al. 2009; Libault et al. 2008; Ma et al. 2013), sugarcane (Guo et al. 2014; Ling et al. 2014) and coffee (Barsalobres-Cavallari et al. 2009; Cruz et al. 2009).
Finger millet is an excellent food and forage crop of arid and semiarid areas in Africa and Asia which is known for poor soil fertility, drought and high temperature (Goron and Raizada 2015; McDonough et al. 2000) with these adverse conditions, finger millet is a well adapted crop having excellent nutritional qualities so the researchers are becoming keen to study its cellular and molecular mechanisms of stress tolerance through transcriptomics or functional genomics approaches. This study is focused to understand the molecular mechanisms in finger millet in response to different abiotic stresses which will be helpful for crop improvement and for paving way to transgenic approaches.
Till date, there are no reports available on internal control gene identification in different abiotic stress in finger millet so in this pioneering attempt, study of the expression of ten potential reference genes (GAPDH, EEF1a, ACT, CYC, RPL20, UBQ5, UBC2, TIP41, eIF4A, PP2A) were investigated under different abiotic stresses like heat, cold, salinity and drought. Comparison of different statistical approaches could provide a better, unbiased and consistent evaluation of gene stability across different conditions (Migocka and Papierniak 2011). The overall results obtained on the basis of statistical analysis by geNorm, NormFinder, ΔCt and RefFinder showed similarity in determining the most stable candidate reference genes. BestKeeper is a different algorithm from the other algorithms, therefore, the results obtained from BestKeeper showed the least correlation with the others (Guo et al. 2014). Based on reference genes recommended by geNorm, NormFinder, ΔCt, and RefFinder; GAPDH, EEF1a and ACT were selected as the top three most stable candidate reference genes across all the samples in different stress conditions. GAPDH is one of the most commonly used internal control gene and also referred as “classical” gene and our results confirm work of previous studies where GAPDH was identified as most stable reference gene as in Coffea arabica (Barsalobres-Cavallari et al. 2009), Linum usitatissimum L. (Huis et al. 2010), Lolium temulentum (Dombrowski and Martin 2009), sugarcane (Andrade et al. 2017), Salicornia europaea (Xiao et al. 2014) and Petroselinum crispum (Li et al. 2016). Another gene EEF1a has also been established as most stable reference gene in pearl millet under different combination of abiotic stresses (Shivhare and Lata 2016), as in soybean under salinity and drought stress (Mittler and Blumwald 2010), wheat under different biotic and abiotic stresses (Long et al. 2010), cucumber under salt and osmotic stress (Migocka and Papierniak 2011), Bermuda grass under drought stress (Chen et al. 2015), sugarcane under drought and salinity stress (Guo et al. 2014) and in Petroselinum crispum under abiotic stresses (Li et al. 2016). Several studies have suggested ACT as most stable internal control gene for example in pearl millet under different abiotic stress conditions (Saha and Blumwald 2014), in Salicornia europaea under drought stress (Xiao et al. 2014), in soybean under drought stress (Stolf-Moreira et al. 2011), in Oxytropis ochrocephala under different abiotic stress treatment (Zhuang et al. 2015) and in Prunus mume during flowering stress and abiotic stress (Wang et al. 2014). Several reports suggested that use of more than one candidate reference genes would help in more accurate normalization of qRT-PCR data (Le et al. 2012; Vandesompele et al. 2002). There are no reports available regarding internal control gene identification in finger millet. Pairwise variation analysis performed using geNorm suggested that out of 10 candidate genes, 4 genes are suitable for normalization of gene transcript for qRT-PCR analysis in abiotic stress as shown in present study. Earlier studies on identification of suitable internal control genes suggests more than one internal control gene (Chandna et al. 2012; Li et al. 2016; Shivhare and Lata 2016). Study of different types of stresses individually suggested that the comprehensive ranking of most stable reference genes in heat stress were RPL20> ACT > GAPDH; in cold stress EEF1a > ACT > GAPDH; in salinity EEF1a > eIF4A > GAPDH and in drought stress PP2A > GAPDH > ACT. PP2A was reported to be most stable. It shows that at different stress conditions, the stability of internal control genes change (Saha and Blumwald 2014; Shivhare and Lata 2016). So this study indicates that the candidate reference genes should be validated before its use for each study, since the results obtained can rarely be extrapolated to other genotypes or different experimental conditions (Volkov et al. 2003).
Conclusion
To the best of our knowledge, this is the first study of identification of suitable reference genes for accurate transcript normalization using qRT-PCR analyses in finger millet. In this study, we evaluated ten candidate reference genes in two genotypes of finger millet under abiotic stress conditions of heat, cold, drought and salinity. The study recommends GAPDH, EEF1a, ACT and CYC as the most stable reference genes and PP2A and eIF4A as least stable reference genes. This study will benefit future work on gene expression studies during abiotic stress conditions in finger millet, a crop with limited genomic and transcriptomic information, and will also benefit the researchers for conducting experiments on related crop species.
Acknowledgements
The authors are grateful to Indian Council of Medical research (ICMR) (Grant No. 3/1/3/JRF-2014/HRD) for financial support. We also express sincere thanks to Bioinformatics Infrastructure Facility (DBT-BIF), Interdisciplinary Program for Life Sciences (DBT-IPLS), Department of Science and Technology-Promotion of University Research and Scientific Excellence (DST-PURSE) and Departmental Research Support (DRS-Phase-II), Department of Botany, University of Rajasthan for providing necessary research facilities.
References
- Andersen CL, Jensen JL, Ørntoft TF. Normalization of real-time quantitative reverse transcription-PCR data: a model-based variance estimation approach to identify genes suited for normalization, applied to bladder and colon cancer data sets. Can Res. 2004;64:5245–5250. doi: 10.1158/0008-5472.CAN-04-0496. [DOI] [PubMed] [Google Scholar]
- Andrade LM, et al. Reference genes for normalization of qPCR assays in sugarcane plants under water deficit. Plant Methods. 2017;13:28. doi: 10.1186/s13007-017-0178-2. [DOI] [PMC free article] [PubMed] [Google Scholar]
- Artico S, Nardeli SM, Brilhante O, Grossi-de-Sa MF, Alves-Ferreira M. Identification and evaluation of new reference genes in Gossypium hirsutum for accurate normalization of real-time quantitative RT-PCR data. BMC Plant Biol. 2010;10:49. doi: 10.1186/1471-2229-10-49. [DOI] [PMC free article] [PubMed] [Google Scholar]
- Barber RD, Harmer DW, Coleman RA, Clark BJ. GAPDH as a housekeeping gene: analysis of GAPDH mRNA expression in a panel of 72 human tissues. Physiol Genomics. 2005;21:389–395. doi: 10.1152/physiolgenomics.00025.2005. [DOI] [PubMed] [Google Scholar]
- Barsalobres-Cavallari CF, Severino FE, Maluf MP, Maia IG. Identification of suitable internal control genes for expression studies in Coffea arabica under different experimental conditions. BMC Mol Biol. 2009;10:1. doi: 10.1186/1471-2199-10-1. [DOI] [PMC free article] [PubMed] [Google Scholar]
- Bohle K, Jungebloud A, Göcke Y, Dalpiaz A, Cordes C, Horn H, Hempel D. Selection of reference genes for normalisation of specific gene quantification data of Aspergillus niger. J Biotechnol. 2007;132:353–358. doi: 10.1016/j.jbiotec.2007.08.005. [DOI] [PubMed] [Google Scholar]
- Bollmann F, Casper I, Henke J, Pautz A. qRT-PCR: a method and its difficulties. Berlin: Springer; 2012. [DOI] [PubMed] [Google Scholar]
- Brunner AM, Yakovlev IA, Strauss SH. Validating internal controls for quantitative plant gene expression studies. BMC Plant Biol. 2004;4:14. doi: 10.1186/1471-2229-4-14. [DOI] [PMC free article] [PubMed] [Google Scholar]
- Bustin S. Quantification of mRNA using real-time reverse transcription PCR (RT-PCR): trends and problems. J Mol Endocrinol. 2002;29:23–39. doi: 10.1677/jme.0.0290023. [DOI] [PubMed] [Google Scholar]
- Bustin SA. Why the need for qPCR publication guidelines? The case for MIQE. Methods. 2010;50:217–226. doi: 10.1016/j.ymeth.2009.12.006. [DOI] [PubMed] [Google Scholar]
- Bustin SA, et al. The MIQE guidelines: minimum information for publication of quantitative real-time PCR experiments. Clin Chem. 2009;55:611–622. doi: 10.1373/clinchem.2008.112797. [DOI] [PubMed] [Google Scholar]
- Chandna R, Augustine R, Bisht NC. Evaluation of candidate reference genes for gene expression normalization in Brassica juncea using real time quantitative RT-PCR. PLoS ONE. 2012;7:e36918. doi: 10.1371/journal.pone.0036918. [DOI] [PMC free article] [PubMed] [Google Scholar]
- Chen D, Pan X, Xiao P, Farwell MA, Zhang B. Evaluation and identification of reliable reference genes for pharmacogenomics, toxicogenomics, and small RNA expression analysis. J Cell Physiol. 2011;226:2469–2477. doi: 10.1002/jcp.22725. [DOI] [PubMed] [Google Scholar]
- Chen L, H-y Zhong, J-f Kuang, Li J-g Lu, W-j Chen J-y. Validation of reference genes for RT-qPCR studies of gene expression in banana fruit under different experimental conditions. Planta. 2011;234:377. doi: 10.1007/s00425-011-1410-3. [DOI] [PubMed] [Google Scholar]
- Chen Y, Hu B, Tan Z, Liu J, Yang Z, Li Z, Huang B. Selection of reference genes for quantitative real-time PCR normalization in creeping bentgrass involved in four abiotic stresses. Plant Cell Rep. 2015;34:1825–1834. doi: 10.1007/s00299-015-1830-9. [DOI] [PubMed] [Google Scholar]
- Cruz F, et al. Evaluation of coffee reference genes for relative expression studies by quantitative real-time RT-PCR. Mol Breed. 2009;23:607–616. doi: 10.1007/s11032-009-9259-x. [DOI] [Google Scholar]
- Czechowski T, Stitt M, Altmann T, Udvardi MK, Scheible W-R. Genome-wide identification and testing of superior reference genes for transcript normalization in Arabidopsis. Plant Physiol. 2005;139:5–17. doi: 10.1104/pp.105.063743. [DOI] [PMC free article] [PubMed] [Google Scholar]
- Dass A, Sudhishri S, Lenka N. Integrated nutrient management to improve finger millet productivity and soil conditions in hilly region of Eastern India. J Crop Improv. 2013;27:528–546. doi: 10.1080/15427528.2013.800828. [DOI] [Google Scholar]
- Devi PB, Vijayabharathi R, Sathyabama S, Malleshi NG, Priyadarisini VB. Health benefits of finger millet (Eleusine coracana L.) polyphenols and dietary fiber: a review. J Food Sci Technol. 2014;51:1021–1040. doi: 10.1007/s13197-011-0584-9. [DOI] [PMC free article] [PubMed] [Google Scholar]
- Dombrowski JE, Martin RC. Evaluation of reference genes for quantitative RT-PCR in Lolium temulentum under abiotic stress. Plant Sci. 2009;176:390–396. doi: 10.1016/j.plantsci.2008.12.005. [DOI] [Google Scholar]
- Edmunds RC, McIntyre JK, Luckenbach JA, Baldwin DH, Incardona JP. Toward enhanced MIQE compliance: reference residual normalization of qPCR gene expression data. J Biomol Tech: JBT. 2014;25:54. doi: 10.7171/jbt.14-2502-003. [DOI] [PMC free article] [PubMed] [Google Scholar]
- Fan C, Ma J, Guo Q, Li X, Wang H, Lu M. Selection of reference genes for quantitative real-time PCR in bamboo (Phyllostachys edulis) PLoS ONE. 2013;8:e56573. doi: 10.1371/journal.pone.0056573. [DOI] [PMC free article] [PubMed] [Google Scholar]
- Gachon C, Mingam A, Charrier B. Real-time PCR: what relevance to plant studies? J Exp Bot. 2004;55:1445–1454. doi: 10.1093/jxb/erh181. [DOI] [PubMed] [Google Scholar]
- Goron TL, Raizada MN. Genetic diversity and genomic resources available for the small millet crops to accelerate a New Green Revolution. Front Plant Sci. 2015;6:157. doi: 10.3389/fpls.2015.00157. [DOI] [PMC free article] [PubMed] [Google Scholar]
- Guénin S, Mauriat M, Pelloux J, Van Wuytswinkel O, Bellini C, Gutierrez L. Normalization of qRT-PCR data: the necessity of adopting a systematic, experimental conditions-specific, validation of references. J Exp Bot. 2009;60:487–493. doi: 10.1093/jxb/ern305. [DOI] [PubMed] [Google Scholar]
- Guo J, Ling H, Wu Q, Xu L, Que Y. The choice of reference genes for assessing gene expression in sugarcane under salinity and drought stresses. Sci Rep. 2014;4:7042. doi: 10.1038/srep07042. [DOI] [PMC free article] [PubMed] [Google Scholar]
- Gupta N, Gupta AK, Gaur VS, Kumar A. Relationship of nitrogen use efficiency with the activities of enzymes involved in nitrogen uptake and assimilation of finger millet genotypes grown under different nitrogen inputs. Sci World J. 2012 doi: 10.1100/2012/625731. [DOI] [PMC free article] [PubMed] [Google Scholar]
- Gupta V, Jatav PK, Verma R, Kothari SL, Kachhwaha S. Nickel accumulation and its effect on growth, physiological and biochemical parameters in millets and oats. Environ Sci Pollut Res. 2017;30:23915–23925. doi: 10.1007/s11356-017-0057-4. [DOI] [PubMed] [Google Scholar]
- Gutierrez L, et al. The lack of a systematic validation of reference genes: a serious pitfall undervalued in reverse transcription-polymerase chain reaction (RT-PCR) analysis in plants. Plant Biotechnol J. 2008;6:609–618. doi: 10.1111/j.1467-7652.2008.00346.x. [DOI] [PubMed] [Google Scholar]
- Hegde B, Gowda L (1989) Cropping systems and production technology for small millets in India. In: Proceedings of the first international small millets workshop, Bangalore, India, pp 209–236
- Hu R, Fan C, Li H, Zhang Q, Fu Y-F. Evaluation of putative reference genes for gene expression normalization in soybean by quantitative real-time RT-PCR. BMC Mol Biol. 2009;10:93. doi: 10.1186/1471-2199-10-93. [DOI] [PMC free article] [PubMed] [Google Scholar]
- Huggett J, Dheda K, Bustin S, Zumla A. Real-time RT-PCR normalisation; strategies and considerations. Genes Immun. 2005;6:279. doi: 10.1038/sj.gene.6364190. [DOI] [PubMed] [Google Scholar]
- Huis R, Hawkins S, Neutelings G. Selection of reference genes for quantitative gene expression normalization in flax (Linum usitatissimum L.) BMC Plant Biol. 2010;10:71. doi: 10.1186/1471-2229-10-71. [DOI] [PMC free article] [PubMed] [Google Scholar]
- Jain M, Nijhawan A, Tyagi AK, Khurana JP. Validation of housekeeping genes as internal control for studying gene expression in rice by quantitative real-time PCR. Biochem Biophys Res Commun. 2006;345:646–651. doi: 10.1016/j.bbrc.2006.04.140. [DOI] [PubMed] [Google Scholar]
- Jatav P, et al. Identification of internal control genes in milk-derived mammary epithelial cells during lactation cycle of Indian zebu cow. Anim Sci J. 2016;87:344–353. doi: 10.1111/asj.12384. [DOI] [PubMed] [Google Scholar]
- Jian B, Liu B, Bi Y, Hou W, Wu C, Han T. Validation of internal control for gene expression study in soybean by quantitative real-time PCR. BMC Mol Biol. 2008;9:59. doi: 10.1186/1471-2199-9-59. [DOI] [PMC free article] [PubMed] [Google Scholar]
- Kim B-R, Nam H-Y, Kim S-U, Kim S-I, Chang Y-J. Normalization of reverse transcription quantitative-PCR with housekeeping genes in rice. Biotech Lett. 2003;25:1869–1872. doi: 10.1023/A:1026298032009. [DOI] [PubMed] [Google Scholar]
- Klie M, Debener T. Identification of superior reference genes for data normalisation of expression studies via quantitative PCR in hybrid roses (Rosa hybrida) BMC Res Notes. 2011;4:518. doi: 10.1186/1756-0500-4-518. [DOI] [PMC free article] [PubMed] [Google Scholar]
- Kothari SL, Kumar S, Kothari A, Watanabe KN. Applications of biotechnology for improvement of millet crops: review of progress and future prospects. Plant Biotechnol. 2005;22:81–88. doi: 10.5511/plantbiotechnology.22.81. [DOI] [Google Scholar]
- Kumar K, Muthamilarasan M, Prasad M. Reference genes for quantitative real-time PCR analysis in the model plant foxtail millet (Setariaitalica L.) subjected to abiotic stress conditions Plant Cell. Tissue Organ Culture (PCTOC) 2013;115:13–22. doi: 10.1007/s11240-013-0335-x. [DOI] [Google Scholar]
- Lata C (2015) Advances in omics for enhancing abiotic stress tolerance in millets. In: Proceedings of the national academy of sciences, pp 397–417
- Lata C, Bhutty S, Bahadur RP, Majee M, Prasad M. Association of an SNP in a novel DREB2-like gene SiDREB2 with stress tolerance in foxtail millet [Setaria italica (L.)] J Exp Bot. 2011;62:3387–3401. doi: 10.1093/jxb/err016. [DOI] [PMC free article] [PubMed] [Google Scholar]
- Le DT, et al. Evaluation of candidate reference genes for normalization of quantitative RT-PCR in soybean tissues under various abiotic stress conditions. PLoS ONE. 2012;7:e46487. doi: 10.1371/journal.pone.0046487. [DOI] [PMC free article] [PubMed] [Google Scholar]
- Li Q-F, Sun SS, Yuan D-Y, Yu H-X, Gu M-H, Liu Q-Q. Validation of candidate reference genes for the accurate normalization of real-time quantitative RT-PCR data in rice during seed development. Plant Mol Biol Rep. 2010;28:49. doi: 10.1007/s11105-009-0124-1. [DOI] [Google Scholar]
- Li QQ, Skinner J, Bennett JE. Evaluation of reference genes for real-time quantitative PCR studies in Candida glabrata following azole treatment. BMC Mol Biol. 2012;13:22. doi: 10.1186/1471-2199-13-22. [DOI] [PMC free article] [PubMed] [Google Scholar]
- Li M-Y, Song X, Wang F, Xiong A-S. Suitable reference genes for accurate gene expression analysis in parsley (Petroselinum crispum) for abiotic stresses and hormone stimuli. Front Plant Sci. 2016;7:1481. doi: 10.3389/fpls.2016.01481. [DOI] [PMC free article] [PubMed] [Google Scholar]
- Libault M, Thibivilliers S, Bilgin D, Radwan O, Benitez M, Clough S, Stacey G. Identification of four soybean reference genes for gene expression normalization. Plant Genome. 2008;1:44–54. doi: 10.3835/plantgenome2008.02.0091. [DOI] [Google Scholar]
- Lin Y, Lai Z. Reference gene selection for qPCR analysis during somatic embryogenesis in longan tree. Plant Sci. 2010;178:359–365. doi: 10.1016/j.plantsci.2010.02.005. [DOI] [Google Scholar]
- Ling H, Wu Q, Guo J, Xu L, Que Y. Comprehensive selection of reference genes for gene expression normalization in sugarcane by real time quantitative RT-PCR. PLoS ONE. 2014;9:e97469. doi: 10.1371/journal.pone.0097469. [DOI] [PMC free article] [PubMed] [Google Scholar]
- Llanos A, François JM, Parrou J-L. Tracking the best reference genes for RT-qPCR data normalization in filamentous fungi. BMC Genom. 2015;16:71. doi: 10.1186/s12864-015-1224-y. [DOI] [PMC free article] [PubMed] [Google Scholar]
- Long X-Y, et al. Genome-wide identification and evaluation of novel internal control genes for Q-PCR based transcript normalization in wheat. Plant Mol Biol. 2010;74:307–311. doi: 10.1007/s11103-010-9666-8. [DOI] [PubMed] [Google Scholar]
- Ma S, Niu H, Liu C, Zhang J, Hou C, Wang D. Expression stabilities of candidate reference genes for RT-qPCR under different stress conditions in soybean. PLoS ONE. 2013;8:e75271. doi: 10.1371/journal.pone.0075271. [DOI] [PMC free article] [PubMed] [Google Scholar]
- Mallona I, Lischewski S, Weiss J, Hause B, Egea-Cortines M. Validation of reference genes for quantitative real-time PCR during leaf and flower development in Petunia hybrida. BMC Plant Biol. 2010;10:4. doi: 10.1186/1471-2229-10-4. [DOI] [PMC free article] [PubMed] [Google Scholar]
- Maroufi A, Van Bockstaele E, De Loose M. Validation of reference genes for gene expression analysis in chicory (Cichorium intybus) using quantitative real-time PCR. BMC Mol Biol. 2010;11:15. doi: 10.1186/1471-2199-11-15. [DOI] [PMC free article] [PubMed] [Google Scholar]
- McDonough CM, Rooney LW, Serna-Saldivar SO. “The Millets”. Food science and technology: handbook of cereal science and technology, revised and expanded. 2. Boca Raton: CRC Press; 2000. [Google Scholar]
- Meng Y, Li N, Tian J, Gao J, Zhang C. Identification and validation of reference genes for gene expression studies in postharvest rose flower (Rosa hybrida) Sci Hortic. 2013;158:16–21. doi: 10.1016/j.scienta.2013.04.019. [DOI] [Google Scholar]
- Migocka M, Papierniak A. Identification of suitable reference genes for studying gene expression in cucumber plants subjected to abiotic stress and growth regulators. Mol Breeding. 2011;28:343–357. doi: 10.1007/s11032-010-9487-0. [DOI] [Google Scholar]
- Mittler R. Abiotic stress, the field environment and stress combination. Trends Plant Sci. 2006;11:15–19. doi: 10.1016/j.tplants.2005.11.002. [DOI] [PubMed] [Google Scholar]
- Mittler R, Blumwald E. Genetic engineering for modern agriculture: challenges and perspectives. Annu Rev Plant Biol. 2010;61:443–462. doi: 10.1146/annurev-arplant-042809-112116. [DOI] [PubMed] [Google Scholar]
- Nicot N, Hausman J-F, Hoffmann L, Evers D. Housekeeping gene selection for real-time RT-PCR normalization in potato during biotic and abiotic stress. J Exp Bot. 2005;56:2907–2914. doi: 10.1093/jxb/eri285. [DOI] [PubMed] [Google Scholar]
- Nrc NRC. Lost crops of Africa. 1. Washington: National Academy Press; 1996. [Google Scholar]
- Paolacci AR, Tanzarella OA, Porceddu E, Ciaffi M. Identification and validation of reference genes for quantitative RT-PCR normalization in wheat. BMC Mol Biol. 2009;10:11. doi: 10.1186/1471-2199-10-11. [DOI] [PMC free article] [PubMed] [Google Scholar]
- Perini P, Pasquali G, Margis-Pinheiro M, de Oliviera PRD, Revers LF. Reference genes for transcriptional analysis of flowering and fruit ripening stages in apple (Malus × domestica Borkh.) Mol Breeding. 2014;34:829–842. doi: 10.1007/s11032-014-0078-3. [DOI] [Google Scholar]
- Petriccione M, Mastrobuoni F, Zampella L, Scortichini M. Reference gene selection for normalization of RT-qPCR gene expression data from Actinidia deliciosa leaves infected with Pseudomonas syringae pv. actinidiae. Sci Rep. 2015;5:16961. doi: 10.1038/srep16961. [DOI] [PMC free article] [PubMed] [Google Scholar]
- Pfaffl MW, Tichopad A, Prgomet C, Neuvians TP. Determination of stable housekeeping genes, differentially regulated target genes and sample integrity: BestKeeper–Excel-based tool using pair-wise correlations. Biotech Lett. 2004;26:509–515. doi: 10.1023/B:BILE.0000019559.84305.47. [DOI] [PubMed] [Google Scholar]
- Radonić A, Thulke S, Mackay IM, Landt O, Siegert W, Nitsche A. Guideline to reference gene selection for quantitative real-time PCR. Biochem Biophys Res Commun. 2004;313:856–862. doi: 10.1016/j.bbrc.2003.11.177. [DOI] [PubMed] [Google Scholar]
- Raffaello T, Asiegbu FO. Evaluation of potential reference genes for use in gene expression studies in the conifer pathogen (Heterobasidion annosum) Mol Biol Rep. 2013;40:4605–4611. doi: 10.1007/s11033-013-2553-z. [DOI] [PubMed] [Google Scholar]
- Reddy PS, Reddy DS, Sharma KK, Bhatnagar-Mathur P, Vadez V. Cloning and validation of reference genes for normalization of gene expression studies in pearl millet [Pennisetum glaucum (L.) R. Br.] by quantitative real-time PCR Plant. Gene. 2015;1:35–42. [Google Scholar]
- Remans T, Smeets K, Opdenakker K, Mathijsen D, Vangronsveld J, Cuypers A. Normalisation of real-time RT-PCR gene expression measurements in Arabidopsis thaliana exposed to increased metal concentrations. Planta. 2008;227:1343–1349. doi: 10.1007/s00425-008-0706-4. [DOI] [PubMed] [Google Scholar]
- Rieu I, Powers SJ. Real-time quantitative RT-PCR: design, calculations, and statistics. Plant Cell. 2009;21:1031–1033. doi: 10.1105/tpc.109.066001. [DOI] [PMC free article] [PubMed] [Google Scholar]
- Rurinda J, Mapfumo P, van Wijk MT, Mtambanengwe F, Rufino MC, Chikowo R, Giller KE. Comparative assessment of maize, finger millet and sorghum for household food security in the face of increasing climatic risk. Eur J Agron. 2014;55:29–41. doi: 10.1016/j.eja.2013.12.009. [DOI] [Google Scholar]
- Saha P, Blumwald E. Assessing reference genes for accurate transcript normalization using quantitative real-time PCR in pearl millet [Pennisetum glaucum (L.) R. Br.] PLoS ONE. 2014;9:e106308. doi: 10.1371/journal.pone.0106308. [DOI] [PMC free article] [PubMed] [Google Scholar]
- Schmidt GW, Delaney SK. Stable internal reference genes for normalization of real-time RT-PCR in tobacco (Nicotiana tabacum) during development and abiotic stress. Mol Genet Genomics. 2010;283:233–241. doi: 10.1007/s00438-010-0511-1. [DOI] [PubMed] [Google Scholar]
- Shivhare R, Lata C. Selection of suitable reference genes for assessing gene expression in pearl millet under different abiotic stresses and their combinations. Sci Rep. 2016;6:23036. doi: 10.1038/srep23036. [DOI] [PMC free article] [PubMed] [Google Scholar]
- Shobana S, Krishnaswamy K, Sudha V, Malleshi N, Anjana R, Palaniappan L, Mohan V. Finger millet (Ragi, Eleusine coracana L.): a review of its nutritional properties, processing, and plausible health benefits. Adv Food Nutr Res. 2013;69:39. doi: 10.1016/B978-0-12-410540-9.00001-6. [DOI] [PubMed] [Google Scholar]
- Silver N, Best S, Jiang J, Thein SL. Selection of housekeeping genes for gene expression studies in human reticulocytes using real-time PCR. BMC Mol Biol. 2006;7:33. doi: 10.1186/1471-2199-7-33. [DOI] [PMC free article] [PubMed] [Google Scholar]
- Singh RK (2014) The studies of functional genomics of finger millet (Eleusine coracana (L.) Gaertn.). Thesis, Indian Agricultural Research Institute New Delhi. http://krishikosh.egranth.ac.in/handle/1/5810009810
- Singh P, Raghuvanshi RS. Finger millet for food and nutritional security. Afr J Food Sci. 2012;6:77–84. [Google Scholar]
- Stolf-Moreira R, et al. Identification of reference genes for expression analysis by real-time quantitative PCR in drought-stressed soybean. Pesquisa Agropecuaria Brasileira. 2011;46:58–65. doi: 10.1590/S0100-204X2011000100008. [DOI] [Google Scholar]
- Suzuki N, Rizhsky L, Liang H, Shuman J, Shulaev V, Mittler R. Enhanced tolerance to environmental stress in transgenic plants expressing the transcriptional coactivator multiprotein bridging factor 1c. Plant Physiol. 2005;139:1313–1322. doi: 10.1104/pp.105.070110. [DOI] [PMC free article] [PubMed] [Google Scholar]
- Tao Y, et al. Identification of novel and robust internal control genes from Volvariella volvacea that are suitable for RT-qPCR in filamentous fungi. Sci Rep. 2016;6:29236. doi: 10.1038/srep29236. [DOI] [PMC free article] [PubMed] [Google Scholar]
- Thellin O, et al. Housekeeping genes as internal standards: use and limits. J Biotechnol. 1999;75:291–295. doi: 10.1016/S0168-1656(99)00163-7. [DOI] [PubMed] [Google Scholar]
- Tu L, et al. Suitable internal control genes for qRT-PCR normalization in cotton fiber development and somatic embryogenesis. Chin Sci Bull. 2007;52:3110–3117. doi: 10.1007/s11434-007-0461-0. [DOI] [Google Scholar]
- Vandesompele J, De Preter K, Pattyn F, Poppe B, Van Roy N, De Paepe A, Speleman F. Accurate normalization of real-time quantitative RT-PCR data by geometric averaging of multiple internal control genes. Genome Biol. 2002;3(research0034):0031. doi: 10.1186/gb-2002-3-7-research0034. [DOI] [PMC free article] [PubMed] [Google Scholar]
- Volkov RA, Panchuk II, Schöffl F. Heat-stress-dependency and developmental modulation of gene expression: the potential of house-keeping genes as internal standards in mRNA expression profiling using real-time RT-PCR. J Exp Bot. 2003;54:2343–2349. doi: 10.1093/jxb/erg244. [DOI] [PubMed] [Google Scholar]
- Wan H, Zhao Z, Qian C, Sui Y, Malik AA, Chen J. Selection of appropriate reference genes for gene expression studies by quantitative real-time polymerase chain reaction in cucumber. Anal Biochem. 2010;399:257–261. doi: 10.1016/j.ab.2009.12.008. [DOI] [PubMed] [Google Scholar]
- Wan H, et al. Identification of reference genes for reverse transcription quantitative real-time PCR normalization in pepper (Capsicum annuum L.) Biochem Biophys Res Commun. 2011;416:24–30. doi: 10.1016/j.bbrc.2011.10.105. [DOI] [PubMed] [Google Scholar]
- Wang T, Hao R, Pan H, Cheng T, Zhang Q. Selection of suitable reference genes for quantitative real-time polymerase chain reaction in Prunus mume during flowering stages and under different abiotic stress conditions. J Am Soc Hortic Sci. 2014;139:113–122. [Google Scholar]
- Xiao X, Ma J, Wang J, Wu X, Li P, Yao Y. Validation of suitable reference genes for gene expression analysis in the halophyte Salicornia europaea by real-time quantitative PCR. Front Plant Sci. 2014;5:788. doi: 10.3389/fpls.2014.00388. [DOI] [PMC free article] [PubMed] [Google Scholar]
- Yan H-Z, Liou R-F. Selection of internal control genes for real-time quantitative RT-PCR assays in the oomycete plant pathogen Phytophthora parasitica. Fungal Genet Biol. 2006;43:430–438. doi: 10.1016/j.fgb.2006.01.010. [DOI] [PubMed] [Google Scholar]
- Yang Z, Chen Y, Hu B, Tan Z, Huang B. Identification and validation of reference genes for quantification of target gene expression with quantitative real-time PCR for tall fescue under four abiotic stresses. PLoS ONE. 2015;10:e0119569. doi: 10.1371/journal.pone.0119569. [DOI] [PMC free article] [PubMed] [Google Scholar]
- Yin Z, Ke X, Huang D, Gao X, Voegele RT, Kang Z, Huang L. Validation of reference genes for gene expression analysis in Valsa mali var. mali using real-time quantitative PCR. World J Microbiol Biotechnol. 2013;29:1563–1571. doi: 10.1007/s11274-013-1320-6. [DOI] [PubMed] [Google Scholar]
- Zakeri H, Bueckert RA, Schoenau J. Effects of nitrogen on reproductive duration and yield in lentil cultivars. J Plant Nutr. 2013;36:877–894. doi: 10.1080/01904167.2013.770019. [DOI] [Google Scholar]
- Zhang J, et al. Construction and application of EST library from Setaria italica in response to dehydration stress. Genomics. 2007;90:121–131. doi: 10.1016/j.ygeno.2007.03.016. [DOI] [PubMed] [Google Scholar]
- Zhu J, Zhang L, Li W, Han S, Yang W, Qi L. Reference gene selection for quantitative real-time PCR normalization in Caragana intermedia under different abiotic stress conditions. PLoS ONE. 2013;8:e53196. doi: 10.1371/journal.pone.0053196. [DOI] [PMC free article] [PubMed] [Google Scholar]
- Zhuang H, Fu Y, He W, Wang L, Wei Y. Selection of appropriate reference genes for quantitative real-time PCR in Oxytropis ochrocephala Bunge using transcriptome datasets under abiotic stress treatments. Front Plant Sci. 2015;6:475. doi: 10.3389/fpls.2015.00475. [DOI] [PMC free article] [PubMed] [Google Scholar]