

Abstract
Background
Breast cancer patients report a perception of increased muscle fatigue, which can persist following surgery and standardized therapies. In a clinical experiment, we tested the hypothesis that pathways regulating skeletal muscle fatigue are down‐regulated in skeletal muscle of breast cancer patients and that different muscle gene expression patterns exist between breast tumour subtypes. In a preclinical study, we tested the hypothesis that mammary tumour growth in mice induces skeletal muscle fatigue and that overexpression of the cytokine interleukin‐15 (IL‐15) can attenuate mammary tumour‐induced muscle fatigue.
Methods
Early stage non‐metastatic female breast cancer patients (n = 14) and female non‐cancer patients (n = 6) provided a muscle biopsy of the pectoralis major muscle during mastectomy, lumpectomy, or breast reconstruction surgeries. The breast cancer patients were diagnosed with either luminal (ER+/PR+, n = 6), triple positive (ER+/PR+/Her2/neu+, n = 5), or triple negative (ER−/PR−/Her2/neu−, n = 3) breast tumours and were being treated with curative intent either with neoadjuvant chemotherapy followed by surgery or surgery followed by standard post‐operative therapy. Biopsies were used for RNA‐sequencing to compare the skeletal muscle gene expression patterns between breast cancer patients and non‐cancer patients. The C57BL/6 mouse syngeneic mammary tumour cell line, E0771, was used to induce mammary tumours in immunocompetent mice, and isometric muscle contractile properties and fatigue properties were analysed following 4 weeks of tumour growth.
Results
RNA‐sequencing and subsequent bioinformatics analyses revealed a dysregulation of canonical pathways involved in oxidative phosphorylation, mitochondrial dysfunction, peroxisome proliferator‐activated receptor signalling and activation, and IL‐15 signalling and production. In a preclinical mouse model of breast cancer, the rate of muscle fatigue was greater in mice exposed to mammary tumour growth for 4 weeks, and this greater muscle fatigue was attenuated in transgenic mice that overexpressed the cytokine IL‐15.
Conclusions
Our data identify novel genes and pathways dysregulated in the muscles of breast cancer patients with early stage non‐metastatic disease, with particularly aberrant expression among genes that would predispose these patients to greater muscle fatigue. Furthermore, we demonstrate that IL‐15 overexpression can attenuate muscle fatigue associated with mammary tumour growth in a preclinical mouse model of breast cancer. Therefore, we propose that skeletal muscle fatigue is an inherent consequence of breast tumour growth, and this greater fatigue can be targeted therapeutically.
Keywords: Cachexia, Breast cancer, Fatigue, Transcriptome, IL‐15
Introduction
The concepts of muscle wasting and functional muscle impairment (i.e. fatigue) are included in the definition of cachexia.1, 2 The underlying mechanisms that can promote muscle wasting are not necessarily the same as those that can promote muscle fatigue,3 and patients may experience muscle fatigue without significant loss of skeletal muscle mass.4 Although a relatively small percentage of patients with breast cancer demonstrates evidence of body weight loss5 and reduced skeletal muscle strength,6, 7 a large percentage of breast cancer patients reports moderate to severe fatigue, which can be exacerbated during radiation therapy and chemotherapy3, 8, 9, 10 and can last for years after cancer treatments conclude.8, 9 Notably, one study reported that up to 99% of patients with breast cancer report some degree of fatigue.11 While both central and peripheral mechanisms of fatigue have been hypothesized to contribute to overall fatigue in cancer patients,12 breast cancer patients were able to improve muscle fatigue, strength, and lean body mass in response to structured exercise programmes suggesting peripheral mechanisms of fatigue can be improved in these patients.13, 14 The fact that fatigue is reported in such a high percentage of breast cancer patients suggests that the molecular alterations within skeletal muscle may initially predispose these patients to fatigue and not necessarily muscle mass loss. Therefore, knowledge of the molecular alterations of skeletal muscle during breast cancer is required to design interventions targeting muscle fatigue in this group of patients, which would theoretically affect patient mobility and quality of life.
The cytokine interleukin‐15 (IL‐15) has shown promise as an immunotherapy in early phase clinical trials in cancer patients.15 IL‐15 is critical for the maintenance of NK cell and CD8 T cell number and function (see reviews Waldmann and Tagaya16 and Fehniger and Caligiuri17). Our laboratory and others have shown that IL‐15 is also associated with enhancing the oxidative capacity of skeletal muscle.18, 19, 20, 21, 22 Specifically, mice genetically modified to have greater circulating levels of IL‐15 have a greater mitochondrial density in skeletal muscle, a greater resistance to contraction induced fatigue, and can perform longer on a motorized treadmill.18, 20, 23 Data from our laboratory and others support a direct effect of IL‐15 on skeletal muscle cells, as myotubes incubated with recombinant IL‐15 show dose‐dependent increases in gene expression for regulators of mitochondrial biogenesis, as well as greater mitochondrial density.19, 24 These data have been supported by studies in mice, in which IL‐15 promotes the expression of peroxisome proliferator‐activated receptor delta (PPARδ), PPARβ, and peroxisome proliferator‐activated receptor gamma coactivator 1‐alpha (PGC‐1α) in muscle.20 Therefore, IL‐15 may represent a supportive therapy for cancer patients with dual roles: enhancing immune system surveillance and attenuating muscle fatigue.
The purpose of this study was to characterize skeletal muscle gene expression patterns and regulatory networks in response to breast cancer and utilize bioinformatics to predict dysregulated pathways in muscle from breast cancer patients compared with muscle from non‐cancer patients. We tested the hypotheses that pathways regulating skeletal muscle fatigue are down‐regulated in muscle biopsies from breast cancer patients and that differential gene expression patterns exist between breast tumour subtypes. In partial support of this hypothesis, canonical pathways involved in oxidative phosphorylation, mitochondrial dysfunction, PPAR activation and signalling, and IL‐15 signalling and production were dysregulated in muscle from all breast cancer patients in our study compared with non‐cancer controls. However, we observed no differences in the skeletal muscle transcriptome between patients with three different breast tumour subtypes (i.e. luminal; triple positive; triple negative). In a subsequent preclinical mouse study, muscle fatigue that occurred in response to 4 weeks of mammary tumour growth was attenuated in transgenic mice that overexpressed IL‐15. Collectively, our data identify novel genes and pathways that are dysregulated in the muscle of breast cancer patients and provide significant support for the use of IL‐15‐based therapies to attenuate muscle fatigue associated with mammary tumour growth, regardless of the tumour molecular subtype.
Materials and methods
Muscle biopsies from breast cancer patients
The Institutional Review Board at West Virginia University approved all procedures, and eligible patients provided written consent for participation. Body mass, height, breast tumour type, oestrogen receptor (ER) percentage, progesterone receptor (PR) percentage, Her2/neu percentage, and any cancer‐related treatments were obtained from a prospective chart review. Muscle biopsies from the pectoralis major skeletal muscle of breast cancer patients (n = 14) were obtained at the time of mastectomy or lumpectomy surgeries. Approximately 75 mg of tissue was obtained from the muscle directly under the portion of the affected breast. Pectoralis major muscle biopsies from control patients were obtained from either patients with BRCA gene mutations without diagnosed cancer that were undergoing prophylactic mastectomy (n = 3) or women undergoing breast reconstruction surgery (n = 3). Biopsies were stored in RNA stabilization solution overnight at 4°C and then transferred to −80°C for storage.
RNA isolation, sequencing, and bioinformatics
Total RNA was isolated from muscle biopsies using Trizol and established methods.25 Libraries were constructed from 500 ng of total RNA using a stranded mRNA‐Seq kit (KAPA Biosciences, Wilmington, MA, USA). The concentration of each individual library was quantified with a Qubit fluorometer (Invitrogen, Carlsbad, CA, USA), and an estimate of size was determined using an Agilent Bioanalyzer with a High Sensitivity DNA chip (Agilent Genomics, Santa Clara, CA, USA). The libraries were pooled at an equimolar ratio and sequenced using a HiSeq 2500 sequencing system (Illumina, San Diego, CA, USA). Read quality was assessed using FastQC (http://www.bioinformatics.babraham.ac.uk/projects/fastqc/). The sequence reads were mapped to hg38 using STAR26 and then genes were quantified using featureCounts.27 Differential gene expression was analysed using DESeq2.28 Gene enrichment analysis was performed using GAGE29 against KEGG pathways and the Canonical Pathways feature of Ingenuity Pathway Analysis (IPA).
Experimental mice
Female C57BL/6 mice (stock #: 000664) were purchased from The Jackson Laboratory at 12 weeks of age (n = 30) and randomly assigned to three groups: control mice (Con; n = 8), mice that were euthanized following 2 weeks of tumour growth (2WK, n = 5) and mice that were euthanized following 4 weeks of tumour growth (4WK, n = 17). Muscle‐specific IL‐15 overexpressing transgenic mice (IL15TG) on a C57BL/6 background (stock #: 011002) were purchased from The Jackson Laboratory to establish a breeding colony. These transgenic mice overexpress a secretable form of IL‐15 within skeletal muscle, which results in greater circulating levels of this cytokine.30 Female IL15TG (n = 19) and B6 littermate control (B6 Con; n = 25) mice were used for studies between 14 and 16 weeks of age and were randomly assigned to the following groups: B6 Con (n = 8); B6 Con Tumour (n = 17); IL15TG (n = 7); and IL15TG Tumour (n = 12). Mice were exposed to mammary tumour growth for 4 weeks, as described in the succeeding texts. Mice were housed in the animal vivarium at West Virginia University in an ABSL‐2 level room following tumour cell implantation, at 22°C under a 12:12‐h light–dark cycle and received food and water ab libitum. The Institutional Animal Care and Use Committee at West Virginia University approved all animal experiments.
E0771 murine breast cancer cells
The E0771 murine mammary tumour cell line is a syngeneic medullary adenocarcinoma originally isolated from a spontaneous tumour in C57BL/6 mice.31, 32, 33 The cell line used in these studies expressed the luciferase enzyme, which allowed for in vivo tumour imaging after luciferin injection. E0771 cells were cultured using aseptic technique and maintained under standard mammalian culture conditions (37°C, 99% humidity, 5% CO2). Cells were maintained in high glucose Dulbecco's modified Eagle's medium supplemented with 10% foetal bovine serum to maintain active proliferation. Cells were passed via trypsinization using 0.25% trypsin/ethylenediaminetetraacetic acid in Hanks buffered saline solution. For cell implantation, 1 × 10⁶ E0771 cells were suspended in sterile phosphate buffered saline and orthotopically implanted into the mammary fat pad adjacent to the 4th nipple on the left side of experimental mice. E0771 cells were screened for the presence of contaminants prior to use (IDEXX Bioresearch).
In vivo tumour bioluminescence and volume measurements
Bioluminescent imaging of E0771 tumour cells in vivo was performed weekly following tumour cell implantation, using an IVIS Lumina II system. Mice were weighed, and 150‐mg kg−1 D‐luciferin substrate was injected into the peritoneal cavity. Mice were anaesthetized by inhalation of isoflurane (3% to induce; 1.5% to maintain anaesthesia), and in vivo images were acquired and analysed using Living Image software. The luciferase activity (photons s−1) was quantified and used to ensure progressive tumour growth and continued cell viability. Tumour volume was quantified using hand‐held callipers and the following formula: length (mm) × width2 (mm) × 0.5236.
Ex vivo muscle physiological analysis
Ex vivo muscle contractile properties were examined in the fast extensor digitorum longus (EDL) muscles of experimental mice using a commercially available muscle physiology system (Aurora Scientific, Ontario, Canada) as previously described.18, 34, 35 All experiments were performed in oxygenated Ringer's solution (100 mM NaCl, 4.7 mM KCl, 3.4 mM CaCl2, 1.2 mM KH2PO4, 1.2 mM MgSO4, 25 mM HEPES, and 5.5 mM D‐glucose) that was maintained at 22°C using a circulating water bath. Muscle length was adjusted to optimal length (Lo) based on the maximal twitch response. The force–frequency relationship was generated by stimulating muscles with increasing frequencies as follows: 1, 5, 10, 25, 50, 80, 100, 120, and 150 Hz. Muscle fatigue was analysed using a repeated stimulation protocol lasting 6 min and consisting of repeated 40‐Hz tetanic trains that occurred once every second and lasted 330 ms. The fatigue index was calculated as the per cent difference in force of each contraction from the initial contraction of the protocol and plotted as a fatigue curve.18, 36 LabChart software V7 (ADInstruments, Colorado Springs, CO, USA) was used to obtain the area under the fatigue curve (AUC) for each skeletal muscle analysed and used as a measure of total force production during the fatigue protocol. There were no differences in contractile properties when comparing muscles from the left and the right limb, so all muscles were combined for final analyses (data not shown).
Il15 gene expression analysis in skeletal muscle
Total RNA was isolated from the tibialis anterior skeletal muscles of experimental mice using Trizol reagent (Life Technologies, Grand Island, NY, USA), as previously described.25 RNA quantity and quality were assessed using a Nano‐Drop 2000 spectrophotometer (Thermo Fisher Scientific, Waltham, MA, USA); the 260/280 ratio for all samples used was between 1.8 and 2.1. Two micrograms of total RNA was reverse transcribed to make cDNA using a high‐capacity reverse transcription kit according to manufacturer's instructions (Life Technologies). Primers for murine Il15 were (forward) 5′‐TCTTCATGGTCCTTGCTGGT; (reverse) 5′‐GGCCTCTGTTTTAGGGAGACC. Amplification was performed using a solution consisting of 8.5 μL nuclease free H2O, 12.5 μL 2× Taq‐Pro Red Complete 1.5 mM MgCl2 master mix (Denville Scientific, Metuchen, NJ, USA), 1.0 μL forward primer, 1.0 μL reverse primer, and 2 μL of DNA template to make a 25‐μL total reaction volume. Primer pairs for IL‐15 were co‐amplified with primer pairs for 18S (Ambion, Austin, TX, USA). The number of PCR cycles was determined in preliminary experiments to ensure that analyses were performed in the linear range of amplification. Following amplification, each reaction was visualized following gel electrophoresis in 1.5% (w/v) agarose gels stained with ethidium bromide. PCR bands were quantified using the Image J software program (http://rsbweb.nih.gov/ij). Signals for the Il15 gene were normalized to the bands for 18S that were amplified in the same reaction.
Statistical analyses
All data were analysed using the GraphPad Prism 5.0 statistical software package (Graph Pad Software, La Jolla, CA, USA). Descriptive statistics were used to summarize the data, including mean ± standard deviation for continuous variables. All descriptive data and muscle contractile data were analysed using t‐test, one‐way analysis of variance, or two‐way analysis of variance with Tukey's post‐hoc test, where appropriate. The null hypothesis was rejected when P < 0.05.
Results
Patient characteristics
Patient characteristics are presented in Table 1. A total of 14 female breast cancer patients and 6 female non‐cancer patients were recruited for the study. There were no differences in age between the two groups (breast cancer: 56.5y ± 17.2; control: 44.2y ± 7.4; P = 0.1105). The sample of breast cancer patients included those diagnosed with luminal tumours (ER+/PR+; n = 6), triple positive tumours (ER+/PR+/Her2/neu+; n = 5), and triple negative tumours (n = 3); none of the breast cancer patients were diagnosed with metastatic disease. Six breast cancer patients received neoadjuvant chemotherapy prior to surgery and biopsy acquisition, while the remaining eight breast cancer patients received adjuvant chemotherapy following surgery and biopsy acquisition. Breast cancer patients had an average serum albumin of 3.7 ± 0.3 g dL−1, which is within the normal range. Breast cancer patients had an average body mass index (BMI) of 29.9 ± 10.5 kg m−2, which is considered overweight. Non‐cancer patients had an average BMI of 32.3 ± 9.1 kg m−2, which is considered class I obesity. There were no differences in BMI between groups (P = 0.6396).
Table 1.
Patient characteristics
| Sample ID | Tumour type | ER (%) | PR (%) | Her2/neu status | TNM stage | Treatment prior to biopsy | Age (years) | Serum albumin (g dL−1) | Body mass (kg) | BMI (kg m−2) |
|---|---|---|---|---|---|---|---|---|---|---|
| BC‐1 | Luminal | 100 | 99 | 1 | 1, 0, 0 | None | 74 | NA | 72.7 | 31.5 |
| BC‐2 | Luminal | 100 | 100 | 2 (FISH −) | 2, 0, 0 | None | 46 | 3.7 | 70.0 | 25.7 |
| BC‐3 | Luminal | 100 | 100 | 1 | 2, 1, 0 | None | 40 | 3.6 | 72.3 | 25.9 |
| BC‐4 | Luminal | 100 | 98 | 1 | 1c, 0, 0 | None | 86 | NA | 81.4 | 28.1 |
| BC‐5 | Luminal | 80 | 100 | 1 | 2, 0, 0 | None | 73 | 3.6 | 85.9 | 33.6 |
| BC‐6 | Luminal | 100 | 16 | 1 | 2, 0, 0 | Chemotherapy | 42 | 3.7 | 85.0 | 31.6 |
| BC‐7 | ER+/PR+/Her2/neu+ | 80 | 80 | 2 (FISH +) | 2, 0, 0 | Chemotherapy | 31 | 3.6 | 67.7 | 26.5 |
| BC‐8 | ER+/PR+/Her2/neu+ | 100 | 50 | 3 | 1, 0, 0 | None | 54 | 4.1 | 79.5 | 33.1 |
| BC‐9 | ER+/PR+/Her2/neu+ | 100 | 100 | 2 (FISH +) | 2, 0, 0 | Chemotherapy | 69 | 3.1 | 168.2 | 63.6 |
| BC‐10 | ER+/PR+/Her2/neu+ | 100 | 97 | 3 | 1, 0, 0 | None | 29 | 3.8 | 67.7 | 23.1 |
| BC‐11 | ER+/PR+/Her2/neu+ | 100 | 0 | 3 | 1, 0, 0 | None | 68 | 4.3 | 67.3 | 24.7 |
| BC‐12 | Triple negative/basal | 0 | 0 | 0 | 2, 0, 0 | Chemotherapy | 66 | 3.5 | 77.7 | 28.9 |
| BC‐13 | Triple negative/basal | 0 | 0 | 1 (FISH −) | 2, 0, 0 | Chemotherapy | 60 | 3.8 | 46.4 | 20.5 |
| BC‐14 | Triple negative/basal | 0 | 0 | 0 | 4, 2, 0 | Chemotherapy | 54 | 3.8 | 64.1 | 21.4 |
| CON‐1 | Control (BRCA1) | 34 | NA | 65.0 | 22.4 | |||||
| CON‐2 | Control (BRCA2) | 40 | NA | 74.5 | 26.1 | |||||
| CON‐3 | Control (BRCA2) | 44 | NA | 89.5 | 33.9 | |||||
| CON‐4 | Control | 48 | 3.9 | 65.0 | 25.4 | |||||
| CON‐5 | Control | 56 | NA | 109.5 | 41.4 | |||||
| CON‐6 | Control | 43 | 4.0 | 110.0 | 44.2 |
BC, breast cancer; BMI, body mass index; CON, control mice; ER, oestrogen receptor; PR, progesterone receptor.
The TNM Staging System is based on the extent of the tumor (T), the extent of spread to the lymph nodes (N), and the presence of metastasis (M). It is a clinical staging system used to describe tumors.
Transcriptional alterations in skeletal muscle of breast cancer patients
Total RNA was isolated from muscle biopsies and used to generate comparative gene expression profiles of skeletal muscle in breast cancer patients compared with non‐cancer patients. Principle components analysis allowed us to visualize the variability of all biopsies and revealed that the 14 biopsies from breast cancer patients clustered together, regardless of the tumour subtype. In contrast, the six biopsies from non‐cancer patients were considerably separated, with two biopsies clustering closely with the breast cancer patients. The biopsies from non‐cancer patients did not cluster based on those with BRCA gene mutations or those that had breast reconstruction surgery (Figure 1A). Based on this principle components analysis plot, the biopsies from breast cancer patients were analysed as one group, instead of separating them based on tumour subtype. Figure 1B shows a gene expression heat map for all biopsies based on the normalized expression of the 40 most differentially expressed genes. Compared with non‐cancer patients, there was a general down‐regulation of genes in the biopsies from breast cancer patients.
Figure 1.

Skeletal muscle transcriptome in breast cancer. (A) Principle components analysis plot showing that muscle biopsies from breast cancer patients (n = 14) cluster together regardless of tumour subtype, while biopsies from non‐cancer patients (n = 6) are more variable. This plot was the rationale for analysing all breast cancer samples together instead of dividing based on the specific breast tumour subtype. (B) Normalized gene expression heat map showing the differential expression patterns of the 40 most differentially expressed genes between breast cancer patients and non‐cancer patients. There is a down‐regulation of gene expression in muscle biopsies from breast cancer patients compared with muscle from non‐cancer patients. BC, breast cancer; CON, non‐cancer control.
RNA‐seq data were analysed using both IPA and GAGE pathway algorithms. Using GAGE software, the following KEGG pathways were the most down‐regulated in the muscles of breast cancer patients: ribosome (hsa03010; False Discovery Rate (FDR) = 3.02e−12); phagosome (hsa04145; FDR = 4.90e−05); oxidative phosphorylation (hsa00190; FDR = 3.83e−04); proteasome (hsa03050; FDR = 0.010); and PPAR signalling pathway (hsa03320; FDR = 0.031). The ubiquitin‐mediated proteolysis pathway was up‐regulated in this dataset (hsa04120; FDR = 6.81e−03). Table 2 presents the significantly dysregulated genes, identified using IPA, within the canonical pathways of oxidative phosphorylation, mitochondrial dysfunction, and PPAR activation and signalling. A total of nine genes were significantly down‐regulated within the oxidative phosphorylation and mitochondrial dysfunction category. Multiple genes within Complex I (NADH:ubiquinone), Complex IV (cytochrome c oxidase), and Complex V [adenosine triphosphate (ATP) synthase] of the mitochondrial electron transport chain (ETC) were down‐regulated ( Figure 2 ). Additionally, antioxidant genes (gpx4; sod3) were down‐regulated in muscle of breast cancer patients. Within the PPAR activation and signalling pathway, there were eight down‐regulated genes and eight up‐regulated genes (Table 2). Notably, the algorithm predicted a down‐regulation of a gene network that would be associated with an impairment of β‐oxidation within the mitochondria. Specifically, genes involved in energy homoeostasis and mitochondrial metabolism that were dysregulated in muscle of breast cancer patients include pparg, ppara, ppargc1a, foxo1, fasn, esr1, and cebpa. Genes associated with alterations in muscle differentiation and stem cell function, including klf4, ep300, prmt5, and srebf1 were also included in this gene network (Figure 3). Based on these gene alterations, we investigated if genes within the IL‐15 signalling and production canonical pathways were dysregulated. There were two down‐regulated genes and five up‐regulated genes, consistent with dysregulation of IL‐15 signalling and/or production (Table 2). Collectively, these data suggest that the muscle fatigue experienced by breast cancer patients may be at least partially attributable to dysregulation of the canonical pathways involved in oxidative phosphorylation, mitochondrial dysfunction, PPAR signalling, and IL‐15 signalling.
Table 2.
Dysregulated canonical pathways and associated genes in skeletal muscle biopsies from breast cancer patients
| Oxidative phosphorylation and mitochondrial dysfunction | ||
|---|---|---|
| Gene | Expression value | P‐value (adjusted) |
| Atp5d (ATP synthase F1 delta) | −0.54 | 0.04 |
| Atp13a2 (ATPase 13A2) | −0.47 | 0.03 |
| Cox6a1 (cytochrome c oxidase subunit 6A1) | −0.89 | 0.03 |
| Cox7a2 (cytochrome c oxidase subunit 7A2) | −0.54 | 0.04 |
| Gpx4 (glutathione peroxidase 4) | −0.55 | 0.03 |
| Hsd17b10 (hydroxysteroid 17‐beta dehydrogenase‐10) | −0.53 | 0.005 |
| Ndufb2 (NADH:ubiquinone oxidoreductase subunit B2) | −0.40 | 0.04 |
| Ndufs8 (NADH:ubiquinone oxidoreductase core subunit S8) | −0.53 | 0.03 |
| Sod3 (superoxide dismutase 3) | −1.28 | 0.002 |
| PPARα/RXRα activation and PPAR signalling | ||
| Gene | Expression value | P‐value (adjusted) |
| Acvr1c (activin A receptor type 1C) | −0.95 | 0.03 |
| Adcy5 (adenylyl cyclase type 5) | −0.94 | 0.01 |
| Adipoq (adiponectin) | −1.16 | 0.009 |
| Fasn (fatty acid synthase) | −1.04 | 0.02 |
| Pparg (peroxisome proliferator‐activated receptor gamma) | −1.17 | 0.004 |
| Prkar2b (cAMP‐dependent protein kinase type II‐beta) | −1.21 | 0.006 |
| Scand1 (SCAN domain containing protein 1) | −0.57 | 0.02 |
| Stat5a (signal transducer and activator of transcription 5A) | −0.61 | 0.03 |
| Acvr2a (activin A receptor type 2A) | +0.59 | 0.007 |
| Acvr2b (activin A receptor type 2B) | +0.65 | 0.03 |
| EP300 (histone acetyltransferase p300) | +0.44 | 0.03 |
| Il33 (interleukin‐33) | +0.44 | 0.03 |
| Irs1 (insulin receptor substrate 1) | +0.67 | 0.04 |
| Ncoa6 (nuclear receptor coactivator 6) | +0.34 | 0.05 |
| Plce1 (phospholipase C epsilon 1) | +0.71 | 0.03 |
| Tgfb2 (transforming growth factor beta 2) | +1.03 | 0.003 |
| Interleukin‐15 signalling and production | ||
| Gene | Expression value | P‐value (adjusted) |
| Klb (klotho beta) | −1.11 | 0.01 |
| Stat5a (signal transducer and activator of transcription 5A) | −0.61 | 0.03 |
| Frs2 (fibroblast growth factor receptor substrate 2) | +0.59 | 0.03 |
| Gab1 (GRB2‐associated binding protein 1) | +0.66 | 0.04 |
| Irs1 (insulin receptor substrate 1) | +0.67 | 0.04 |
| Prkci (protein kinase c iota) | +0.57 | 0.02 |
| Stat1 (signal transducer and activator of transcription 1) | +0.53 | 0.01 |
ATP, adenosine triphosphate; PPAR, peroxisome proliferator‐activated receptor.
Figure 2.

Canonical pathways of oxidative phosphorylation and mitochondrial dysfunction. The canonical pathways of oxidative phosphorylation and mitochondrial dysfunction were dysregulated in the muscle samples from breast cancer patients compared with non‐cancer controls. The shading pattern of the individual electron transport chain complexes is used as an indicator of the degree of predicted dysfunction, with a greater percentage of light shading suggestive of greater dysfunction. Individual genes that were significantly down‐regulated are identified within the specific electron transport chain complex. Specific dysregulated genes were identified using DESqe2, while the canonical pathways of oxidative phosphorylation and mitochondrial dysfunction were identified using Ingenuity Pathway Analysis software. ATP, adenosine triphosphate; IMM, Inner Mitochondrial Membrane.
Figure 3.

Regulatory gene network upstream of beta‐oxidation in mitochondria. Multiple genes involved in energy homoeostasis and mitochondrial metabolism were down‐regulated, while genes associated with muscle differentiation and stem cell function were up‐regulated in muscle from breast cancer patients. This specific gene network predicts an impairment in beta‐oxidation within the mitochondria. Blue shading/arrows indicate down‐regulation, and orange shading/lines indicate up‐regulation.
Skeletal muscle dysfunction in wild type mice in response to E0771 mammary tumours
We utilized a mouse syngeneic breast tumour cell line to determine whether mammary tumour growth directly contributes to skeletal muscle fatigue. Following cell implantation, in vivo bioluminescence, based on luciferase enzyme activity, and tumour volume were monitored weekly. As seen in Figure 4A, tumour size and tumour cell viability progressively increased through 4 weeks. Bioluminescence, quantified as total flux, peaked at the end of week 4 (Figure 4B). Tumour volume averaged 397.3 ± 75.5 mm3 after 2 weeks and 3816.5 ± 2987.6 mm3 after 4 weeks of tumour growth. Bioluminescent analysis also demonstrated positive metastases in the lungs of mice starting at 2 weeks after tumour cell implantation (data not shown). Tumour growth was associated with a progressive loss of overall body mass (Figure 4C) and individual skeletal muscle mass (Table 3). Gene expression for il15 within skeletal muscle of tumour‐bearing mice declined in response to tumour growth, with the lowest il15 gene expression observed in muscles from mice after 4 weeks of tumour growth (Figure 4D). Ex vivo skeletal muscle stimulation revealed a greater rate of muscle fatigue upon repeated contraction in muscles from mice after 4 weeks of tumour growth compared with muscles from control mice and mice after 2 weeks of tumour growth (Figure 4E). The AUC, representative of the total amount of contractile force produced during the fatigue protocol, was also significantly lower in muscles from mice after 4 weeks of tumour growth compared with muscles from control mice (Figure 4F). Maximal isometric force production was significantly lower in muscles from mice after 4 weeks of tumour growth compared with muscles from control mice and mice after 2 weeks of tumour growth (Figure 4G). Collectively, these data demonstrate that E0771 mammary tumour growth contributes to significant reductions in body weight and muscle mass as well as skeletal muscle dysfunction in the form of greater muscle fatigue and reduced force output.
Figure 4.
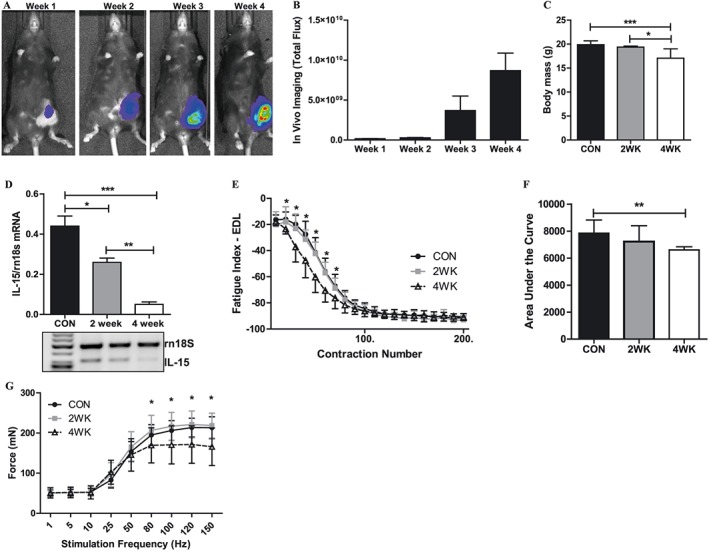
Mammary tumour‐induced skeletal muscle dysfunction in wild type mice. (A) Representative live in vivo bioluminescent images of luciferase‐containing E0771 tumour cells through 4 weeks of tumour growth in the mammary fat pads of wild type mice. (B) Bioluminescent quantification of luciferase‐containing E0771 tumour cells through 4 weeks of tumour growth in the mammary fat pads of wild type mice. (C) Changes in body weight in wild type after 4 weeks of tumour growth in the mammary fat pads of wild type mice. These weights do not include the weight of the tumour, which was resected. (D) Differential expression of the Il15 gene in skeletal muscles of wild type mice with no tumour, and following 2 and 4 weeks of tumour growth in the mammary fat pads. (E) Ex vivo skeletal muscle fatigue curves from wild type mice with no tumour, and following 2 and 4 weeks of tumour growth in the mammary fat pads. The leftward shift of the fatigue curve in the 4WK mice is indicative of a greater rate of muscle fatigue. (F) Quantification of the area under the fatigue curve in muscles from wild type mice with no tumour, and following 2 and 4 weeks of tumour growth in the mammary fat pads. (G) Isometric force output at increasing stimulation frequencies in muscles from wild type mice with no tumour, and following 2 and 4 weeks of tumour growth in the mammary fat pads. *P < 0.05; **P < 0.001; ***P < 0.0001. CON, control mice; EDL, extensor digitorum longus; IL‐15, interleukin‐15.
Table 3.
Muscle weights following E0771 tumour growth
| E0771 tumour growth in C57BL/6 WT mice | ||||
|---|---|---|---|---|
| Control (n = 8) | 2WK (n = 5) | 4WK (n = 10) | ||
| EDL (mg) | 10.6 ± 1.2 | 9.9 ± 1.0 | 7.8 ± 1.1a , b | |
| EDL (mg g−1) | 0.50 ± 0.06 | 0.51 ± 0.05 | 0.46 ± 0.05a , b | |
| vTA (mg) | 53.1 ± 6.1 | 48.5 ± 4.0 | 37.9 ± 4.7a , b | |
| TA (mg g−1) | 2.7 ± 0.3 | 2.5 ± 0.2 | 2.2 ± 0.5a , b | |
| Gastroc (mg) | 114.7 ± 9.4 | 112.5 ± 9.9 | 89.5 ± 13.8a , b | |
| Gastroc (mg g−1) | 5.8 ± 0.4 | 5.8 ± 0.6 | 5.3 ± 0.7a , b | |
| E0771 tumour growth in IL15TG mice | ||||
| B6 Con (n = 8) | B6 Con tumour (n = 17) | IL15TG (n = 7) | IL15TG tumour (n = 12) | |
| EDL (mg) | 9.2 ± 1.2 | 8.2 ± 0.93c | 8.8 ± 0.67 | 6.7 ± 0.63d |
| EDL (mg g−1) | 0.45 ± 0.01 | 0.46 ± 0.01 | 0.45 ± 0.01 | 0.38 ± 0.01d |
| TA (mg) | 50.2 ± 1.9 | 41.7 ± 0.65c | 46.9 ± 2.2 | 36.2 ± 0.68d |
| TA (mg g−1) | 2.4 ± 0.08 | 2.4 ± 0.04 | 2.4 ± 0.10 | 2.0 ± 0.04d |
| Gastroc (mg) | 108.7 ± 3.4 | 93.9 ± 1.7c | 77.3 ± 3.9 | 70.9 ± 2.8 |
| Gastroc (mg g −1) | 5.3 ± 0.11 | 5.3 ± 0.13 | 3.9 ± 0.18 | 4.0 ± 0.15 |
EDL, extensor digitorum longus; TA, Tibialis Anterior muscle; WT, wild type.
Control significantly different from 4WK.
2WK significantly different from 4WK.
B6 Con significantly different from B6 Con tumour.
IL15TG significantly different from IL15TG tumour.
Skeletal muscle function in IL15TG mice in response to E0771 mammary tumours
Based on bioinformatics analysis and our previously published data on IL‐15 in skeletal muscle, we investigated the therapeutic efficacy of overexpressing IL‐15 in a mouse model of breast cancer on measures of muscle function. As seen in Figure 5A and 5B, there were no differences in the tumour growth or cell viability of E0771 tumour cells in IL15TG mice compared with littermate controls. Additionally, both IL15TG and littermate control mice lost a significant amount of overall body mass (Figure 5C) and skeletal muscle mass (Table 3) in response to tumour growth. Tumour growth in B6 Con mice was associated with a greater rate of muscle fatigue (Figure 5D). The AUC was significantly lower in tumour‐bearing B6 Con mice compared with non‐tumour B6 Con mice (Figure 5E). Maximal isometric muscle force output was significantly lower in tumour‐bearing B6 Con mice compared with non‐tumour B6 Con mice (Figure 5F). Therefore, the muscle dysfunction in response to E0771 tumour growth was similar in both C57BL/6 wild type mice and in B6 Con mice.
Figure 5.
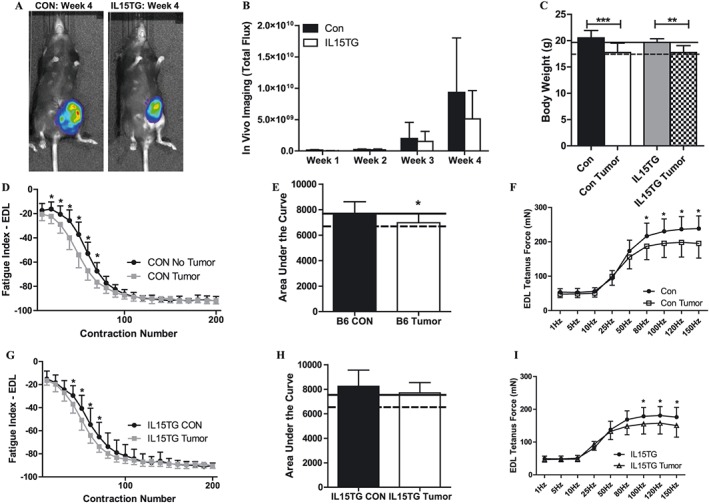
Skeletal muscle function in IL15TG mice following mammary tumour growth. (A) Representative live in vivo bioluminescent images of luciferase‐containing E0771 tumour cells after 4 weeks of tumour growth in the mammary fat pads of B6 littermate control and IL15TG mice. (B) Bioluminescent quantification of luciferase‐containing E0771 tumour cells through 4 weeks of tumour growth in the mammary fat pads of B6 littermate control and IL15TG mice. (C) Changes in body weight in wild type after 4 weeks of tumour growth in the mammary fat pads of wild type mice. These weights do not include the weight of the tumour, which was resected. (D) Ex vivo skeletal muscle fatigue curves from B6 littermate control mice with no tumour, and following 4 weeks of tumour growth in the mammary fat pads. The leftward shift of the fatigue curve in the CON tumour mice is indicative of a greater rate of muscle fatigue. (E) Quantification of the area under the fatigue curve in muscles from B6 littermate control mice with no tumour, and following 4 weeks of tumour growth in the mammary fat pads. (F) Isometric force output at increasing stimulation frequencies in muscles from B6 littermate control mice with no tumour, and following 4 weeks of tumour growth in the mammary fat pads. (G) Ex vivo skeletal muscle fatigue curves from IL15TG mice with no tumour, and following 4 weeks of tumour growth in the mammary fat pads. (H) Quantification of the area under the fatigue curve in muscles from IL15TG mice with no tumour, and following 4 weeks of tumour growth in the mammary fat pads. (F) Isometric force output at increasing stimulation frequencies in muscles from IL15TG mice with no tumour, and following 4 weeks of tumour growth in the mammary fat pads. In Figures C, E, and F, solid lines represent the average value from wild type non‐tumour‐bearing mice, and dotted lines represent the average value from wild type mice following 4 weeks of tumour growth. *P < 0.05; **P < 0.001; ***P < 0.0001. EDL, extensor digitorum longus.
Tumour growth in IL15TG mice was associated with an altered muscle fatigue response from that observed in B6 Con mice (Figure 5G), resulting in no significant difference in the AUC calculated in muscles from IL15TG tumour‐bearing mice and IL15TG non‐tumour mice. Furthermore, the average AUC of muscles from IL15TG tumour‐bearing mice was comparable with muscles from wild type non‐tumour‐bearing control mice (Figure 5H). However, maximal isometric muscle force output was significantly lower in IL15TG tumour‐bearing mice compared with IL15TG non‐tumour mice (Figure 5I). These data demonstrate that IL‐15 overexpression is associated with an attenuation of the greater muscle fatigue observed in response to E0771 mammary tumours. However, IL15TG mice were not protected from the E0771 mammary tumour effects on overall body weight, skeletal muscle mass, and maximal isometric force output.
Discussion
Inherent in the definition of cancer cachexia is the concept of fatigue1, 2 and a significant percentage of patients with breast cancer report moderate to severe muscle fatigue.8, 9, 10, 11 The occurrence of muscle fatigue in cancer patients is often considered a side effect of either radiation therapy or chemotherapy.37, 38 However, fatigue can occur due to tumour growth itself or as the result of cancer treatments.39 To the Authors' knowledge, the skeletal muscle transcriptome in response to breast cancer presented in this manuscript is novel in this specific cancer type. Notably, we demonstrate that canonical pathways involved with oxidative phosphorylation and mitochondrial dysfunction are dysregulated in the skeletal muscle of breast cancer patients and that these molecular alterations in muscle were detected while the breast cancer was in the early stages and at a time when patients were being treated with curative intent. The patient population that we used in this study consisted of eight women that did not receive any treatments prior to surgery and biopsy acquisition (i.e. adjuvant setting) and six women that received neoadjuvant chemotherapy prior to surgery and biopsy acquisition. Additionally, our population consisted of women with luminal tumours, triple positive tumours, and triple negative tumours. Therefore, our data suggest that skeletal muscle is quite responsive to breast tumour growth and that common transcriptional alterations in muscle occur regardless of the specific breast tumour subtype and whether chemotherapy has been initiated. These data are strengthened by the fact that we observed these alterations despite a control group that displayed considerable variability with respect to gene expression patterns in muscle. Collectively, we suggest that gene networks that regulate muscle fatigue are dysregulated in the early stages of breast tumour growth, regardless of tumour subtype, and that these alterations can occur prior to the onset of muscle wasting.
The transcriptional profile in skeletal muscle in response to breast cancer contrasts with the muscle transcriptome associated with oesophageal, gastric, and pancreatic cancer.40 In a study by Gallagher et al.,40 patients reported an average weight loss of 7.4% at the time of the first biopsy, which increased to 13.8% at follow‐up. The skeletal muscle transcriptome in these cancer patients, which had lost body weight, suggested a down‐regulation of both anabolic and catabolic processes that was reversed with resection of the tumour.40 The transcriptional changes in skeletal muscle in that particular study are, therefore, consistent with a transcriptional program that supports muscle atrophy as a result of tumour growth and is reflected in overall reductions in body weight. One study estimated that 42% of oesophageal cancer patients, 42% of gastric cancer patients, and 35% of pancreatic patients experience body weight loss while only 24% of breast cancer patients experience body weight loss.5 In our sample of breast cancer patients, the average BMI at the time of surgery and biopsy acquisition was 29.9 kg m−2, which is considered overweight.41 Although we are not able to report whether these breast cancer patients had lost weight, the albumin levels reported in this specific group of breast cancer patients were within the normal range and suggest that these patients were not experiencing any significant nutritional deficits.42 The skeletal muscle transcriptional changes in our breast cancer patients reflect alterations in pathways that regulate skeletal muscle fatigue, such that oxidative phosphorylation is significantly down‐regulated. In addition, PPAR signalling is down‐regulated, and this is predicted to reduce β‐oxidation within the mitochondria. Collectively, this presents the intriguing hypothesis that cancer cachexia can take different forms based on the specific cancer type. In cancers associated with significant body weight and muscle mass loss, the gene expression profile of muscle is one that reflects pathways associated with muscle atrophy, which would then contribute to decreased muscle strength and force production. In contrast, in cancers associated with greater muscle fatigue and minimal body weight or muscle mass loss, the gene expression profile of muscle reflects down‐regulation of pathways associated with oxidative phosphorylation, and this would be associated with muscle dysfunction in the form of greater muscle fatigue. To further test this hypothesis, we are in the process of expanding our muscle biopsy collection to include RNA‐seq from Her2/neu patients and to include proteomic analyses of muscle from breast cancer patients to present a comprehensive molecular signature of skeletal muscle in response to breast cancer.
Multiple genes within the mitochondrial ETC, specifically within complexes I, IV and V, were down‐regulated, which would potentially contribute to mitochondrial dysfunction and reduced ATP available to fuel muscle contraction.43, 44 Additionally, alterations in energy metabolism through the down‐regulation of PPAR‐related signalling would also contribute to altered mitochondrial function.24, 45, 46 Collectively, the down‐regulation of mitochondrial genes as well as the predicted down‐regulation of β‐oxidation through alterations of a gene network including PPARα, PPARγ, and PGC‐1α provides a biochemical mechanism for the reported greater fatigue experienced in breast cancer patients.8, 9, 10, 11 Preclinical models of cancer have supported the concept of mitochondrial dysfunction in response to tumour growth.47, 48, 49, 50 In response to Lewis lung carcinoma in mice, mitochondrial ATP synthesis was decreased with tumour progression.48 A decrease in ATP production may occur through increased uncoupling of ATP production within pathways of oxidative phosphorylation in skeletal muscle.48, 49 Exposing C2C12 myotubes to conditioned media from Lewis lung carcinoma cells altered the function of the mitochondrial ETC and increased mitochondrial reactive oxygen species production.44 Therefore, tumour growth has the potential to induce mitochondrial dysfunction, leading to reduced ATP production within skeletal muscle and greater muscle fatigue. In our preclinical study of mammary cancer, muscle fatigue was tested ex vivo, which allows for the direct examination of fatigue in response to muscle contractions without confounding effects of alterations in muscle blood flow, oxygenation, or temperature that could contribute to altered fatigue in vivo. The EDL muscle was significantly more fatigable following 4 weeks of mammary tumour growth compared with muscles from control mice and following 2 weeks of tumour growth. Notably, the shape of the fatigue curve in muscles following 4 weeks of tumour growth, especially during the first 70 s of the fatigue protocol, was significantly different and dropped sharply in response to muscle contractions. These data suggest that mammary tumour growth induces muscle fatigue that is directly due to alterations within the muscle itself, providing a functional outcome for the cellular mechanisms previously identified.44, 47, 48, 49
In the current study, skeletal muscle il15 gene expression was lower in tumour‐bearing wild type mice, especially after 4 weeks of tumour growth. Our laboratory,18, 19 and others,20, 21 have presented data to support the hypothesis that greater IL‐15 is associated with increased mitochondrial density in skeletal muscle and, therefore, a greater oxidative capacity of skeletal muscle. We tested this mechanism in our mouse model of breast cancer using muscle‐specific IL‐15 overexpressing transgenic mice and demonstrated that muscle force output with repeated contractions (i.e. fatigue) is spared in these mice following mammary tumour growth. Specifically, EDL muscles from IL15TG mice following 4 weeks of mammary tumour growth produced more aggregate force during the fatigue protocol when compared with non‐tumour‐bearing wild type control and littermate control mice. The AUC calculated from the fatigue curves of muscles from IL15TG mice following 4 weeks of tumour growth was similar to AUC from control non‐tumour‐bearing mice. In a prior study, IL15TG mice had greater times to exhaustion during a treadmill test and increased molecular markers consistent with changes in oxidative capacity of muscle.20 Additionally, muscles from IL15RαKO mice, which also have a greater circulating level of IL‐15, were resistant to ex vivo induced muscle fatigue.18 Data in muscle cells and in transgenic mice support the ability of IL‐15 to enhance the expression of multiple regulators of mitochondrial biogenesis, including PPARδ, PPARβ, and PGC‐1α,19, 20, 24 which we found to be down‐regulated in breast cancer patients. These data support the notion that elevating IL‐15 levels within the muscle and in the circulation can enhance the oxidative capacity of skeletal muscle, which can be used as a therapeutic strategy to attenuate fatigue in response to breast tumour growth. Additional studies are in progress in our laboratory to move from the use of genetically modified mice and determine proper dosing in vivo of IL‐15 for these muscle‐specific effects.
In summary, our data support the hypothesis that breast cancer patients are susceptible to greater muscle fatigue due to molecular alterations within skeletal muscle, which occurred regardless of breast tumour subtype or whether chemotherapy was initiated prior to biopsy collection. Furthermore, these molecular alterations in muscle were detected while the breast cancer was at its earliest stage, and patients were being treated with curative intent. Two prediction algorithms suggested a dysregulation of the canonical pathways involved in oxidative phosphorylation, mitochondrial dysfunction, and PPAR signalling and activation. Because these muscle‐specific transcriptional changes in response to breast cancer differ from those reported in patients with oesophageal, gastric, and pancreatic cancers that had lost weight,40 we suggest that skeletal muscle responses to cancer can differ between cancer types, and this would be associated with different functional outcomes in skeletal muscle. In cancer patients that have lost significant amounts of body weight and/or muscle mass, pathways in skeletal muscle would promote muscle atrophy and alterations in protein turnover, which would predispose these patients to lower strength levels.40 In contrast, in patients that do not experience significant body weight or muscle mass loss, pathways in skeletal muscle could promote alterations in mitochondrial function, which would predispose these patients to greater muscle fatigue.4 Bioinformatics analysis also suggested a dysregulation of IL‐15 signalling and activation in muscle of breast cancer patients, and il15 gene expression was lower in muscles from our mouse model of mammary cancer. Skeletal muscle overexpression of IL‐15, and subsequent secretion into the circulation, attenuated muscle fatigue in response to mammary tumour growth in mice, suggesting that IL‐15‐based therapies may be useful to counter breast cancer‐associated muscle fatigue. Therefore, we propose that skeletal muscle fatigue is an inherent consequence of breast tumour growth, which can manifest in early stage disease without significant loss of body weight or muscle mass, and has the potential to be targeted therapeutically, as our preclinical data suggest.
Conflict of interest
All Authors of this manuscript (J.B., S.M., H.H., A.I., C.M., M.D., and E.P.) declare no conflicts of interest.
Acknowledgements
The authors certify that they comply with the ethical guidelines for authorship and publishing of the Journal of Cachexia, Sarcopenia and Muscle.51
The Authors thank Jessica Partin, MD, and Christin Ueno, MD, for assistance with acquisition of muscle biopsies; Linda Metheny‐Barlow, PhD, for providing the E0771 tumour cells for this project; and Kevin Fox, MD, and Hannah E. Wilson for thoughtful critique of the manuscript.
This research was supported by grants from the American Cancer Society (IRG: 09‐061‐04) and WVCTSI through the National Institute of General Medical Sciences of the National Institutes of Health (U54GM104942) awarded to E.P. Additional support for this research was provided by the Animal Models and Imaging Core Facility (S10RR026378 and U54GM104942) and West Virginia IDeA Biomedical Research Excellence (WV‐INBRE) (P20GM103434).
Bohlen, J. , McLaughlin, S. L. , Hazard‐Jenkins, H. , Infante, A. M. , Montgomery, C. , Davis, M. , and Pistilli, E. E. (2018) Dysregulation of metabolic‐associated pathways in muscle of breast cancer patients: preclinical evaluation of interleukin‐15 targeting fatigue. Journal of Cachexia, Sarcopenia and Muscle, 9: 701–714. 10.1002/jcsm.12294.
References
- 1. Fearon K, Strasser F, Anker SD, Bosaeus I, Bruera E, Fainsinger RL, et al. Definition and classification of cancer cachexia: an international consensus. Lancet Oncol 2011;12:489–495. [DOI] [PubMed] [Google Scholar]
- 2. Evans WJ, Morley JE, Argiles J, Bales C, Baracos V, Guttridge D, et al. Cachexia: a new definition. Clin Nutr 2008;27:793–799. [DOI] [PubMed] [Google Scholar]
- 3. Evans WJ, Lambert CP. Physiological basis of fatigue. Am J Phys Med Rehabil 2007;86:S29–S46. [DOI] [PubMed] [Google Scholar]
- 4. Neefjes ECW, van den Hurk RM, Blauwhoff‐Buskermolen S, van der Vorst M, Becker‐Commissaris A, de van der Schueren MAE, et al. Muscle mass as a target to reduce fatigue in patients with advanced cancer. J Cachexia Sarcopenia Muscle 2017;8:623–629. [DOI] [PMC free article] [PubMed] [Google Scholar]
- 5. Fox KM, Brooks JM, Gandra SR, Markus R, Chiou CF. Estimation of cachexia among cancer patients based on four definitions. J Oncol 2009;2009:693458. [DOI] [PMC free article] [PubMed] [Google Scholar]
- 6. Klassen O, Schmidt ME, Ulrich CM, Schneeweiss A, Potthoff K, Steindorf K, et al. Muscle strength in breast cancer patients receiving different treatment regimes. J Cachexia Sarcopenia Muscle 2017;8:305–316. [DOI] [PMC free article] [PubMed] [Google Scholar]
- 7. Neil‐Sztramko SE, Kirkham AA, Hung SH, Niksirat N, Nishikawa K, Campbell KL. Aerobic capacity and upper limb strength are reduced in women diagnosed with breast cancer: a systematic review. J Physiother 2014;60:189–200. [DOI] [PubMed] [Google Scholar]
- 8. Bower JE, Ganz PA, Desmond KA, Rowland JH, Meyerowitz BE, Belin TR. Fatigue in breast cancer survivors: occurrence, correlates, and impact on quality of life. J Clin Oncol 2000;18:743–753. [DOI] [PubMed] [Google Scholar]
- 9. Cella D, Lai JS, Chang CH, Peterman A, Slavin M. Fatigue in cancer patients compared with fatigue in the general United States population. Cancer 2002;94:528–538. [DOI] [PubMed] [Google Scholar]
- 10. Curt GA, Breitbart W, Cella D, Groopman JE, Horning SJ, Itri LM, et al. Impact of cancer‐related fatigue on the lives of patients: new findings from the Fatigue Coalition. Oncologist 2000;5:353–360. [DOI] [PubMed] [Google Scholar]
- 11. Blesch KS, Paice JA, Wickham R, Harte N, Schnoor DK, Purl S, et al. Correlates of fatigue in people with breast or lung cancer. Oncol Nurs Forum 1991;18:81–87. [PubMed] [Google Scholar]
- 12. Powers SK, Lynch GS, Murphy KT, Reid MB, Zijdewind I. Disease‐induced skeletal muscle atrophy and fatigue. Med Sci Sports Exerc 2016;48:2307–2319. [DOI] [PMC free article] [PubMed] [Google Scholar]
- 13. Mustian KM, Peppone L, Darling TV, Palesh O, Heckler CE, Morrow GR. A 4‐week home‐based aerobic and resistance exercise program during radiation therapy: a pilot randomized clinical trial. J Support Oncol 2009;7:158–167. [PMC free article] [PubMed] [Google Scholar]
- 14. Courneya KS, Segal RJ, Mackey JR, Gelmon K, Reid RD, Friedenreich CM, et al. Effects of aerobic and resistance exercise in breast cancer patients receiving adjuvant chemotherapy: a multicenter randomized controlled trial. J Clin Oncol 2007;25:4396–4404. [DOI] [PubMed] [Google Scholar]
- 15. Conlon KC, Lugli E, Welles HC, Rosenberg SA, Fojo AT, Morris JC, et al. Redistribution, hyperproliferation, activation of natural killer cells and CD8 T cells, and cytokine production during first‐in‐human clinical trial of recombinant human interleukin‐15 in patients with cancer. J Clin Oncol 2015;33:74–82. [DOI] [PMC free article] [PubMed] [Google Scholar]
- 16. Waldmann TA, Tagaya Y. The multifaceted regulation of interleukin‐15 expression and the role of this cytokine in NK cell differentiation and host response to intracellular pathogens. Annu Rev Immunol 1999;17:19–49. [DOI] [PubMed] [Google Scholar]
- 17. Fehniger TA, Caligiuri MA. Interleukin 15: biology and relevance to human disease. Blood 2001;97:14–32. [DOI] [PubMed] [Google Scholar]
- 18. Pistilli EE, Bogdanovich S, Garton F, Yang N, Gulbin JP, Conner JD, et al. Loss of IL‐15 receptor alpha alters the endurance, fatigability, and metabolic characteristics of mouse fast skeletal muscles. J Clin Invest 2011;121:3120–3132. [DOI] [PMC free article] [PubMed] [Google Scholar]
- 19. O'Connell GC, Pistilli EE. Interleukin‐15 directly stimulates pro‐oxidative gene expression in skeletal muscle in‐vitro via a mechanism that requires interleukin‐15 receptor alpha. Biochem Biophys Res Commun 2015;458:614–619. [DOI] [PubMed] [Google Scholar]
- 20. Quinn LS, Anderson BG, Conner JD, Wolden‐Hanson T. IL‐15 overexpression promotes endurance, oxidative energy metabolism, and muscle PPARdelta, SIRT1, PGC‐1alpha, and PGC‐1beta expression in male mice. Endocrinology 2013;154:232–245. [DOI] [PMC free article] [PubMed] [Google Scholar]
- 21. Quinn LS, Anderson BG, Conner JD, Wolden‐Hanson T, Marcell TJ. IL‐15 is required for postexercise induction of the pro‐oxidative mediators PPARdelta and SIRT1 in male mice. Endocrinology 2014;155:143–155. [DOI] [PMC free article] [PubMed] [Google Scholar]
- 22. Pistilli EE, Quinn LS. From anabolic to oxidative: reconsidering the roles of IL‐15 and IL‐15Ralpha in skeletal muscle. Exerc Sport Sci Rev 2013;41:100–106. [DOI] [PMC free article] [PubMed] [Google Scholar]
- 23. O'Connell G, Guo G, Stricker J, Quinn LS, Ma A, Pistilli EE. Muscle‐specific deletion of exons 2 and 3 of the IL15RA gene in mice: effects on contractile properties of fast and slow muscles. J Appl Physiol 1985;118:437–448. [DOI] [PubMed] [Google Scholar]
- 24. Thornton SM, Krolopp JE, Abbott MJ. IL‐15 mediates mitochondrial activity through a PPARdelta‐dependent‐PPARalpha‐independent mechanism in skeletal muscle cells. PPAR Res 2016;2016:5465804. 10.1155/2016/5465804 [DOI] [PMC free article] [PubMed] [Google Scholar]
- 25. Pistilli EE, Jackson JR, Alway SE. Death receptor‐associated pro‐apoptotic signaling in aged skeletal muscle. Apoptosis 2006;11:2115–2126. [DOI] [PMC free article] [PubMed] [Google Scholar]
- 26. Dobin A, Davis CA, Schlesinger F, Drenkow J, Zaleski C, Jha S, et al. STAR: ultrafast universal RNA‐seq aligner. Bioinformatics 2013;29:15–21. [DOI] [PMC free article] [PubMed] [Google Scholar]
- 27. Liao Y, Smyth GK, Shi W. featureCounts: an efficient general purpose program for assigning sequence reads to genomic features. Bioinformatics 2014;30:923–930. [DOI] [PubMed] [Google Scholar]
- 28. Anders S, Huber W. Differential expression analysis for sequence count data. Genome Biol 2010;11:R106. [DOI] [PMC free article] [PubMed] [Google Scholar]
- 29. Luo W, Friedman MS, Shedden K, Hankenson KD, Woolf PJ. GAGE: generally applicable gene set enrichment for pathway analysis. BMC Bioinformatics 2009;10:161. [DOI] [PMC free article] [PubMed] [Google Scholar]
- 30. Quinn LS, Anderson BG, Strait‐Bodey L, Stroud AM, Argiles JM. Oversecretion of interleukin‐15 from skeletal muscle reduces adiposity. Am J Physiol Endocrinol Metab 2009;296:E191–E202. [DOI] [PMC free article] [PubMed] [Google Scholar]
- 31. Ewens A, Mihich E, Ehrke MJ. Distant metastasis from subcutaneously grown E0771 medullary breast adenocarcinoma. Anticancer Res 2005;25:3905–3915. [PubMed] [Google Scholar]
- 32. Carrasco E, Alvarez PJ, Melguizo C, Prados J, Alvarez‐Manzaneda E, Chahboun R, et al. Novel merosesquiterpene exerts a potent antitumor activity against breast cancer cells in vitro and in vivo. Eur J Med Chem 2014;79:1–12. [DOI] [PubMed] [Google Scholar]
- 33. Sugiura K, Stock CC. Studies in a tumor spectrum. I. Comparison of the action of methylbis (2‐chloroethyl)amine and 3‐bis(2‐chloroethyl)aminomethyl‐4‐methoxymethyl‐5‐hydroxy‐6‐methylpyridine on the growth of a variety of mouse and rat tumors. Cancer 1952;5:382–402. [DOI] [PubMed] [Google Scholar]
- 34. O'Connell G, Guo G, Stricker J, Quinn LS, Ma A, Pistilli EE. Muscle‐specific deletion of exons 2 and 3 of the IL15RA gene in mice: effects on contractile properties of fast and slow muscles. J Appl Physiol (1985) 2015;118:437–448. [DOI] [PubMed] [Google Scholar]
- 35. Pistilli EE, Alway SE, Hollander JM, Wimsatt JH. Aging alters contractile properties and fiber morphology in pigeon skeletal muscle. J Comp Physiol B 2014;184:1031–1039. [DOI] [PubMed] [Google Scholar]
- 36. Burke RE, Levine DN, Tsairis P, Zajac FE 3rd. Physiological types and histochemical profiles in motor units of the cat gastrocnemius. J Physiol 1973;234:723–748. [DOI] [PMC free article] [PubMed] [Google Scholar]
- 37. Irvine D, Vincent L, Graydon JE, Bubela N, Thompson L. The prevalence and correlates of fatigue in patients receiving treatment with chemotherapy and radiotherapy. A comparison with the fatigue experienced by healthy individuals. Cancer Nurs 1994;17:367–378. [PubMed] [Google Scholar]
- 38. Irvine DM, Vincent L, Graydon JE, Bubela N. Fatigue in women with breast cancer receiving radiation therapy. Cancer Nurs 1998;21:127–135. [DOI] [PubMed] [Google Scholar]
- 39. Hofman M, Ryan JL, Figueroa‐Moseley CD, Jean‐Pierre P, Morrow GR. Cancer‐related fatigue: the scale of the problem. Oncologist 2007;12:4–10. [DOI] [PubMed] [Google Scholar]
- 40. Gallagher IJ, Stephens NA, MacDonald AJ, Skipworth RJ, Husi H, Greig CA, et al. Suppression of skeletal muscle turnover in cancer cachexia: evidence from the transcriptome in sequential human muscle biopsies. Clin Cancer Res 2012;18:2817–2827. [DOI] [PubMed] [Google Scholar]
- 41. Parr RB, Obesity In Ehrman JK, Gordon PM, Visich PS, Keteyian SJ, eds. Clinical Exercise Physiology. Champaign, Illinois: Human Kinetics; 2003. p153–167. [Google Scholar]
- 42. Gupta D, Lis CG. Pretreatment serum albumin as a predictor of cancer survival: a systematic review of the epidemiological literature. Nutr J 2010;9. [DOI] [PMC free article] [PubMed] [Google Scholar]
- 43. Zielinski LP, Smith AC, Smith AG, Robinson AJ. Metabolic flexibility of mitochondrial respiratory chain disorders predicted by computer modelling. Mitochondrion 2016;31:45–55. [DOI] [PMC free article] [PubMed] [Google Scholar]
- 44. McLean JB, Moylan JS, Andrade FH. Mitochondria dysfunction in lung cancer‐induced muscle wasting in C2C12 myotubes. Front Physiol 2014;5. [DOI] [PMC free article] [PubMed] [Google Scholar]
- 45. Fan W, Evans R. PPARs and ERRs: molecular mediators of mitochondrial metabolism. Curr Opin Cell Biol 2015;33:49–54. [DOI] [PMC free article] [PubMed] [Google Scholar]
- 46. Dressel U, Allen TL, Pippal JB, Rohde PR, Lau P, Muscat GE. The peroxisome proliferator‐activated receptor beta/delta agonist, GW501516, regulates the expression of genes involved in lipid catabolism and energy uncoupling in skeletal muscle cells. Mol Endocrinol 2003;17:2477–2493. [DOI] [PubMed] [Google Scholar]
- 47. Tzika AA, Fontes‐Oliveira CC, Shestov AA, Constantinou C, Psychogios N, Righi V, et al. Skeletal muscle mitochondrial uncoupling in a murine cancer cachexia model. Int J Oncol 2013;43:886–894. [DOI] [PMC free article] [PubMed] [Google Scholar]
- 48. Constantinou C, Fontes de Oliveira CC, Mintzopoulos D, Busquets S, He J, Kesarwani M, et al. Nuclear magnetic resonance in conjunction with functional genomics suggests mitochondrial dysfunction in a murine model of cancer cachexia. Int J Mol Med 2011;27:15–24. [DOI] [PMC free article] [PubMed] [Google Scholar]
- 49. Collins P, Bing C, McCulloch P, Williams G. Muscle UCP‐3 mRNA levels are elevated in weight loss associated with gastrointestinal adenocarcinoma in humans. Br J Cancer 2002;86:372–375. [DOI] [PMC free article] [PubMed] [Google Scholar]
- 50. Carson JA, Hardee JP, VanderVeen BN. The emerging role of skeletal muscle oxidative metabolism as a biological target and cellular regulator of cancer‐induced muscle wasting. Semin Cell Dev Biol 2016;54:53–67. [DOI] [PMC free article] [PubMed] [Google Scholar]
- 51. von Haehling S, Morley JE, Coats AJS, Anker SD. Ethical guidelines for publishing in the Journal of Cachexia, Sarcopenia and Muscle: update 2017. J Cachexia Sarcopenia Muscle 2017;8:1081–1083. [DOI] [PMC free article] [PubMed] [Google Scholar]